Road Marking Management System : a pre-study
28
0
0
Full text
(2)
(3) Preface This study can be seen as an extension of a road marking strategy project carried out in Norway. The project was initiated by the Norwegian Public Roads Administration and performed by Rambøll RST AB. Trond Cato Johansen was responsible for the project. With the purpose to illustrate a road marking management system, data was used in order to develop a RMMS model. This additional work was carried out by Sven-Olof Lundkvist, VTI, and financed by the Swedish Road Administration, where Hans G Holmén was the project leader. Linköping December 2009. Sven-Olof Lundkvist. Dnr: 2009/0252-26. VTI notat 21A-2009.
(4) Quality review Review seminar was carried out on 7 December 2009 where Jan Andersson reviewed and commented on the report. Sven-Olof Lundkvist has made alterations to the final manuscript of the report. The research director of the project manager Jan Andersson examined and approved the report for publication on 8 December 2009.. Kvalitetsgranskning Granskningsseminarium genomfört 2009-12-07 där Jan Andersson var lektör. Sven-Olof Lundkvist har genomfört justeringar av slutligt rapportmanus. Projektledarens närmaste chef Jan Andersson har därefter granskat och godkänt publikationen för publicering 2009-12-08.. VTI notat 21A-2009.
(5) Table of contents Summary ............................................................................................................ 5 Sammanfattning ................................................................................................. 7 1. Background.............................................................................................. 9. 2. The use of Road Marking Management Systems .................................. 10. 3. The development of a RMMS model ..................................................... 11. 4 4.1 4.2 4.3 4.4. An example of RMMS ............................................................................ 13 Road marking strategy in Norway.......................................................... 13 Development of RMMS.......................................................................... 13 Results from Region East ...................................................................... 15 Results from Region South .................................................................... 18. 5. Discussion ............................................................................................. 21. 6. Proposal for an European RMMS study ................................................ 22. References ....................................................................................................... 23. VTI notat 21A-2009.
(6) VTI notat 21A-2009.
(7) Road Marking Management System – a pre-study by Sven-Olof Lundkvist and Trond Cato Johansen ∗ VTI (Swedish National Road and Transport Research Institute) SE-581 95 Linköping Sweden. Summary Pavement Management Systems – PMS – are used for the judgement of the need of maintenance of road surfaces. From relevant parameters, like ADT (Average Daily Traffic), lane width, type of stone material, etc, the deterioration of the pavement and the time for repaving can be predicted. This is a valuable tool to the road keeper, used for judgement of necessary maintenance measures. Developing a similar tool concerning road markings would be of great value as road markings, like road surfaces, are worn by the traffic and need regular maintenance. In 2008, a road marking strategy project was initiated in Norway by the Norwegian Public Roads Administration (NPRA) and Rambøll RST. The aim of this project is to ensure high road marking quality to low life-cycle cost (LCC). The project involves a large number of measurements over at least three years, i.e. the performance of road markings is checked using mobile equipment from the year of application and years ahead. Data from the two initial years of this project has been used for giving an example of how a Road Marking Management Models (RMMS) can be developed. A model was developed from data from Region East in Norway and used for prediction of the road marking retroreflectivity in Region South and for comparing these prediction with the measured retroreflectivity in this latter region. The results show that the model fits extremely well for one year old road markings; the deviation between predicted and measured values is only 4%. For new road markings the corresponding deviation is 12%. This larger deviation could be expected, as the performance of new road markings mainly is due to the number of drop-on-beads on the surface, and this number may vary. It is important to stress that the RMMS in this study is very simple and not very useful; it must be seen as an example of how a model can be developed, only. However, it is suggested that more useful models will be developed, as a suggestion within the work of CEN TC226/WG2.. ∗. Rambøll RST. VTI notat 21A-2009. 5.
(8) 6. VTI notat 21A-2009.
(9) Road Marking Management System – en förstudie av Sven-Olof Lundkvist och Trond Cato Johansen ∗ VTI 581 95 Linköping. Sammanfattning Pavement Management Systems – PMS – används för att avgöra var och när underhållsåtgärder på vägbeläggningar ska sättas in. PMS arbetar med modeller som innehåller relevanta variabler som har bedömts påverka tidpunkten för underhåll, såsom årsdygnstrafik, körfältsbredd, stenmaterial i beläggningen, etc. PMS är ett viktigt verktyg som hjälper väghållaren att använda medlen för underhållsåtgärder på ett optimalt sätt. Det skulle vara önskvärt att utveckla ett motsvarande verktyg för vägmarkeringar eftersom dessa, liksom vägbeläggningarna, utsätts för ett ständigt slitage från trafiken. År 2008 initierades i Norge ett projekt med syfte att utveckla en optimal vägmarkeringsstrategi, det vill säga man vill uppnå en bra funktion (synbarhet) över tiden till lägsta livscykelkostnad, LCC. Arbetet omfattar ett stort antal mobila mätningar av vägmarkeringarnas retroreflexion i två regioner i södra Norge, Region Øst och Region Sør. Mätningarna påbörjades på nya markeringar år 2008 och kommer att pågå åtminstone till och med år 2010. Data från de två inledande årens mätningar har använts för att med ett exempel visa hur ett Road Marking Management System (RMMS) skulle kunna utvecklas. I föreliggande studie användes data från Region Øst för att utveckla två RMMS-modeller – en för kant- och en för mittlinjer. Dessa två modeller applicerades därefter på vägmarkeringar i Region Sør, det vill säga vägmarkeringarnas retroreflexion i denna region predicerades på basis av modellerna från Region Øst. Slutligen jämfördes den predicerade retroreflexionen med den i verkligheten uppmätta. Resultaten visar att den absoluta avvikelsen mellan predicerade och uppmätta värden i medeltal var 4 % för ett år gamla vägmarkeringar. För nya markeringar var den högre – 12 % – vilket sannolikt förklaras av att för dessa är retroreflexionen endast avhängig antalet drop-on-pärlor som har applicerats på ytan och denna mängd kan variera. Det är viktigt att understryka att denna studie är baserad på data från endast två års mätningar och resultatet är därför mindre intressant och mindre användbart. Studien har främst som syfte att visa hur en RMMS-modell kan byggas och användas. Emellertid föreslås också att mer användbara modeller utvecklas, exempelvis inom standardiseringsarbetet som pågår i CEN TC226/WG2.. ∗. Rambøll RST. VTI notat 21A-2009. 7.
(10) 8. VTI notat 21A-2009.
(11) 1. Background. Regarding road surfaces, Pavement Management Systems – PMS – are used for judgement of the need of maintenance, which has been described by among others Schmith (1992). From relevant parameters, like ADT (Average Daily Traffic), lane width, type of stone material, etc, the deterioration of the pavement and the time for repaving can be predicted. This is a valuable tool for the road keeper, used for judgement of necessary maintenance measures. Developing a similar tool concerning road markings would be of great value as road markings, like road surfaces, are worn by the traffic and need regular maintenance. In USA, one so-called PMMS’s (Pavement Markings Management Systems) have been developed by the Iowa State University (2005). However, this and other US systems focus on data collection; readings of retroreflectivity are stored in a data base for future judgement of maintenance of road marking. It should be possible to take one step further, i.e. to implement data into a statistical model used for objective, optimal decision of road marking maintenance. Such a model would predict the need of road marking maintenance for different types of road marking materials applied on different types of roads. In other words, from variables which are estimated being relevant for road marking deterioration, road marking performance may be predicted (calculated). This report describes an example on how to develop a Road Marking Management System, RMMS in southern Norway.. VTI notat 21A-2009. 9.
(12) 2. The use of Road Marking Management Systems. Today, the need of maintenance of road markings is mostly judged visually during office hours, i.e. in daylight. Studies in Sweden (Lundkvist, 1998) have shown that such judgements may lead to an entirely wrong decision regarding maintenance measures, i.e. road markings that should have been renewed are not, and the opposite: measures are carried out on road markings which perform well. In such cases the use of RMMS would be a benefit, meaning that the risk of unneeded maintenance measures is minimized and, also, that the risk of missing a measure is reduced. Furthermore, RMMS can point out road markings that absolutely fulfil the requirement, i.e. where physical measurement only would be a waste of money. This money can instead be spent on roads where the performance of the road markings is getting close to the limit value of retroreflectivity. Finally, RMMS can be used for defining a road marking strategy, which means that the model can tell which road marking material to use where, in order to minimize the life cycle cost (LCC). It must be stressed that RMMS never can replace measurements. Instead, RMMS should be seen as a tool optimizing the usefulness of measurements, helping the road keeper to decide about maintenance and also to get an optimal road marking strategy to a low cost. Furthermore, it should be noted that development of RMMS requires some type of road marking register. Such a register must contain all adequate information regarding the road markings on a specific road, e.g. type of material, time of application, contractor, etc. Using RMMS means that the performance is predicted, and predictions always suffer from an uncertainty which is larger than the errors in the physical measurements. Therefore, it is important that the measurements which RMMS is based on show good accuracy. When the prediction shows a retroreflective close to the limit (e.g. 100 mcd/m2/lx), a more precise physical measurement may be necessary in order to make correct decision regarding maintenance.. 10. VTI notat 21A-2009.
(13) 3. The development of a RMMS model. RMMS is based on an analysis of variance (ANOVA), using one or more (in Eqn. 1 three) independent variables: Yijk = μ + α i + β j + γ k + ( α × β )ij + ( α × γ )ik + ( β × γ ) jk + ( α × β × γ )ijk + ε. (1). where Y is the dependent (response) variable, μ is the intercept, α, β, γ are the independent (explanatory) variables and ε the error term. Two or more independent variable might interact which is denoted “×” in Eqn. 1. The dependent variable is on a continuous scale, while the independent variables must be discrete, i.e. data is on a nominal or ordinal scale. An important question is which variables are relevant in a RMMS? In other words, which independent variables might contribute to the model, making it more accurate? Within CEN226/WG2, the “durability project” was carried out and in the final report (Sørensen, 2008) this matter is discussed. The results are not clear, but variables that may be relevant are: • • • • • • • •. TIME (after application) MATERIAL (thermoplastic, sprayplastic, paint, etc.) THICKNESS (when applied) TYPE (edge line, centreline, etc.) LOCATION (coastal, inland, etc.) STUDDED tyres (yes or no) ADT (average daily traffic) Pavement ROUGHNESS. Other variables that may influence the performance and life length of the road markings are: DESIGN (plane, profiled), INTERMITTENCE (broken, continuous), ROAD TYPE (motorway, two-lane wide road, narrow road, etc.), CURVATURE of the road, CONTRACTOR and COLOUR (white, yellow). As many as 14 variables are mentioned above. One single model using such a large number of variables will be too complex and confusing. Therefore, it is appropriate to develop several models, each comprising less number of variables. As an example one model may refer to countries where studded tyres are used, another model may refer to coastal roads, etc. Which variables among the above mentioned should definitely be included in a model? If TIME, MATERIAL, ROAD, TYPE and ADT are in the model, questions like: “When must next maintenance measure take place if this material has been applied on the road with that number of vehicles per day?”, “Which road marking material should preferably be used on a motorway lane line?” can be answered. As an example, one model using those five variables may be developed for each level of LOCATION (levels: coastal, inland, mountainous), DESIGN (levels: plane, profile), ROUGHNESS (levels: smooth, rough), etc. However, exactly which variables which are to be included must be discussed and decided by a group of experts, as a suggestion the “durability group” of WG2.. VTI notat 21A-2009. 11.
(14) The model in Eqn. 1 has three independent variables, each with a specific number of levels, specified by its index. As an example MATERIAL may have index j, with possible levels j = 1, thermoplastic, j = 2, sprayplastic and j = 3, paint. The outcome of the analysis of variance is the values of the parameters in Eqn. 1, where each level of index i, j and k is given a fixed value. Those parameter estimates are used for prediction of the road marking performance. In the following chapter, this will be illustrated in an example, using data from the measurements carried out in Norway 2008 and 2009.. 12. VTI notat 21A-2009.
(15) 4. An example of RMMS. 4.1. Road marking strategy in Norway. In 2008, a road marking strategy project was initiated in Norway by the Norwegian Public Roads Administration (NPRA) and Rambøll RST. The aim of this project is to ensure high road marking quality to low life-cycle cost (LCC). The project involves a large number of measurements over at least three years, i.e. the night-time performance of road markings is checked starting the year of application and years ahead, using mobile equipment.. 4.2. Development of RMMS. At the present point of time, December 2009, measurements have been carried on new road markings, 2008, and on one year old markings, 2009 in Region East and Region South in Norway. All measurements were performed on dry road markings, using a mobile equipment of type Ecodyn 30, registering the retroreflectivity of the marking. If an object is defined as an edge line or a centreline, measurement was carried out on 250 objects, each of length approximately 2 – 10 km. The distribution of the objects into types of road marking and region is shown in Table 1. Table 1 The number of objects measured per year. Region. Number of. Number of. edgelines. centrelines. Total. East. 93. 27. 120. South. 99. 31. 130. Total. 192. 58. 250. For each object a number of explanatory variables were registered, such as road marking material, contractor, road width, average daily traffic, etc. Table 2 shows an initial analysis estimating how much each explanatory variable will contribute to a model (highest contribution first). The effect of type of road marking (edge or centre line) is large which is quite obvious as centrelines in Norway are yellow and edge lines white. Therefore, these two types of road markings are handled separately.. VTI notat 21A-2009. 13.
(16) Table 2 Effects of the explanatory variables showing significance and estimated effect size. Edge lines Explanatory variable. Significance. Centrelines. Effect size. level. η. 2. Significance. Effect size. level. η2. Age (new or one year old). p < .001. 0.32. p < .001. 0.51. Salting (yes or no). p < .005. 0.03. p < .05. 0.07. Contractor (1 or 2). p > .05. 0.00. p < .005. 0.10. Material (therm, spray or paint). p < .05. 0.02. *. Curves (small to large radii). p > .05. 0.01. p < .05. 0.07. ADT. p > .05. 0.00. p > .05. 0.06. Road width. p > .05. 0.01. p > .05. 0.03. Location (coastal, inland, etc.). p > .05. 0.01. p > .05. 0.02. *. * Only thermoplastic centrelines were measured. In Table 2, η2, shows the effect size. This parameter tells how large part of the total variance in the measurements which can be explained by a certain independent variable. As an example it is estimated that 6 % of the total variance in the retroreflectivity of centre lines is explained by differences in ADT among the measured objects. More than half of the variance (51 %) is due to drop in performance during the year. Table 2 shows that the effect of age is strong and significant (p<.001) both for edge and centrelines, and it is quite obvious that this variable must be included in model. However, it is more difficult to decide what other variables to include as several of those interact. As an example, paint is used only on roads with little traffic and these roads may also be narrow and located in the sparsely-populated inland. Because of the interaction between these variables, it is not reasonable to include more than one of these variables, e.g. material. Furthermore, of special interest to the road keeper may be to include contractor in a model as he can control this variable; he is free to choose the contractor which means high quality to a low cost. Consequently, in this example of a RMMS model, age, material and contractor will be included. Thus, the RMMS model, Eqn. 2, will be: RL = μ + AGEi + MTL j + CTRk + ( AGE × MTL )ij + ( AGE × CTR )ik + ( MTL × CTR ) jk + ( AGE × MTL × CTR )ijk + ε. where AGE is age of the road marking (new or one year old), MTL is the road marking material (thermoplastic, sprayplastic or paint) and CTR is the contractor (contractor 1 or contractor 2). Data from Region East was used to develop the RMMS. This model was then used to predict the performance of the road markings in Region South.. 14. VTI notat 21A-2009.
(17) 4.3. Results from Region East. In the following the unit of retroreflectivity in most cases is omitted. However, it is always given in mcd/m2/lx. Tables 3 and 4 show the average retroreflectivity of the road markings in Region East for edge and centrelines, respectively. Table 3 Measured average retroreflectivity of dry edge lines in Region East 2008 and 2009. Age. RL. n. Material. Contractor. thermoplastic. contractor 1 (k = 1). 290. 15. (j = 1). contractor 2 (k = 2). 243. 47. sprayplastic. contractor 1 (k = 1). 298. 19. (j = 2). contractor 2 (k = 2). 245. 4. paint. contractor 1 (k = 1). 348. 8. (j = 3). contractor 2 (k = 2). –. 0. 1 year old. thermoplastic. contractor 1 (k = 1). 180. 15. (i = 1). (j = 1). contractor 2 (k = 2). 196. 47. sprayplastic. contractor 1 (k = 1). 237. 19. (j = 2). contractor 2 (k = 2). 213. 4. paint. contractor 1 (k = 1). 281. 8. (j = 3). contractor 2 (k = 2). –. 0. (i = 0). VTI notat 21A-2009. (average). 15.
(18) Table 4 Measured average retroreflectivity of dry centrelines in Region East 2008 and 2009. RL. n. Age. Material. Contractor. new. thermoplastic. contractor 1 (k = 1). 203. 12. (i = 0). (j = 1). contractor 2 (k = 2). 137. 15. sprayplastic. contractor 1 (k = 1). –. 0. (j = 2). contractor 2 (k = 2). –. 0. paint. contractor 1 (k = 1). –. 0. (j = 3). contractor 2 (k = 2). –. 0. 1 year old. thermoplastic. contractor 1 (k = 1). 130. 12. (i = 1). (j = 1). contractor 2 (k = 2). 83. 15. sprayplastic. contractor 1 (k = 1). –. 0. (j = 2). contractor 2 (k = 2). –. 0. paint. contractor 1 (k = 1). –. 0. (j = 3). contractor 2 (k = 2). –. 0. (average). There are no observations in some cells in Tables 3 and 4. The reason for this is that contractor 2 has not applied any edge lines using paint and centre lines have always been applied using thermoplastic materials. Table 5 and 6 show the parameter estimates which are the outcome of two ANOVA’s; one regarding edge lines and one regarding centrelines.. 16. VTI notat 21A-2009.
(19) Table 5 Parameter estimates for edge lines based on data from Region East. Response variable. Index. constant (μ) AGE MTL. CTR AGE × MTL. AGE × CTR MTL × CTR AGE × MTL × CTR. Parameter estimation 256. i=0. 39. i=1. 0. j=1. -60. j=2. -43. j=3. 0. k=1. 24. k=2. 0. i,j = 0,1. 8. i,j = 0,2. -7. others. 0. i,k = 0,1. 28. others. 0. j,k = 1,1. -41. others. 0. i,j,k = 0,1,1. 34. others. 0. Table 6 Parameter estimates for centrelines based on data from Region East. Response variable. Index. constant (μ) AGE CTR AGE × CTR. Parameter estimation. 83 i=0. 54. i=1. 0. k=1. 47. k=2. 0. i,k = 0,1. 19. others. 0. By inserting the estimates in Tables 5 and 6 into Eqn. 2, it is possible to estimate the retroreflectivity. Example: A new (i = 0) thermoplastic (j = 1) edge line (Table 5) applied by contractor 1 (k = 1) has the estimated retroreflectivity. RL = 256 + 39 − 60 + 24 + 8 + 28 − 41 + 34 = 288. VTI notat 21A-2009. 17.
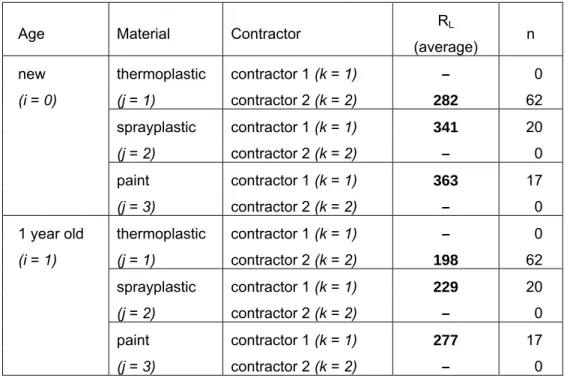
(20) An one year old (i = 1) sprayplastic (j = 2) edge line (Table 5) applied by contractor 2 has the estimated retroreflectivity. RL = 256 + 0 − 43 + 0 − 0 + 0 + 0 + 0 = 213 An one year old (i = 0) thermoplastic (j = 1) centreline (Table 6) applied by contractor 1 (k = 1) has the retroreflectivity. RL = 83 + 0 + 47 + 0 = 130 In region East these estimated values will be very close to the measured ones, as the estimates are based on data from this region. The deviation between measured and predicted values is described by the error term, ε, in Eqn. 1. Now, of interest is if these estimates can be used for prediction of the performance of road markings in Region South. This matter will be handled in the next section.. 4.4. Results from Region South. Tables 7 and 8 show the measured average retroreflectivity of the road markings in Region East for edge and centrelines, respectively. Table 7 Measured average retroreflectivity of dry edge lines in Region South 2008 and 2009.. 18. RL. n. Age. Material. Contractor. new. thermoplastic. contractor 1 (k = 1). –. 0. (i = 0). (j = 1). contractor 2 (k = 2). 282. 62. sprayplastic. contractor 1 (k = 1). 341. 20. (j = 2). contractor 2 (k = 2). –. 0. paint. contractor 1 (k = 1). 363. 17. (j = 3). contractor 2 (k = 2). –. 0. 1 year old. thermoplastic. contractor 1 (k = 1). –. 0. (i = 1). (j = 1). contractor 2 (k = 2). 198. 62. sprayplastic. contractor 1 (k = 1). 229. 20. (j = 2). contractor 2 (k = 2). –. 0. paint. contractor 1 (k = 1). 277. 17. (j = 3). contractor 2 (k = 2). –. 0. (average). VTI notat 21A-2009.
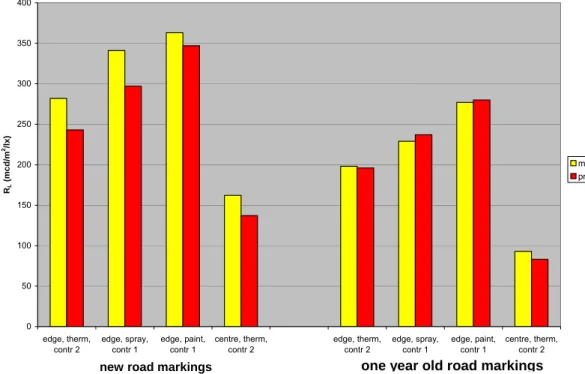
(21) Table 8 Average retroreflectivity of dry centrelines in Region South 2008 and 2009. RL. n. Age. Material. Contractor. new. thermoplastic. contractor 1 (k = 1). –. 0. (i = 0). (j = 1). contractor 2 (k = 2). 163. 31. sprayplastic. contractor 1 (k = 1). –. 0. (j = 2). contractor 2 (k = 2). –. 0. paint. contractor 1 (k = 1). –. 0. (j = 3). contractor 2 (k = 2). –. 0. 1 year old. thermoplastic. contractor 1 (k = 1). –. 0. (i = 1). (j = 1). contractor 2 (k = 2). 93. 31. sprayplastic. contractor 1 (k = 1). –. 0. (j = 2). contractor 2 (k = 2). –. 0. paint. contractor 1 (k = 1). –. 0. (j = 3). contractor 2 (k = 2). –. 0. (average). First, let us study the three edge lines and the only centreline where there are any observations in Region South. Table 8 and figure 1 show the measured and the predicted RLvalues. Table 9 Measured and predicted retroreflectivity in Region South. AGE. MTL. CTR. TYPE. Measured. Predicted. Deviation. RL. RL. %. New. Therm.. 2. Edge. 282. 243. -14. New. Spray. 1. Edge. 341. 297. -13. New. Paint. 1. Edge. 363. 347. -4. New. Therm.. 2. Centre. 163. 137. -16. One year old. Therm.. 2. Edge. 198. 196. +1. One year old. Spray. 1. Edge. 229. 237. +3. One year old. Paint. 1. Edge. 277. 280. +1. One year old. Therm.. 2. Centre. 93. 83. +11. VTI notat 21A-2009. 19.
(22) 400. 350. 300. RL (mcd/m2/lx). 250. measured predicted. 200. 150. 100. 50. 0 edge, therm, contr 2. edge, spray, contr 1. edge, paint, contr 1. new road markings. centre, therm, contr 2. edge, therm, contr 2. edge, spray, contr 1. edge, paint, contr 1. centre, therm, contr 2. one year old road markings. Figure 1 Comparison of measured and predicted retroreflectivity. Table 9 and Figure 1 show that the deviation between measure and predicted values is larger for new road markings (12 %) than for markings which have been worn one year (4 %). This was expected, as the retroreflectivity of a new marking mainly is due to the number of drop-on-beads on its surface. Apparently, the new markings in Region East had more drop-on-beads than those in Region South. In countries where studded tyres are used, the performance of a worn road marking is given by the number of pre-mixbeads that work. This number should approximately be equal in the two regions, when the contractor has applied the same material. Therefore, the chance showing a good prediction may be better for worn markings, which also can be seen in figure 1.. 20. VTI notat 21A-2009.
(23) 5. Discussion. The predictions made in this section are not too exciting, which is explained by the fact that the model developed is rather simple: The road markings have been worn for only one year and have generally a performance far higher than the requirement. Furthermore, many parameters which may be of interested have not been included, like salting, road width, road curvature, etc. In a real RMMS tool such variables must be considered, and if they are significant in an ANOVA, they should be included. However, this study just shows an example of how to develop a RMMS model, and even if it is simple it gives us some information: Let us assume that the road keeper in Region West (where no measurements have been carried out) will plan the road marking investment for the next year. Region West has about the same climatic conditions as Region East and consequently the models in Tables 5 and 6 can be used. Examples: •. For edge lines, paint from contractor 1 will show the highest initial retroreflectivity, 347 mcd/m2/lx.. •. One year later, the retroreflectivity of this paint still has good performance, showing a retroreflectivity of 280 mcd/m2/lx. However, also paint from contractor 2 show high retroreflectivity, 256 mcd/m2/lx.. •. On E18, where thermoplastic has to be used because of high traffic load, a material from contractor 2 is to prefer. This material has a value of 243 when it is new and drops to 196 in one year – a loss of 19 % of the initial retroreflectivity. A thermoplastic from contractor 1 will lose as much as 38 % of its initial value, dropping from 288 to 179 in one year.. •. For centre lines, yellow thermoplastic materials are used in Norway. One year after application such a material from contractor 2 will show the retroreflectivity 83, which is close to the regulated value, 80. A thermoplastic from contractor 1 will show better retroreflectivity – 130.. Of course our model still misses data from road markings older than one year. Of special interest is to predict the life length in order to calculate the life cycle cost. However, in our case only data from new and one year old markings exist, which makes the model of less interest. However, as an example how to develop a RMMS model it has been useful.. VTI notat 21A-2009. 21.
(24) 6. Proposal for an European RMMS study. The Norwegian project, presented in Chapter 4, is just an example how a RMMS model can be developed from registered data. In this case, two regions in Norway were used, one to build the model, and one for validation. The number of variables registered was limited and, as mentioned before, only data from two years were available. Measurements of road marking retroreflectivity are carried out in many countries all over Europe every year. Data from these measurements may be used for development of RMMS models. All needed is registration of relevant explanatory (independent) variables along with the measurements. Thereafter, the proposal is to use the Norwegian design of the study, i.e. finding comparable climatic zones (countries) and use one for developing the model and the other for validation. For example, one model could be developed in Czech Republic and validated in Poland. Other pair of countries could be the Netherlands/Belgium, Sweden/Finland, etc. Initially, a working group with one person from each country that has an interest to participate in the study should be formed. Those people could possibly be found within the “durability group”. Each member of the working group is responsible for data collection in his/her own country and reporting to the project management. If the planning of the project is carried out during 2010, data collection could start 2011. From this data, RMMS adapted to any country that have an interest in such a tool, could be developed and used in order to optimize the road marking strategy.. 22. VTI notat 21A-2009.
(25) References Hawkins, R. et al., Iowa Pavement Marking System: Initial Phase, Center for Transportation Research and Education, Iowa State University, Ames, IO, USA, 2005. Lundkvist, S-O., Visual inspection of road marking performance (Swedish), VTI Notat 28–1998, Linköping, Sweden, 1998. Schmith, J.B. Pavement Management Systems in Europe, Transport Research Laboratory, Wokingham, United Kingdom, 1992. Sørensen, K., Report for the durability project, Delta Light & Optics, CEN 226/WG2, Hørsholm, Denmark, 2008.. VTI notat 21A-2009. 23.
(26) VTI notat 21A-2009.
(27)
(28) www.vti.se vti@vti.se. VTI är ett oberoende och internationellt framstående forskningsinstitut som arbetar med forskning och utveckling inom transportsektorn. Vi arbetar med samtliga trafikslag och kärnkompetensen finns inom områdena säkerhet, ekonomi, miljö, trafik- och transportanalys, beteende och samspel mellan människa-fordon-transportsystem samt inom vägkonstruktion, drift och underhåll. VTI är världsledande inom ett flertal områden, till exempel simulatorteknik. VTI har tjänster som sträcker sig från förstudier, oberoende kvalificerade utredningar och expertutlåtanden till projektledning samt forskning och utveckling. Vår tekniska utrustning består bland annat av körsimulatorer för väg- och järnvägstrafik, väglaboratorium, däckprovningsanläggning, krockbanor och mycket mer. Vi kan även erbjuda ett brett utbud av kurser och seminarier inom transportområdet. VTI is an independent, internationally outstanding research institute which is engaged on research and development in the transport sector. Our work covers all modes, and our core competence is in the fields of safety, economy, environment, traffic and transport analysis, behaviour and the man-vehicle-transport system interaction, and in road design, operation and maintenance. VTI is a world leader in several areas, for instance in simulator technology. VTI provides services ranging from preliminary studies, highlevel independent investigations and expert statements to project management, research and development. Our technical equipment includes driving simulators for road and rail traffic, a road laboratory, a tyre testing facility, crash tracks and a lot more. We can also offer a broad selection of courses and seminars in the field of transport.. HUVUDKONTOR/HEAD OFFICE. LINKÖPING POST/MAIL SE-581 95 LINKÖPING TEL +46(0)13 20 40 00 www.vti.se. BORLÄNGE POST/MAIL BOX 920 SE-781 27 BORLÄNGE TEL +46 (0)243 446 860. STOCKHOLM POST/MAIL BOX 55685 SE-102 15 STOCKHOLM TEL +46 (0)8 555 770 20. GÖTEBORG POST/MAIL BOX 8077 SE-402 78 GÖTEBORG TEL +46 (0)31 750 26 00.
(29)
Figure


+5


Related documents
46 Konkreta exempel skulle kunna vara främjandeinsatser för affärsänglar/affärsängelnätverk, skapa arenor där aktörer från utbuds- och efterfrågesidan kan mötas eller
- en del av uppgifterna som ligger till grund för bedömningarna är på grund av föregående anmärkningar inte rimligt säkerställda FÖRE bedömningar görs.. - i
att den svenska kyrkan, om ock med vissa modifikationer, i både yttre och inre avseende är underordnad staten enligt det på na- turrätten uppbyggda
Indignerade tonfall, annat än som uttryck för en irritation över vad man tycker vara en oklok politik hade det inte funnits anledning till - än mindre någon
Sedan sexton år tillbaka har tre miljoner flyktingar på detta sätt uttryckt sin avsky mot kommunis- men och även efter Ulbricht- murens uppförande den 14 augusti
Sårad av denna vägran, som han Uppfattade som en personlig föro- lämpning, grep då de Gaulle själv initiativet för att, rebellernas hjälp förutan, skapa ett
Den ingår i avgiften till HSB oavsett om vi är medlem eller inte.. Allt är frid och fröjd -
Även en furste kan lyssna till rådgivare, den blodigaste tyrann kan en dag ställas inför sitt folk som reser sig mot allt för- tryck, men det suveräna Folket har inga
