Mälardalen University Press Licentiate Theses No. 172
PV WATER PUMPING SYSTEMS FOR
GRASSLAND AND FARMLAND CONSERVATION
Pietro Elia Campana 2013
School of Business, Society and Engineering Mälardalen University Press Licentiate Theses
No. 172
PV WATER PUMPING SYSTEMS FOR
GRASSLAND AND FARMLAND CONSERVATION
Pietro Elia Campana 2013
Copyright © Pietro Elia Campana, 2013 ISBN 978-91-7485-127-4
ISSN 1651-9256
Summary
Grassland degradation is considered as one of the worst environmental and economic problems in China because of the negative impacts on water and food security. The application of the photovoltaic water pumping (PVWP) technology for irrigation is an innovative and sustainable solution to curb the progress of grassland desertification and to promote the conservation of farmland in remote areas. The combination of PVWP with water saving irri-gation techniques and the sustainable management of the water resources enhances the grass productivity enabling to halt wind and rainfall erosion and to provide higher incomes and better living conditions for farmers. PVWP systems have been used for more than 40 years especially for drink-ing purposes, livestock waterdrink-ing and irrigation in small-medium size appli-cations. Nevertheless, several knowledge gaps still exist and system failures still occur, which are mainly bounded to the system design procedure and optimization. The technical and economic feasibilities related to the system implementation, especially effectiveness and profitability, need to be ad-dressed. Moreover, irrigation in remote areas constrained by availability of water resources has to be investigated for a better understanding of PVWP system integration with the environment and for optimization purposes. This thesis is to bridge the current knowledge gaps, optimize system implementa-tion and prevent system failures.
Validation of the models adopted and optimization of the system on the basis of solar energy resources and exploitable groundwater has been per-formed for a pilot PVWP system in Inner Mongolia. The match between the water supplied through the pumping system and the grass water demand has been studied, and the effects of pumping on the available resources and the crop productivity have been evaluated. The economic analyses have also been conducted in order to establish the most cost effective solution to pro-vide water for irrigation and to evaluate the project profitability. In addition, the CO2 emission reductions by using PV technology have been assessed as well.
It was found that the proper designed PVWP system represents the best technical and economic solution to provide water for irrigation in the remote areas compared to other water pumping technologies, such as diesel water pumping and wind water pumping due to the high positive net present values and short payback periods.
Sammanfattning
Degradation av grässlätter anses vara en av de värsta miljömässiga och eko-nomiska problemen i Kina, på grund av dess negativa påverkan på vatten och matproduktion. Tillämpningen av fotovoltaisk vattenpumpsteknologi (PVWP) för konstbevattning är en innovativ och hållbar lösning för att för-hindra att grässlätter förvandlas till öknar och för att gynna bevarandet av jordbruksmark i avlägsna områden. Kombinationen av PVWP med vattenbe-sparande konstbevattningstekniker och hållbart användande av vattenresur-ser ökar produktiviteten av gräs, vilket gör det möjligt att stoppa erosion (orsakad av vind och nederbörd) samt att skapa högre inkomster och bättre levnadsvillkor för jordbrukarna.
PVWP-system har använts i mer än 40 år, i synnerhet för dricksvattenän-damål, för vatten till djur och för konstbevattning i små och medelstora till-lämpningar. Likväl finns fortfarande åtskilliga kunskapsluckor och det in-träffar fortfarande fel i systemen, vilket primärt hör ihop med procedurer inom systemdesign och optimering. De tekniska och ekonomiska möjlighet-erna som hör ihop med systemets implementering, speciellt dess effektivitet och möjligheter till lönsamhet, behöver adresseras. Vidare är det så att konstbevattning i avlägsna områden med begränsad tillgång på vatten behö-ver undersökas för att uppnå en bättre förståelse av PVWP-systemets integ-ration med omgivningen och i syfte att uppnå optimala förhållanden. Denna avhandling syftar till att överbrygga dagens kunskapsluckor, optimera sys-temets implementering och förhindra fel i systemet.
Validering av antagna modeller och optimering av systemet, baserat på resurser från solenergi och exploaterbart grundvatten, har genomförts för ett PVWP-pilotsystem i inre Mongoliet. Förhållandet mellan mängden vatten som pumpas genom systemet och behovet av gräsvatten har studerats, och effekterna för tillgängliga resurser och för grödornas produktivitet har utvär-derats. Ekonomiska analyser har också utförts för att fastställa den mest kostnadseffektiva lösningen för anskaffandet av vatten till konstbevattning och för att bedöma projektets lönsamhet. Utöver detta har även reduktionen av koldioxidutsläpp, genom bruket av PV-teknologi, bedömts.
Slutsatsen som uppnåddes var att rätt designade PVWP-system represen-terar den bästa tekniska och ekonomiska lösningen för att anskaffa vatten till konstbevattning i avlägsna områden – i jämförelse med andra metoder för att pumpa vatten, såsom diesel- eller vindkraftsdrivna vattenpumpar – genom det höga positiva kapitalvärdet och de korta återbetalningstiderna.
List of Papers
This thesis is based on the following papers, which are referred to in the text by their Roman numerals:
I. P.E. Campana, H. Li, J. Yan, ―Dynamic Modelling of a PV pumping system with special consideration on water demand‖, Applied Energy 112 (2013) 635–645
II. P.E. Campana, A. Olsson, H. Li, J, Yan, ―An economic analysis of pho-tovoltaic water pumping systems for irrigation‖, 5th Int. Conf. on Ap-plied Energy (ICAE 2013), July 2-4, Pretoria, South Africa (recom-mended for publication to the International Journal of Green Energy) III. P.E. Campana, J. Zhang, R. Zhang, H. Li, J. Liu, J. Yan, ―Photovoltaic
water pumping systems for irrigation: system validation and optimiza-tion‖, submitted to Renewable Energy
IV. P.E. Campana, H. Li, J. Yan, ―Techno-economic feasibility of the irriga-tion system for the grassland conservairriga-tion in China: photovoltaic vs. wind energy water pumping‖, to be submitted
List of Papers Not Included
I. U. Desideri, P.E. Campana, ―Analysis and comparison between a con-centrating solar and a photovoltaic power plant‖, Applied Energy 113 (2014) 422–433
II. H. Li, J. Yan, P. E. Campana, ―Feasibility of integrating solar energy into a power plant with amine-based chemical absorption for CO2 cap-ture‖, International Journal of Greenhouse Gas Control, 9, pp. 272-280, 2012
III. A. Olsson, P.E. Campana, M. Lind, J. Yan, ―Potential for carbon seques-tration and mitigation of climate change by irrigation of grasslands‖, 5th Int. Conf. on Applied Energy (ICAE 2013), July 2-4, Pretoria, South Af-rica
IV. J. Zhang, P.E. Campana, J. Liu, R. Zhang, J. Yan, ―Model of evapotran-spiration and groundwater level based on photovoltaic water pumping system‖, 5th Int. Conf. on Applied Energy (ICAE 2013), July 2-4, Preto-ria, South Africa
V. C.L. Azimoh, B. Karlsson, F. Wallin, P. Klintenberg, S.P. Chowdhury, S. Chowdhury, P.E. Campana, ―The energy loss in guiding against equipment theft in Thlatlaganya Village, South Africa‖, 5th Int. Conf. on Applied Energy (ICAE 2013), July 2-4, Pretoria, South Africa
Contents
Introduction ... 1
Background ... 1
Knowledge gaps and challenges... 2
Objectives ... 3
Thesis contributions ... 3
Thesis outline ... 4
Literature review ... 6
Grassland desertification and farmland conservation ... 6
Stand-alone water pumping systems ... 6
PV water pumping systems for grassland rehabilitation and farmland conservation ... 8
Methodology and models description ... 10
System design and simulation ... 11
Assessment of solar energy and wind energy potential ... 12
Assessment of the crop water requirements ... 12
Designing of the system ... 13
Performance evaluation of PVWP system ... 14
Modelling of the aquifer response to pumping ... 15
Modelling of crop growth ... 17
Experiment and field study... 17
Economic assessment of PVWP system ... 19
Assessment of CO2 emissions reductions... 20
Results and discussions ... 22
Designing and modelling of PVWP system ... 22
Performance comparison with WWP systems ... 24
Field experiments and experience ... 26
PVWP models validation ... 26
Optimization of the installed PVWP system ... 26
Economic evaluation of PVWP systems ... 29
PV pumping technologies ... 29
PV, diesel and wind pumping system ... 30
Future works ... 36
Conclusions ... 37
References ... 38
List of Figures
Figure 1. Methodological approach ... 10
Figure 2. Models involved in the design and operation of PV water pumping system for irrigation. ... 11
Figure 3. Modelling approach for PVWP system ... 15
Figure 4. Parameters involved in the groundwater modelling ... 16
Figure 5. Schematic diagram of the system configurations used during the tests. ... 18
Figure 6. Monthly distribution of solar irradiation on a surface tilted 10° towards south and on a 2-axis solar tracking surface in Xining .. 22
Figure 7. Alfalfa water requirements for Xining, Dulan and Hohhot ... 23
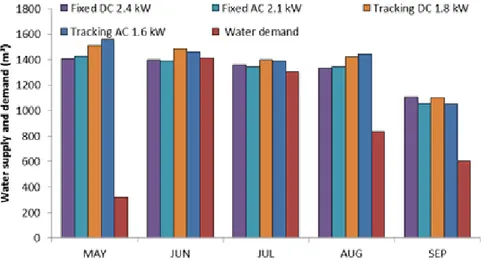
Figure 8. Water supply and demand from PVWP systems for Xining ... 24
Figure 9. Average monthly wind speed at 18 m hub height in Dege, Hails and Ordos ... 25
Figure 10. Water supply and demand from 3 kW capacity PVWP and WWP systems for Hails ... 25
Figure 11. Pumping tests in irrigation mode as function of the solar radiation and water level in the well ... 27
Figure 12. ICCs and breakdown costs for installed and optimal system ... 28
Figure 13. Modelling of current and optimal integrated PVWP system ... 28
Figure 14. ICCs of the studied PVWP systems ... 29
Figure 15. Variation of ICCs and LCCs of PVWP and DWP system between 1998 and 2013 ... 31
Figure 16. Net present value and payback period analysis for the worst scenario investigated (W stands for well and I for irrigation system)... 31
Figure 17. Net present value and payback period analysis for the best scenario investigated (W stands for well and I for irrigation system)... 32
Figure 18. Effects of surplus electricity sale and incentives on the net present value and payback period (GS stands for grass sale, E for surplus of electricity production, F for available incentives for renewable energy production and C for carbon credits) ... 33 Figure 19. ICCs and LCCs of 1 kW PVWP and WWP system ... 34 Figure 20. Crop yield response to different irrigation conditions simulated
with AquaCrop ... 35 Figure 21. Net present value and pay-back period analysis for PVWP and
List of Tables
Table 1. Characteristics of main components, tilt and azimuth angles of the PVWP system ... 17 Table 2. Measurement carried out during the tests and the corresponding
instruments ... 19 Table 3. Designed PVWP systems ... 23 Table 4. Validation of integrated PVWP system simulations ... 26
Nomenclature
Abbreviations
AC Alternate current
ADB Asian Development Bank
CF Cash flow
DC Direct current
DM Dry matter
DWP Diesel water pumping
EC Energy content factor
EF Emission factor
FAO Food and Agriculture Organization
ICC Initial capital cost
IWR Irrigation water requirements
IWRHR Institute of Water Resources and Hydropower
Research
IWRPA Institute of Water Resources for Pastoral Areas
KTH Kungliga Tekniska Högskolan
LCC Life cycle cost
LR Leaching requirements
MPPT Maximum power point tracking
NOCT Nominal operating cell temperature
NPV Net present value
PBP Payback period
PRMSE Percentage root mean square error
PV Photovoltaic
PVWP Photovoltaic water pumping
PW Present worth
SOC Soil organic carbon
TDH Total dynamic head
WWP Wind water pumping
Symbols
Ba Annual incomes ($)
CF Annual fuel costs ($)
Ci Calculated values
CR Replacement costs ($)
e°(T) Saturation vapour pressure at air temperature T
(kPa)
ea Average hourly actual vapour pressure (kPa)
Eel Electricity production (kWh)
ES Daily solar irradiation hitting on the
photovol-taic array (kWh/m2 day)
ET0 Reference evapotranspiration (mm/day)
ETC Evapotranspiration in cultural conditions
(mm/day)
fm Matching factor
G Soil heat flux density (MJ/m2 day)
GS Global solar radiation (W/m2)
H Depth of aquifer after pumping (m)
H0 Initial depth of aquifer (m)
i Discount rate (%)
K Average permeability coefficient of aquifer
(m/day)
KC Cultural coefficient
m Percentage of annual operation and
mainte-nance costs on the initial capital costs (%)
mCO₂ CO2 emissions reductions (tonnes)
Mi Measured values
N Years of the investment (year)
Peff Effective precipitation (mm)
Pp Photovoltaic array power peak (kWp)
Q Pumping rate (m3/h)
Rn Net radiation at the grass surface (MJ/m2 day)
s Drawdown (m)
t Time (hour)
T Transmissivity (m2/day)
T0 Reference temperature (25°C)
Ta Ambient temperature (°C)
Tcell Cell temperature (°C)
u2 Average wind speed (m/s)
W(u) Theis well function
V Volume (m3)
αC Photovoltaic modules temperature coefficient
(%/°C)
γ Psychrometric constant (kPa/°C)
Δ Slope of saturation vapour pressure curve T
(kPa/ °C)
ηMP Efficiency of the motor-pump system (%)
Acknowledgments
This licentiate thesis was conducted at the School of Business, Society and Engineering, Mälardalen University, Västerås, Sweden. Many people de-serve my thanks for their importance during my studies in Sweden.
First and foremost, I would like to express my deep and sincere gratitude to my supervisor Prof. Jinyue Yan for his continuous and invaluable guid-ance, support, motivations, suggestions, inspirations and all the great and challenging experiences.
My deep and sincere gratitude is also for my co-supervisor Dr. Hailong Li for his continuous suggestions, guidance and patience in reviewing my works. Thanks also for teaching that we should never give up!
I would also like to thank Prof. Björn Karlsson for reviewing my licenti-ate and for the help in solving my solar problems.
Many thanks to Prof. Ruiqiang Zhang, Prof. Hong-xing Yang, Prof. Jiahong Liu, Assoc. Prof. Gang Xiao and Assistant Prof. Mi Yan for their invaluable hospitality, guidance, ideas, knowledge and support during my trips and studies in China.
I wish to thank my colleagues at Royal Institute of Technology, Alexan-der Olsson and Chi Zhang, and at Institute of Water Resources and Hydro-power Research, Jun Zhang, for the fruitful meetings and discussions and for the pleasant moments spent together in Inner Mongolia.
My gratitude also goes to all my colleagues´ department for their help, support and interesting discussions. A special thank goes to all of you who helped me during the last month!!!
I gratefully acknowledge the Swedish International Development Cooper-ation Agency (SIDA) and Swedish Agency for Economic and Regional Growth (Tillväxtverket) for the financial support.
I am also grateful for the support received by Solibro AB and for the close collaboration with TEROC AB, especially for the hard work and en-lightening discussions with Sven Ruin.
Special thanks to Lundh family for the nice moments spent together and to have been my family in Sweden. Thanks a lot Janne!
Thanks a lot also to my friends Daniel, Federico, Peter and Shaopeng. Finally, I feel very much indebted with my family, especially with my fa-ther and my brofa-ther, and with someone who is watching over me from up there.
1
Introduction
Background
Grassland represents the largest ecosystem, covering 40.5% of the surface area of the earth and accounting for 52.5 million km2 [1]. In China, grassland covers an area of nearly 4 million km2 representing more than 40% of the national land. It plays a key and strategic role in the sustainable development and food security of the country since more than 100 million livestock are grown up in those areas. Therefore, Chinese grassland desertification is re-garded as one of the most crucial socioeconomic and environmental threats for China affecting the life of 400 million people and producing an economic loss estimated as 8 billion US dollars per year [2]. Grassland also plays a significant role in the preservation of the water resources and control of the water cycle as well as carbon sink [3, 4]. Chinese grassland accounts for 9-16% of world’s grassland carbon stocks [5].
Irrigating the grassland is considered a feasible approach to halt the pro-gress of desertification, which can further result in the dual purposes of grassland ecological rehabilitation and increase of grass productivity and, thus, farmers´ incomes. Grassland watering has been a common practice in United States, New Zealand, Australia and North and East African countries in order to improve the grass production rate [1, 6-8]. Nevertheless, the ma-jor technical obstacle for irrigation in remote pastoral areas is the lack of access to the electricity grid. Solar photovoltaic (PV) technology, thus, rep-resents a technically reliable and sustainable solution to provide electricity in off-grid areas for water pumping. Therefore, PV water pumping (PVWP) has become one of the most important applications among standalone PV sys-tems with thousands of units in operation worldwide [9]. The economic via-bility of standalone PVWP systems assessed in several studies [10, 11] has proved its competence compared to grid extension or other standalone power generation units.
The direct and indirect benefits of PVWP system for irrigation are nu-merous. Grassland watering improves the grass coverage. The improved coverage decreases the erosion rate caused by rainfall and wind. It also en-hances the soil water holding capacity increasing the rate of rainfall that percolate deeply down to the groundwater. The increased grass productivity can improve the people´s living conditions in the rural and remote pasture areas by increasing the incomes. In addition, the improved pasture land has
2
the indirect benefit of increasing the carbon sequestration for the mitigation of climate change [4]. Therefore, the application of PVWP represents an important step towards the sustainable development of the pastoral and agri-cultural sector and food security issues [12, 13].
Knowledge gaps and challenges
Off-grid PVWP systems have been studied and used for more than 40 years [14]. The drastic drop of PV modules price has boosted the research, the technology development and the market of PVWP, especially towards higher system flexibility, larger installations and new applications [15]. Most of the scientific research carried out in the field of PVWP systems is focused on the system design and on the technical and economic comparison between PV and other standalone power sources. However, there is a knowledge gap in the systematic optimization of the energy system with the consideration of crop water requirements and water resources. System failures and the corre-sponding economic losses still occur due to the inadequacy of considering the system integration with the environment.
In most of the works done so far, PVWP systems have been considered as independent device without taking into consideration how the system is af-fected by the environment (crop water requirements) and how the system affects the environment (response of groundwater resources to pumping). There is also a lack in a systematic analysis on the technical, environmental and economic feasibility of PVWP systems for the specific purpose of halt-ing the degradation of grassland and promothalt-ing sustainable development of the pastoral areas. It is also essential to identify technical and environmental constraints that can negatively affect the operation of such standalone sys-tems. In addition in most of the studies conducted, net present value and pay-back period analyses are ignored in favour of only capital and life cycle costs analyses.
Thus, the main research questions addressed in this licentiate thesis in-clude:
How does the crop water requirements variation during the irrigation season affect the system design and effectiveness?
How can the dynamic simulations help the system design and optimiza-tion?
What are the main system constraints?
How should the PV water pumping system be integrated with irrigation technologies and water resources?
Are PV water pumping systems economically and environmentally fea-sible for grassland restoration?
3
Objectives
The overall objective of this thesis is to assess the technical, economic and environmental feasibility of PV water pumping technology for the conserva-tion of degraded grassland and farmland in remote areas of China for future commercialization. Corresponding to the raised research questions, the spe-cific goals include:
providing suggestions for system design, modelling and optimization in order to improve the system reliability and avoid economic losses through a better understanding of the match between water supply, water demand and water resources;
investigating the most cost effective solutions to pump water for irriga-tion in remote areas, particularly among PV, diesel and wind power; analysing the negative environmental effects and the direct and indirect
benefits of implementing PV water pumping system in desertified re-mote areas;
evaluating the possible revenues generated by the system to discuss its economic feasibility.
Thesis contributions
Corresponding to the appended papers, the main contributions of this licenti-ate thesis consist of:
Paper I develops a tool for quick design and validation by combining the solar radiation model, PV model, water pumping model and the water demand model. The matching between crop water demand and water supply validates the tool. Designing the PVWP system for the worst month in terms of water demand and available solar energy results in a surplus of the water supply during the rest of the irrigation season and non-irrigation season. The surplus of water pumped analysis represents thus a starting point for a further optimization and utilization of the sys-tem. The economic analysis based on the comparison between fixed and two axis tracking solar array and alternate current (AC) and direct cur-rent (DC) pump shows the most economical solution.
Paper II provides an overview of the investment cost, life cycle cost and profitability of PVWP systems for irrigation compared to diesel water pumping (DWP) systems. The benefits are investigated using indicators of the net present value (NPV) and the payback period (PBP). The eco-nomic analysis is conducted taking into consideration of all the possible revenues by utilizing PVWP systems for grassland irrigation.
4
Paper III investigates the environmental constraints, especially the availability of water resources, which can affect the operation of the PVWP system. Tests were carried out during the field trip in Inner Mon-golia and the results achieved show how the lack of a systematic optimi-zation of the system results in economic losses.
Paper IV compares the technical effectiveness and economic feasibility for irrigation of the degraded grassland in China between PVWP and wind water pumping (WWP) systems. The possible revenues generated from the rise of grass productivity and electricity sale are estimated by performing simulations of the crop growth under different irrigation conditions.
I served as the first author of the appended papers with the supervision from my principle supervisor and co-supervisor. In Paper III, PhD student Jun Zhang from the Chinese Institute of Water Resources and Hydropower Re-search (IWRHR) contributed in providing the modelling of the groundwater level. In Paper II, PhD student Alexander Olsson from the Royal Institute of Technology (KTH) contributed in estimating the amount of CO2 sequestered by improved grassland production.
Thesis outline
This licentiate thesis provides background information about grassland des-ertification experienced in China and PVWP system. This thesis consists of the following chapters:
Chapter 1 Introduction
Introduce the thesis background, knowledge gaps and chal-lenges, objectives, applied methodologies, contributions and thesis outline.
Chapter 2 Literature review
Review the problem of grassland desertification in China and presents the results achieved from related research in the field of photovoltaic irrigation as method to combat degraded grassland together with research gaps. Description of the most common used standalone irrigation systems is also presented.
Chapter 3 Methodology and models description
Describe the methodology and models adopted for the dynam-ic simulations, the experiments carried out at the pilot site and the economic evaluation approaches.
5
Chapter 4 Results and discussions
Summarize the main results achieved in the papers appended to this thesis and highlight the main discussions points.
Chapter 5 Future works
Present the discussions arisen from the studies conducted and future directions of this research.
Chapter 6 Conclusions
6
Literature review
Grassland desertification and farmland conservation
Grassland degradation is regarded as one of the most crucial economic and environmental crisis of China.
There has been a heated debate during the last 20 years on the main caus-es of grassland dcaus-esertification. Some authors claim that the main causcaus-es of desertification of grassland are bounded to human activities such as over-grazing and overexploitation of the water resources due to the population growth and thus pressure on food [16]; other authors defend the hypothesis that the primary cause of grassland degradation is due to the climate changes especially rainfall reduction, temperature variation and sand-driving winds [17]. Both causes produce a lack of vegetation coverage that deteriorates the already fragile environmental and ecological situation favouring wind and rainfall erosion.
Combating desertification involves a series of complex actions ranging from policy and society decisions to agricultural and engineering activities. Typical measures to halt the grassland degradation are the afforestation and reforestation projects with the scope of creating barriers to halt the progress of desertified areas [18]. Nevertheless, the high water requirement of trees and the related water resources exploitation make this solution controversial in some cases [19]. Other typical solutions to prevent grassland degradation caused by overgrazing are fencing some area and reducing the number of livestock per unit of grassland [1]. However this approach further reduces farmers´ incomes, which are already low.
Stand-alone water pumping systems
PV, diesel and wind pumping systems have been used extensively to supply water for drinking, livestock and irrigation purposes in remote off-grid areas. Typically a PVWP system consists of four main components: the PV ar-ray, a power conditioning system, the pump and the storage module [20]. Since the system layout is simple, multiple configurations and technical choices are available depending on reliability, performances and economic aspects [21].
7 The PV modules can be mounted on fixed array or on sun tracking system to harvest more solar energy. The type of pump depends on the water re-quirements, pumping head and system configuration. Generally, centrifugal volumetric pumps are the most widely used.
The power control unit is determined by the type of motor: direct current (DC) or alternate current (AC). In the first case, the DC motor-pump is con-nected to the PV array through a DC/DC converter while in the second case with a DC/AC inverter. In the simplest and smallest applications, it is also possible to connect the DC pumping unit directly to the PV modules. In the case the storage system is a battery bank a charge controller behaves as inter-face between the PV modules and battery and between the battery and the power conditioning unit and load [22]. Alternatively, a water storage tank can replace the batteries depending on the requirement of the system, relia-bility and investment costs [23].
If the PVWP system is specifically used for irrigation, the watering can be performed in two different configurations: irrigation system directly con-nected to the PVWP system or through a water storage tank [24, 25]. The direct connection of the PVWP to the irrigation system through a filtering unit is the simplest layout. Various irrigation technologies can be used such as, furrow, sprinkler and micro irrigation. Micro irrigation is preferred as water saving technique, especially in those areas where water resources are limited.
PVWP operation does not need fossil fuels, and consequently is inde-pendent of the fuel availability and fuel prices fluctuation. Another major advantage of PVWP system is its high reliability, which needs low mainte-nance and replacement. In addition, PVWP has low level of noise and does not emit exhaust flue gases and greenhouse gases.
More than 20,000 PV pumping system were installed at the beginning of 2000 around the world [9]. The previous statistic is likely to increase due to the effort of reaching the United Nations 2010 Millennium Development Goals for the drinking water access in developing countries and for the in-crease of solar energy applications in the agricultural sector [26]. For exam-ple the Bangladesh government has set the goal to install 10,000 PVWP systems by 2014. In 2010 India has installed more than 50 MWp of standalone PV systems, of which PVWP systems represent a notable fraction [27].
Diesel water pumping (DWP) systems can be configured either with me-chanical transmission or with electrical power transmission. The main ad-vantage of DWP systems is the lower initial capital cost compared to PVWP. Nevertheless, several studies showed that under a life cycle cost perspective PVWP systems are more feasible than DWP systems, due to the high opera-tion and maintenance cost of diesel engine [28].
Water pumping is also one of the typical applications of wind energy. Wind water pumping (WWP) systems can be coupled with the pump through
8
mechanical or electrical transmission. Similar to the PVWP, the WWP sys-tems can be both directly connected to the wind generator or through a pow-er conditioning unit [29]. In genpow-eral, PVWP systems offpow-ers bettpow-er ppow-erfor- perfor-mances in terms of matching between water demand and water supply than WWP systems, especially for livestock watering and crops irrigation [30]. From an economics point of view, B. Bouzidi [31] showed that WWP sys-tems have lower unit water costs than PVWP syssys-tems. Nevertheless, the previous study considered the 2011 PV modules prices that were considera-bly higher than the current unit price in China.
Research on PVWP systems has mainly focused on the optimal design based on the application [32, 33], comparison with different power sources [31, 34] and environmental benefits [35]. However, using PVWP systems for preventing grassland desertification and for sustainable development of farmland in China represents a promising application since no projects have been conducted before. Moreover, the PV modules price reduction contrib-uted by the Chinese market in the last five years has stimulated the market and development of PVWP systems especially for larger installation capaci-ties and new applications.
PV water pumping systems for grassland rehabilitation
and farmland conservation
Recently the application of PVWP for the grassland irrigation in China has attracted more and more attentions for the dual scope of preventing desertifi-cation and supporting the sustainable development of farmland in China.
In 2011 Asian Development Bank (ADB) studied the implementation of PVWP systems for pasture land protection with installation of a 2 kWp pilot system in Qinghai province [36]. The project demonstrated the technical and economic feasibility of PVWP systems for preventing pasture land degrada-tion and poverty alleviadegrada-tion. The aspects related to the overexploitadegrada-tion of water resources were also investigated in order to individuate the feasible area for the PVWP systems operation. The institutional and financial barriers for the project spread were also addressed. The study compared PVWP sys-tems with the conventional DWP syssys-tems but wind water pumping (WWP) systems were not considered as an alternative solution.
The feasible grassland area to apply PVWP systems for irrigation in Chi-na has been assessed by taking into consideration the solar energy resources, precipitation and terrain slope [37]. It resulted in 0.42 million km2, around 10.5% of the total grassland area in China. The feasibility of pasture grass irrigation in Inner Mongolia has been studied in [38] mainly focusing on the evaluation of water demand for irrigation during different hydrologic years and the effect on groundwater resources. The positive balance between water
9 demand and water resources highlighted how the water resources were not affected by the pumping. However, the dynamic simulation about the system operation and dynamic groundwater response relative to PV pumping was not taken into account. Moreover, the systematic system design and optimi-zation based on the crop water requirements and water resources were miss-ing.
The effects of PVWP systems on groundwater table variation in Qinghai and the economic profitability of the system have been analysed in [39] tak-ing into consideration the grass sale as revenue. The irrigated pasture land showed an increase of 200% in productivity compared to the non-watered. Moreover, taking into account the overall investment costs and the local grass market price, the PVWP system was marked out by a payback period of 8 years, showing a high economic return. Although the PVWP systems profitability was addressed in the studies carried out by ADB and X. Gao et al. [36, 39], the economic suitability referred to the grass sale of a specific location with a specific grass productivity. Simulations on the grass produc-tivity based on the water provided through irrigation were also missing. Moreover, an extensive life cycle cost analysis was omitted making the re-sults of the payback time analysis inaccurate.
The study conducted in [40] showed the effects of irrigation on the grass-land productivity and biodiversity in Xilamuren grassgrass-land, Inner Mongolia. The results showed that even though irrigation can positively affect both grass production and biodiversity compared to the case where watering is not applied. Nevertheless, when irrigation was stopped, irrigated areas degraded more and faster than the non-irrigated area. Therefore, a further and system-atic monitoring research was mandatory.
10
Methodology and models description
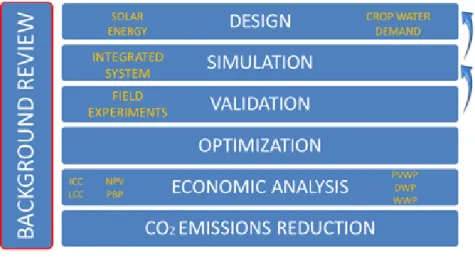
This thesis analyses the technical, economic and environmental feasibility of PVWP systems for grassland and farmland conservation in China. The methodology adopted in this thesis is schematized in Figure 1.
Figure 1. Methodological approach
An extensive background review of grassland desertification in China and PVWP systems, especially for agricultural purposes, is the basis of the entire work. The system design is based on a thorough analysis of the available solar energy resources and crop water demand. Meteonorm [41] is used as statistical database for the acquisition of climatic data needed for the assess-ment of solar and wind potential and water requireassess-ments for irrigation.
The overall system is decomposed into several sub-models: solar energy, PV array, motor-pump unit, hydraulics, crop water demand and growth, and groundwater. Winsun [42], PVsyst [43], Matlab [44] and Trnsys [45] are used as software programs for simulations of PVWP system. Cropwat [46] and AquaCrop [47] distributed by FAO are used for assessing the crop wa-ter requirements and for simulating the crop yield.
Dynamic modelling is used to validate the design process through the matching between water demand and water supply. Whilst, the simulation results are validated by comparing with the experiments carried out during the field experience at a pilot PVWP installed in Inner Mongolia. The results
11 achieved during the field trip were used for further optimization of the in-stalled PVWP system to show how system failures and related economic losses are avoidable.
The economic aspects of the PVWP systems have been investigated. Indi-cators of the investment capital cost (ICC) and life cycle cost (LCC) were used to compare different power solutions, and net present value (NPV) and payback period (PBP) were used to evaluate the capacity of producing bene-fits.
The environmental advantages of using PVWP systems are analysed in terms of CO2 emissions reduction.
System design and simulation
Proper design of PVWP system for irrigation centres on the sizing and se-lecting the right components to meet the water requirements and avoid over-sizing, failures and economic waste [26]. The design procedure for PVWP systems principally consists of the assessment of solar radiation, water de-mand, water resources, which represent one of the main constraints in arid areas, and hydraulic system. Figure 2 presents an overview of the models related to the functioning of an integrated PVWP system.
SOLAR RADIATION
HYDRAULIC
HEAD DEMANDWATER
IRRIGATION SYSTEM PV MODULES INVERTER PUMP INVERTER-PUMP MODEL HYDRAULIC HEAD MODEL PV ARRAY MODEL
GROUND WATER SUPPLY GROUND WATER SUPPLY MODEL WATER DEMAND MODEL SOLAR RADIATION MODEL WATER SUPPLY > WATER DEMAND CROP GROWTH MODEL CROP GROWTH
Figure 2. Models involved in the design and operation of PV water pumping system for irrigation.
12
The integrated PVWP model is decomposed in 7 sub-models that represent the main units affecting the operation. The solar radiation model and PV array model give the power output from the PV array depending on loca-tions, tilt and azimuth angle, array type and PV modules. The inverter-pump model describes the variation of instantaneous water flow of the pump de-pending on the input power from the PV modules and working efficiency of the inverter and pump. The water demand model estimates the peak of crop water requirements and the hydraulic head model is crucial to design the pumping system and evaluate the daily hydraulic energy. The hydraulic en-ergy together with the solar radiation model allows designing the PV array. The groundwater model gives the response of groundwater resources to pumping in terms of variation of the water level. The crop growth model describes the crop yield on the basis of the water supplied by the PVWP and irrigation system. Dynamic simulations were conducted to quantify the match between water demand and water supply, identify the effects of pumped water on the groundwater resources, prove and optimize the design-ing. In order to validate the theoretical models, experiments have also been conducted during the field study in Inner Mongolia.
Assessment of solar energy and wind energy potential
China has relatively high solar energy resources with an annual average irra-diation of 4 kWh/m2 per day. The solar irradiation varies greatly from 2 kWh/m2 per day up to 9 kWh/m2 per day depending on the location [48].
In order to assess the available solar irradiation Meteonorm [41] is used as statistical climatic database and Winsun [42] and PVsyst [43] are used to estimate the available solar energy hitting on the PV array. The optimization of the orientation angles, especially of the tilt angle, has been carried out to optimize the solar energy gathered during the irrigation season, usually from May to September. The assessment of wind energy for two locations in Chi-na has been carried out through the statistical data about wind speed availa-ble in Meteonorm [41]. The analysis of the wind energy potential has been instead conducted applying the well-known Weibull approach [49].
Assessment of the crop water requirements
The assessment of crop water requirements relies on several factors, princi-pally climatic factors such as solar radiation, wind speed, temperature, and humidity and agricultural factors such as the type of crop, development phase and soil. The first step to evaluate the irrigation water requirements is to calculate the reference evapotranspiration ET0 that represents the water
losses due to the evaporation and plant transpiration from a reference surface [50]. ET0 (mm/day) has been calculated through the Penman-Monteith
13 ( ( ) ) ( ) ( ) Where, Rn is the net radiation at the grass surface (MJ/m2 day), G is the soil
heat flux density (MJ/m2 day), T
a is the mean hourly air temperature (°C), Δ
is the slope of saturation vapour pressure curve at Ta (kPa/ °C), γ is the
psy-chrometric constant (kPa/°C), e°(T) is the saturation vapour pressure at air temperature Ta (kPa), ea is the average hourly actual vapour pressure (kPa)
and u2 is the average wind speed (m/s).
Hourly dynamic simulations of ET0 can be performed by adjusting
Equa-tion 1 on hourly basis according to the procedure described in [50]. The evapotranspiration in cultural conditions ETC, is calculated from ET0 taking
into consideration a specific cultural coefficient KC dependent on the type of
crop and growing phase according to the following equation [50]:
( ) In the specific case of Alfalfa, KC varies from 0.4 to 0.95 depending on the
growing phase of the crop: Kc equal to 0.4 in development phase, 0.95 dur-ing the intermediate phase and 0.9 in the final phase. The development phase runs from the sowing to the effective full ground cover, the intermediate stage from the effective full cover up to the crop ageing and the final stage from the ageing up to the harvesting [50].
To calculate the effective water needs, the effective rainfall Peff in mm,
the leaching requirements LR defined as the amount of water needed in order to remove residual salts from the root zone and efficiency of the irrigation system ηirr needs to be also considered. The resulting irrigation water
re-quirements IWR (m3/ha day) are given by: ( ( ) )
( )
LR and ηirr were set equal to 0.18 and 0.80 respectively, when assuming to
use a micro irrigation system [51]. In all the appended papers we assumed that the irrigation season lasts from May to September. The monthly assess-ment of IWR can be alternatively performed with the software Cropwat [46], however, the software is unable to execute hourly simulations.
Designing of the system
The design of a PVWP system, as well as off-grid PV systems, is conducted under the worst operation condition. Typically, for standalone PV irrigation
14
systems the worst condition is represented by the month marked out by the lowest ratio between crop water demand and available solar irradiation [34]. Evaluated the design month, available solar irradiation and the crop water requirements, the required PV peak power Pp (kWp) is given by the follow-ing relationship [52]:
[ ( )]
( ) Where, 0.0027 is a conversion factor, IWRp represent the peak of the daily
irrigation requirements during the irrigation season (m3/ha day), TDH is the total dynamic head estimated with the classical equations of hydraulics (m),
fm is the matching factor equal to 0.9, αC is the PV modules temperature
co-efficient (%/°C), Tcell is the cell temperature (°C), T0 is the reference
temper-ature (25°C) and ES is the daily solar irradiation hitting the array (kWh/m2
day).
Equation 4 provides the PVWP system peak power able to fulfil the crop water requirements for the designing month. The cell temperature can be estimated with the following relationship [53]:
( )
Where, Ta is the ambient temperature (°C), NOCT is the nominal operating
cell temperature (°C) and GS is the global solar irradiance (W/m2).
Performance evaluation of PVWP system
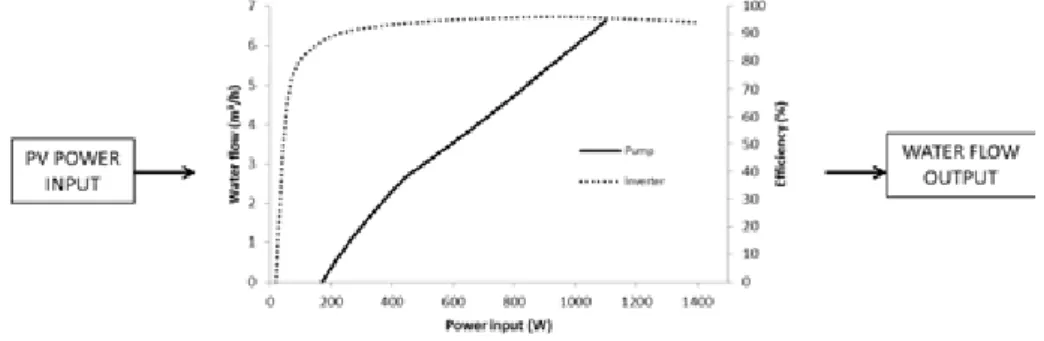
Evaluating the performance of the PVWP system includes the calculations of the power output from the PV array and the dynamic efficiencies of power conditioning system and pumping unit as a function of the power input. In particular, the dynamic modelling of the pump was carried out considering the pump characteristic curve that expresses the instantaneous water flow (m3/h) versus the instantaneous feeding power to the motor-pump system.
Typically, the flow rate curve as function of the power input is derived from the affinity laws taking into consideration the efficiency of the pump. Figure 3 schematically shows the procedure adopted to calculate the hourly water output volume from the PV pumping system. Winsun [42] and PVsyst [43] are utilized to calculate the PV power output. The dynamic efficiency of the power conditioning system and pump as a function of the power input are extracted from PVsyst [43] through the specific tools for inverters and pumps. The power feed in the motor-pump depends on the dynamic efficien-cy of the power conditioning system that is mainly affected by the power output extracted from the solar array. All the simulations carried out are
15 based on system equipped with maximum power point tracker (MPPT) and without storage systems. PVsyst [43], Matlab [44] and Trnsys [45] are used as software tools to model the water volumes pumped by the PVWP system.
Figure 3. Modelling approach for PVWP system
Modelling of the aquifer response to pumping
Modelling the aquifer response to the PV pumping is of importance for pre-dicting the drawdown and then the hydraulic head of the pumping system. In addition, modelling drawdown is essential to study the aquifer response to the pumping in order to prevent groundwater overexploitation and operation interruptions. Different from the traditional grid-connected pumping system that the rated water flow is reached immediately after the system starts, for the PVWP system the rated flow rate can only be achieved after the solar radiation reaches the design level. It results that during most of the time the PVWP system runs at partial capacity. Accordingly, for traditional pumping system the drawdown stabilizes after a transient which is a function of aqui-fer parameters, whereas, for PVWP systems the drawdown hardly reaches the steady state due to the continuous variation of the solar radiation and pumped water volume.
Typically, groundwater transient modelling relies on Theis equation [46], which provides the unsteady distribution of the drawdown s at a radial dis-tance r and at the time t. The application of Theis Equation is based on the following assumptions: (I) homogeneous and isotropic confined aquifer, (II) no source recharging the aquifer, (III) infinite aquifer in radial extent, (VI) water released instantaneously as the head is lowered and (V) constant pumping flow [46, 47]. The drawdown s (m) as a function of the time t and distance r from the well is given by the following equation [54, 55]: ( ) ( )
16
Where, Q is the pumping rate (m3/h), T is the transmissivity (m2/h), W(u) is the Theis well function and u is a dimensionless time parameter given by the following equation [54, 55]:
( ) Where, S is the storativity. The transmissivity T is a measure on how much groundwater flows towards the well per unit surface area during pumping whereas the storativity S is a measure of the volume of water released per unit surface area and decline of hydraulic head [54]. Theis equation is typi-cally used for the estimation of the parameters S and T through pumping tests. The modelling of the ground water level response has been then per-formed trough the following relationship [54, 55]:
( ) ( ) In which, H0 is the initial thickness of aquifer (m), H is the thickness of
aqui-fer after pumping (m), Q is the sustainable and steady pumping flow (m3/h) and K is the average hydraulic conductivity of the aquifer in (m/h). Although the flow rate of PVWP system varies dynamically, the variation of water level in the well has been modelled on hourly basis. Figure 4 describes the effects of pumping on the groundwater level and the corresponding meas-urements involved.
17
Modelling of crop growth
AquaCrop [47] is a validated model used as tool to simulate the grass yield
in different sites and under different irrigation amounts. The model allows running daily dynamic simulations of the crop growth defining the input parameters of four sub-models: crop (type, canopy cover, plantation density, root depth, biomass production and harvestable yield), climate (tempera-tures, rainfall, evapotranspiration and CO2 concentration), soil (texture and water balance) and management practices (field and water management) [56, 57].
Although the current program version does not include forage crops like Alfalfa in its database, it is possible to define and model it using the option ―leafy vegetable producing crops‖ but excluding multiple harvesting. In the simulations conducted in this work, Alfalfa is defined according to the same input values adopted in a previous report about crop production assessment in Uzbekistan: plant density equals to 75,000 plant per ha, canopy cover is set at 90%, fertility stress level is 50% and reference harvest index is fixed at 40% [58].
The irrigation schedule is defined on the basis of the water supplied by the PVWP and WWP systems investigated resulting from the dynamic simu-lations.
Experiment and field study
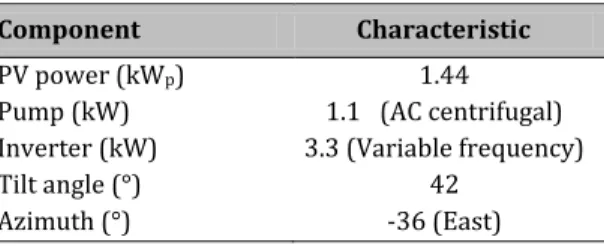
The field experiments were conducted at one pilot PVWP system, which belongs to the Institute of Water Resources for Pastoral Areas (IWRPA) in Inner Mongolia. The main purposes of the field measurements were to col-lect data that can be used to validate the models adopted for simulations and investigate the effects of the pumping on the groundwater. The characteris-tics of main components together with the PV array tilt angle and orientation are given in Table 1.
Table 1. Characteristics of main components, tilt and azimuth angles of the PVWP system
Component Characteristic
PV power (kWp) 1.44
Pump (kW) 1.1 (AC centrifugal) Inverter (kW) 3.3 (Variable frequency)
Tilt angle (°) 42
18
The PVWP system is located in the nearby of the borehole, in which the static water level is 5 m below the ground surface. The pump is installed at the bottom of the well at around 8.5 m depth from the ground surface. In order to avoid dry running conditions that could damage the pump, the pump is equipped with a safety probe installed at 1 m by the bottom. The tested PV water pumping system is used to provide water for an area of 1 ha, which is cultivated with Alfalfa (Medicago Sativa) and irrigated with a micro drip-ping irrigation system. Figure 5 shows a schematic diagram of the system, measuring instruments and measurements carried out during the field experi-ence.
Figure 5. Schematic diagram of the system configurations used dur-ing the tests.
The PVWP system was tested in two different scenarios: recirculation sce-nario and micro irrigation scesce-nario. In the former scesce-nario the water lifted up from the well was recirculated back to the well to perform test for the valida-tion of the PVWP system models. In the latter scenario the water pumped from the PVWP system was fed directly into a micro dripping irrigation system. The main purpose was to investigate the effects of pumping on the local available water resources and validates the groundwater response mod-elling. All the measurements performed and the corresponding instruments used are listed in Table 2.
19 Table 2. Measurement carried out during the tests and the
corre-sponding instruments
Measurements Instrument Logging time Resolution
Solar radiation Pyranometer 10 min ±1 W/m2
Power DC power meter 1 hour ±1W
Pressure Pressure sensor 1 hour ±0.01 bar
Water flow Flowmeter 1 hour ±0.001 m3
Well water table Pressure sensor 15 min ± 0.02 mwc Evapotranspiration Weighing lysimeter 1hour ± 0.02 mm
The comparison between modelled and measured values is conducted using the percentage root mean square error (PRMSE) as indicator:
√∑ ( ∑ )
( )
Where, Ci are the calculated values and Mi are the measured values.
Optimi-zation of the system based on the assessment of solar energy resources and water availability is also shown to underline how a systematic optimization can increase the economic feasibility of the single project.
Economic assessment of PVWP system
The economic evaluation conducted in this licentiate thesis mainly includes the comparison between different alternatives water pumping technologies and the assessment of the potential profitability of the system. Initial capital costs (ICCs) are estimated on the basis of components prices, structure costs, and engineering and installation costs. All the components prices refer to the Chinese market [59].
The approach used to estimate the life cycle costs (LCCs) is expressed by the following equation:
( ) ( ) ( ) ( )
Where, PW(CR), PW(CO&M) and PW(CF) are the present worth of the
re-placement costs, annual operation and maintenance costs and annual fuel costs, respectively. The profitability of PV water pumping system has been studied using the indicators such as the net present value (NPV) and the pay-back period (PBP). The potential revenues of the system include the benefits from the improved grass production, sale of the surplus electricity generated during the non-irrigation season and the available incentives for renewable energy production in China. It was assumed that the electricity price is equal
20
to 0.05$/kWh, which is the benchmark tariff for coal fired power plants in 2009 [60]. The incentives for renewable electricity production are set at 0.18 $/kWh, which is the value set by the Chinese government in 2010 for PV power projects [60]. Moreover, the environmental benefits generated by the reduction and sequestration of CO2 emissions by using PVWP systems are monetized assuming an offset of 20$/tonne CO2 avoided.
NPV and PBP methods are calculated with the following equations: ( ) ∑( ) ( ) ( ) ( ) ( ) Where, CF is the cash flow registered from year 1 to year N given by the annual difference between incomes and expenses, i is the discount rate, Ba is
the annual incomes and m is the percentage of annual operation and mainte-nance costs on the ICC [49].
Assessment of CO
2emissions reductions
Compared to standalone fossil fuels powered systems, the operation of PV technology is CO2 emissions free. Moreover, increasing the grass coverage allows sequestering CO2 in the form of soil organic carbon (SOC) due to the ecologic restoration.
The annual CO2 emissions avoided in tonnes using PV modules as power source instead of the traditional diesel powered pumps are estimated with the following formula [61]:
( )
Where, Vdiesel,a is the annual volume of diesel saved using PV technology for
water pumping (m3), EC is the energy content factor of diesel equal to 38.6 GJ/m3 and EF is the emission factor equal to 69.2 kg CO
2-e/GJ [61].
The CO2 emissions savings due to the electricity production from PV technology compared to grid-connected system were estimated with the fol-lowing formula:
21 Where, Eel is the electricity production and is the CO2 emissions from the electricity production in China, equals to 931 g CO2/kWhe [62]. The CO2 reductions achieved through the application of PVWP system can be traded. CO2 credits are thus considered as revenue which can further im-prove the economic feasibility of PVWP systems. The calculations of CO2 emissions reduction have been carried out considering two different scenari-os:
reductions due to substitution of DWP with PVWP system during the irrigation season;
reductions from substitution of the electric grid with PV during the whole year together with improvement of grassland acting as carbon sink.
22
Results and discussions
This chapter presents the results about the performances of PVWP achieved in dynamic simulations and during the field study conducted at the pilot demonstration site in Inner Mongolia. The economic evaluation results are also included.
Designing and modelling of PVWP system
The solar energy resources have been investigated for Xining and Dulan, in Qinghai Province and Hohhot in Inner Mongolia. Figure 6 shows the availa-ble solar irradiation in Xining on the optimized angle for irrigation purposes and using a 2-axis solar tracking systems.
Figure 6. Monthly distribution of solar irradiation on a surface tilted 10° towards south and on a 2-axis solar tracking surface in Xining
The optimization of the solar energy resources was carried with PVsyst in order to maximize the gathered solar irradiation during the irrigation season. The resulted tilt angle is 10°. The 2-axis sun tracking system can further increase the delivered solar power by 30%. The assessment of the crop water
23 requirements is conducted by considering Alfalfa (Medicago Sativa) as the grown crop. The selection of Alfalfa as the reference crop is due to the large Chinese import of Alfalfa, especially from USA to meet the growing de-mands of food and milk [63].
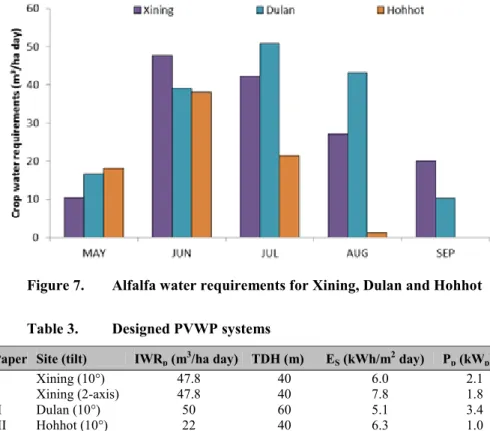
Figure 7 presents the crop water requirements for Xining, Dulan and Hohhot. Alfalfa water demand varies considerably during the irrigation sea-son and from site to site mainly depending on the crop growing stage and climate, especially effective rainfall. We assumed a crop development phase of 50 days, intermediate phase of 50 days and final phase of 40 days in all crop water requirements simulations conducted.
Designing of PVWP systems for irrigation based on available solar irradi-ation and required water demand can be executed both with a simplified approach based on the overall average system efficiency or through a de-tailed approach given by Equation 4, as conducted in Paper I–II. In Paper III the system design is proposed for optimization purposes and based on the available water resources more than the crop water requirements. Table 3 summarizes all the parameters affecting the design processes, such as the peak of crop water requirements IWRp, daily solar irradiation ES, hydraulic
discharge TDH and resulted peak power Pp for some of PVWP systems
stud-ied.
Figure 7. Alfalfa water requirements for Xining, Dulan and Hohhot Table 3. Designed PVWP systems
Paper Site (tilt) IWRp (m3/ha day) TDH (m) ES (kWh/m2 day) Pp (kWp)
I Xining (10°) 47.8 40 6.0 2.1
I Xining (2-axis) 47.8 40 7.8 1.8
II Dulan (10°) 50 60 5.1 3.4
24
The results of the dynamic simulations of pumped water and water demand for the studied PVWP systems are shown in Figure 8. It is clear that the de-signed PVWP systems fulfil the peak water demand in June and there is surplus pumped water during the remaining months of the irrigation season. The surplus pumped water is the direct consequence of the monthly variation of the crop water requirements and the design strategy based on the lowest ratio between water demand and available solar energy resources. The sur-plus water pumped, deriving from a sursur-plus electricity production, represents a further optimization issue that needs to be addressed in order to maximize the profit. Potential solutions may include using the same system for multi-ple scopes or designing the system not for the worst case.
Figure 8. Water supply and demand from PVWP systems for Xining
Performance comparison with WWP systems
The assessment of both solar and wind energy resources have been done for Ordos and Hails in Inner Mongolia. Hails and Ordos have quite similar solar energy resources but different wind power densities. The investigated sites receive a solar irradiation of 1690 and 1650 kWh/m2 per year respectively. Meanwhile, the wind energy intensities estimated with the Weibull approach are 900 and 2151 kWh/m2 per year. Figure 9 shows the average monthly distribution of wind speed at 18 m for both sites. The comparison between PVWP and WWP systems is carried out on the basis of the same installed peak-rated capacity, 1 kW and 3 kW respectively. Figure 10 shows the trend of water demand and water pumped by 3 kW PVWP and WWP systems in Hails. Compared to Figure 8, it is even more evident the surplus pumped water and accordingly the corresponding surplus electricity production if simulations are led on annual basis. Although both PVWP and WWP
sys-25 tems show some mismatching in meeting the crop water requirements, espe-cially in June and July, both systems show a high potential during the rest of the year, both for pumping and providing electricity.
Figure 9. Average monthly wind speed at 18 m hub height in Dege, Hails and Ordos
Figure 10. Water supply and demand from 3 kW capacity PVWP and WWP systems for Hails
26
Field experiments and experience
PVWP models validation
The solar radiation, PV delivery, water flow rate, variation of the water table and evapotranspiration have been measured at the pilot site and used to vali-date the results of dynamic simulations. Table 4 summarizes the PRMSE obtained between simulated and measured values.
Table 4. Validation of integrated PVWP system simulations
Measurement PRMSE (%)
Water flow (recirculation) 18.7
Water flow (irrigation) 28.8
Well water table 29
Evapotranspiration 4.2
For the water flow rate in recirculating scenario, a PMRSE of 18.7% was obtained in this study. S. Ould-Amrouche et al. [35] reported a PMRSE low-er than 6%. The difflow-erence may be due to the tests wlow-ere conducted at a pumping test facility. In the irrigation scenario, the mismatch between the simulated and measured water flow rates is even higher resulting in a PRM-SE of 28.8%. This may be due to the dynamic variation of the working pres-sure mainly caused by the direct connection of the PVWP system to the irri-gation lines, leakages and low accuracy of the flow meters installed.
The evapotranspiration model represents the most accurate model where-as the groundwater level modelling presents the lowest accuracy value. Alt-hough the highest PRMSE, the difference between registered and modelled water level in the well has a negligible effect on the dynamic performance of the pumping unit in terms of variation of the hydraulic head.
Optimization of the installed PVWP system
The system tested during the field experience consists of a PV array with a peak capacity of 1.44 kWp and a pump with a power capacity of 1.1 kW. No optimization was considered when designing the system. The PV array did not have the geometry which gives the highest output and during the tests, drying up of the well happened in the micro irrigation scenario indicating an oversizing of the system.
Figure 11 shows the measured and modelled pumped water as a function of the solar radiation and the water table in the well in the micro irrigation scenario. The figure shows the oversizing of the designed system compared to the local available water resources. After 12 o’clock the well dries up and the PVWP system works only for 30 minutes each hour due to the safety
27 system that prevents dry-running conditions. According to the measurements carried out during the field study, the potential daily pumped water volume is around 35 m3, whereas, the exploitable water resource volume, estimated on the basis of the recovery rate of the well, is 22 m3.
It has to be pointed out that the results achieved during the field study are referred to a short observation period and to a specific year. The level of groundwater, and thus the water availability, is strongly dependent on the amount of precipitations. The proposed optimization process aims to maxim-ize the delivered PV power, avoid overexploitation of the water resources and minimize the investment costs. To maximize the solar irradiation hitting the PV array, the system should be mounted facing south and with a tilt an-gle of 20°. Compared to the current installation (tilt and azimuth anan-gles are 42° and 36° towards East respectively), the optimization of the tilt and azi-muth angle allows harnessing 9% more solar energy during the irrigation season. The optimal system design should have a PV array with a peak pow-er of 1 kWp and a pump with a power capacity of 0.75 kW.
Figure 11. Pumping tests in irrigation mode as function of the solar radiation and water level in the well
Figure 12 shows the difference in ICCs between the current installed system and the optimized one, which were assessed on the basis of Chinese local market prices. The total initial capital costs for the current and optimized system are 2410 US$ and 1570 US$ respectively. For both systems, PV modules represent the biggest fraction, accounting for 60% of the total capi-tal cost, followed by the engineering and inscapi-tallation cost and inverter. The optimized system saves 35% of the initial capital cost.
Figure 13 shows the difference in operation between the current installed system and the optimized system in terms of water flow rate and variation of
28
the ground water table. The current system lifts up 33 m3 per day whereas the optimized one only lifts up 22 m3. Furthermore, the optimized could run continuously without drying up the well.
Figure 12. ICCs and breakdown costs for installed and optimal system
29
Economic evaluation of PVWP systems
In this subchapter the economic evaluation was conducted to investigate the most cost effective solution among the available alternatives for water pumping. The profitability of PV is also compared to diesel and wind pump-ing systems with the consideration of all the possible revenues, especially grass sale.
PV pumping technologies
The differences between AC and DC pumping systems and between fixed and 2-axis tracking PV arrays were firstly analysed in terms of initial capital costs.
Generally, DC pumps are more expensive than AC pumps, however, DC/DC converters required by DC pumps as power conditioning system are much cheaper than DC/AC inverters.
The PV modules represent the major cost for a photovoltaic pumping sys-tem, accounting for more than 40% of the overall initial capital costs. A PV system equipped with sun trackers allows reducing the capital costs of PV modules and the related power conditioning system. However, the tracker can increase the initial cost of the supporting system and the replacement and maintenance costs.
There are four designed systems that are able to fulfil the crop water re-quirements for 1 ha of Alfalfa against a water head of 40 m: 2.4 kWp fixed system equipped with a DC pump, 2.1 kWp fixed system equipped with an AC pump, 1.8 kWp tracking system equipped with a DC pump and 1.6 kWp tracking system equipped with an AC pump. The results of the economic investigation are presented in Figure 14.