ROAD SAFETY MANAGEMENT TOOLS
FOR COUNTRY STRATEGIC LEVEL
Kazimierz Jamroz, Leszek Smolarek Gdansk University of Technology,
Civil & Environmental Engineering Faculty, Highway Engineering Department 11 Narutowicza str, 80-232 Gdansk,
Phone: +48 58 347-11-47, Fax: +48 58 347-12-50 E-mail: kjamroz@pg.gda.pl
ABSTRACT
Strategic road safety programmes setting out long-term visions and road infrastructure development plans must be based on road safety forecasts and an understanding of the long-term impact of different measures on road safety.
The objective of this paper is to discuss a concept of road safety management for an area of a selected country because there are no simple tools of road safety management for the development and implementation of national and regional road safety strategies.
The paper will present a method for estimating fatalities and road fatality rate in relation to the most significant sources of hazard. To estimate the number of fatalities a multiple factor model was used which is the quotient of the population of a country as a measure of risk exposure and the road fatality rate as the measure of the probability of road accident consequences. To implement the proposed method a general procedure was developed for estimating fatalities for a specific area. The paper will present a proposed risk classification as the key to risk evaluation and a method for determining the potential for reducing societal risk and indicate those countries which have the highest potential for road death reduction.
1.
INTRODUCTION
An effective and efficient road safety policy linked into the worldwide Decade of Action for Road Safety (WHO 2011) and the European Union’s 4th Road Safety Action Programme adopted by the European Commission for the years 2011 – 2020 (EC 2011) needs tools for easier strategic decision making. Strategic road safety programmes setting out long-term visions and road infrastructure development plans must be based on road safety forecasts and an understanding of the long-term (over 10, 20 and even 30 years) impact of measures (political, investment and others) on road safety.
Poland is number twenty for its number of killed in road accidents worldwide and number one in the European Union which makes road safety efforts a top priority. The implementation of GAMBIT road safety programmes (Jamroz at al 2006) has contributed to a systematic reduction in road deaths in Poland. But the results are far from the expectations. Poland should work harder to prepare the necessary conditions (legal regulations, funding, guidelines, methods and good practice) to ensure that it can effectively implement the EU’s recommendations. The theoretical foundations for Poland’s Road Safety System were laid
thanks to the research project Integrated System of Transport Safety ZEUS (Krystek et al 2012), but the practical tools to implement and test the theory in pilot projects are still not available. One such important tool would be a road safety management method. Modern road safety management includes risk management.
The process of road safety management is complex and requires modern tools to help with identifying the risks road users are exposed to, assess the level of road safety and select measures for an effective improvement of road safety. Risk management in road transport can offer the necessary method. Risk management can provide tools which support decision-making at different levels of road safety management, i.e. in road infrastructure management, (Jamroz 2008), road traffic management (Jamroz 2007), (EuroRAP 2010), passenger and goods road transport management and when a road user is using traffic. The most advanced methods of road risk management are those proposed for road tunnel and road network risk management. However, road transport risk management is still in early stages of development and does not have formal standards, typically used in the chemical and energy industry (Lowe 2009) or in other types of transport. This is why a risk management method should be developed to meet the specificity of risks on the road network of any country. Risk management is performed at different levels of management: strategic, tactical and operational. At the strategic (political) level represented by the political powers of a country, the ministry of transport or infrastructure, the decisions have the biggest impact and are taken under conditions of uncertainty or risk due to lack of data, volatility of the problem, and a lack of tools to support decisions. This calls for risk management tools (Jamroz et al 2010).
2. STRATEGIC RISK MANAGEMENT
Strategic management is a process in which an organization sets objectives, defines how the objectives will be accomplished (in a policy) and secures the necessary resources to deliver the policy (Schanzer & Eyerman 2009). The objectives of a country’s strategic road transport safety plan may be to:
• protect the public against dangerous people (terrorists), • protect road users from death and injury,
• protect critical infrastructure (including transport infrastructure), • strengthen the emergency system (including road rescue).
There is a degree of uncertainty involved in accomplishing the objectives. This is due to the volatility of the factors affecting the accomplishment of goals, the complexity of the problem, ignorance of safety managers, lack of precise methods for risk estimation and assessment and lack of information on the part of the partners (local governments, organisations dealing with safety, the public). Strategic management can use risk management as one of its tools which in this case is strategic risk management. This risk applies to the chief manager or a group of managers who are responsible for a particular process or organisation, just like a driver as an owner of an individual risk who is responsible for driving safely.
In this sense strategic risk is a type of systemic risk which covers the entire system of road transport and road infrastructure. If materialised in road transport, systemic risk can cause death, injury, financial, environmental and economic consequences. It is very difficult to manage systemic risk because of the scale and the fact that risk factors occur at the macro, mezzo and micro level.
Strategic risk is a long-term risk which forms part of long-term decisions taken by organisations which manage road safety in a specific area.Strategic risk provides the basis for governments (OECD 2009) and road authorities to take decisions designed to treat the high risk sites on the road network, take strategic action and spend the budget efficiently.
Strategic risk management can be done mainly when road networks are planned and operated by international organisations, governments, central bodies and regional authorities in the countries.
Risk management has to include a procedure for establishing the responsibility of those in control of managing, decision-making and running the elements of the process. Risk management in highway engineering is a formalised and repetitive procedure bringing together risk assessment and response to risks on road networks (Jamroz 2007).
The objective of the method is to help road managers to take reasonable decisions regarding: road safety, road infrastructure safety and other consequences in the different phases of a road’s life cycle. The method should support safety management and protect communities living in a group of countries or a specific country from road risks by providing an objective and effective tool for:
− assessing the risk on existing and planned road networks at the international and national level,
− preparing national road safety programmes,
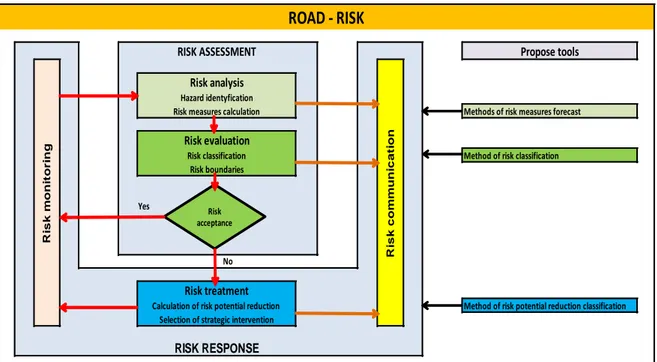
− selecting effective and efficient strategic measures for road safety at the national level. A five stage method is proposed for risk management in road transport called ROAD-RISK which covers: risk analysis and evaluation during the assessment phase and risk handling, risk monitoring and risk communications in the risk response phase (Jamroz 2011). This paper will focus on presenting selected elements involved in the first three stages of road transport risk management at a country’s strategic level where scientific support is needed. Fig. 1 shows the general diagram of the proposed ROAD-RISK method with the necessary tools for its application.
The proposed safety management method involves the completion of procedures designed for the particular stages of management. In the first stage involving risk analysis, the method identifies the context of the analysis, the risks and risk factors and measures risk. Risk measurement involves the identification of risk measures, selecting a method for risk estimation and calculating the measures of the selected risk. In stage two risk is evaluated which involves the adoption of classes of risk and risk acceptance levels and then checking the class of the risk calculated in stage one against the country’s transport system and its acceptance levels. Based on this, the decision is made on the appropriate response to risk. If the risk is unacceptable, stage three is initiated involving risk response. The potential for reducing the risk is estimated, followed by a selection of strategic measures (interventions) which are then assessed for risk (feedback loop).
For the management process to run smoothly we need tools to help with risk assessment and evaluation and decision-making. Three tools have been identified that require scientific support. They are: method for estimating measures of strategic societal risk, method of risk classification and method for estimating the potential for risk reduction.
Fig. 1 Diagram of the ROAD-RISK management method (Jamroz 2011).
3.
METHOD FOR ESTIMATING FATALITIES
Strategic societal risk refers to the behaviour of entire social groups in a given area. It is a consequence (number of victims and the costs of accidents) over a specific period (usually per year) in a specific area (continent, country, region, county, city) which is likely to happen as a result of hazardous events released by the operation of the road transport system. The risk changes slowly over time and is affected by the country’s economic development, social change, better education, etc. Depending on the measure representing a given area, we can distinguish:
• overall risk calculated as the total consequence of accidents (number of victims, costs), • normalised risk calculated as the total consequence per: the population in a given area,
number of vehicles registered in a given area, gross national product, length of the road network, miles travelled.
A multiple factor model was used to estimate the number of fatalities. The estimation of societal risk was conducted using a model with two components in which societal risk RS is taken as the quotient of a selected type of risk exposure E and a selected category of average consequence K(E) in relation to a unit of risk exposure on the road network of a country in a
time period (Jamroz 2011). The model is described with formula (1):
𝑅𝑆 = 𝐸 ∙ 𝐾(𝐸) (1)
The proposed method uses two measures of societal risk: number of fatalities F as a general measure and the road fatality rate RFR as a normalised measure of societal risk. Considering the risk measures the model will look as follows (Jamroz 2012/1):
F= 𝑃 ∙ 𝑅𝐹𝑅(𝑃) (2) The number of fatalities will be the quotient of the population (P) of a country as a measure of risk exposure and the RFR(P) (road fatality rate dependent on demography) as the
RISK ASSESSMENT Risk analysis
Hazard identyfication Risk measures calculation
Risk evaluation
Risk classification Risk boundaries
Risk treatment
Calculation of risk potential reduction Selection of strategic intervention
RISK RESPONSE ROAD - RISK R is k m oni tor ing R isk co m m u n icat io n Propose tools
Methods of risk measures forecast
Method of risk classification
Method of risk potential reduction classification
Risk acceptance
Yes
measure of the probability of road accident consequences which in this case means road deaths.
The RFR(P) is calculated (formula 3) as the quotient of the base RFR(P),b and modification
factor MF taking into account the estimation error ε(t).
𝑅𝐹𝑅(𝑃) = 𝑅𝐹𝑅(𝑃),𝑏∙ 𝑀𝐹 + ε(𝑡) (3) The rate RFR(P),b is calculated with a function which depends on the country’s level of
social and economic development (measured with the GDPPC) and the level of miles travelled (measured with the average trip by vehicles per capita VTKPC). This relation is described with the power exponential function (formula 4) whose parameters were selected using multidimensional dimension non-linear regression. This function was developed on a data set from 13 selected countries worldwide (having model characteristics over the last 50 years).
𝑅𝐹𝑅(𝑃),𝑏 = 𝛽𝑜∙ 𝐺𝐷𝑃𝑃𝐶𝛽1∙ 𝑉𝑇𝐾𝑃𝐶𝛽2∙ 𝑒𝑥𝑝(−𝛽3∙ 𝐺𝐷𝑃𝑃𝐶+𝛽4) (4) The modification factor MF is calculated as the relation between the actual road fatality rate RFR(p) and the base RFR(P),b. The calculation is made using the function described with
formula 5. The modification factor MFb is calculated using the function described with
formula 6 where independent variables are represented by parameters of the main risks (i.e. demographics, area, economic, social, motorization and infrastructure factors).
𝑀𝐹 = 𝑀𝐹𝑏∙ 𝑀𝐹𝑐 (5)
𝑀𝐹𝑏 = 𝛽0∙ 𝑒𝑥𝑝 (∑ (𝛽𝑛𝑖=1 𝑖∙ 𝑋𝑖)) (6)
In this function the parameters of the critical independent variables were selected using multidimensional non-linear regression from a dataset of 60 countries worldwide over a period of the last 50 years. The modification factor MFc is used for matching the results of
calculation to the conditions of a country.
The results of the analyses were used to develop a simplified method of estimating societal risk (RFR and F) which selected groups of users (decision-makers, students, journalists) will find easy to understand. Figures 2-4 shows a graphic interpretation of the method comprising three groups of charts for estimating:
• the road fatality rate RFR(P),b in relation to GDPPC and VTKPC (Fig. 2),
• the RFR(P), depending on the size of the RFR(P),b and modification factor MF, which
depends on the adopted strategy (Fig. 3),
• the number of fatalities F in relation to the value of the road fatality rate RFR(P)
and population P (Fig. 4).
The application of the method is presented on the example of Poland for existing data from 1991, 2001, 2011 and forecasts for 2021 (Jamroz 2012/2). Scenario (a) with moderate interventions MF=0.47 and scenario (b) – advanced interventions MF=0,25 , see table 1.
Table 1. Poland example for existing data and forecast Year (scenario) P (mln inhab.) GDPPC VTKPC RFR(P),b MF RFR(P) F (mln inhab.) (thous. ID/ inhab./year) (thous. km/ inhab./year) (fatalities/1 mln inhab. /year) (fatalities/1 mln inhab. /year) (fatalities /year) 1991 38,1 7,6 2,65 88,1 2,35 207,1 7901 2001 38,6 12,0 3,88 133,3 1,07 143,2 5534 2011 38,3 19,3 7,30 180,4 0,61 109,5 4198 2021 (a) 37,7 28,9 10,50 158,7 0,47 74,2 2800 2021 (b) 37,7 28,9 10,50 158,7 0,25 39,7 1500
Fig. 3 Diagram of the simplified method for estimating the resulting road fatality rate RFR(P)
on the example of Poland
4.
SAFETY CLASSIFICATION
Risk evaluation regarding the road network of a given country involves checking whether the risk or specific risk treatment measures (estimating using the proposed method) is acceptable compared to risk standards or criteria.
Because the road transport system is complex, road safety cannot be evaluated properly based on standards only. As a result, the approach adopted is based on quantitative criteria. This involves the setting of clear risk limits under which the analysed system can operate, risk treatment measures are applied or the operation of the system is cancelled altogether.
The following objectives are to be achieved in the proposed risk assessment method: develop a classification of risk levels (areas), set risk limits (risk acceptance) and select the limits of risk areas.
If there are many areas of risk, the boundaries between the risks must be identified. When building the classification of road transport strategic risk, it is important to consider the variability of boundary values between different areas of strategic risk and to relate them to the level of socio-economic development GDPPC and the spread of RFR(P),b values for the
GDPPC (Jamroz 2011). Similarly to EuroRAP’s road risk mapping programme (EuroRAP 2010), five classes of risk were adopted and the matching areas of strategic risk A-E. The values and the boundaries of these classes were determined on the basis of the changing RFR.
An analysis of the distribution of RFR(P) values for a specific class of GDPPC suggests
that Weibull distribution is the right model of RFR distribution under the condition that
GDPPC=const. Using quantiles tk (t0,2, t0,4, t0,6 and t0,8) we can determine the boundaries of
risk classes as a function of GDPPC.
As we build Weibull distribution we assume that the probability of an event within the small range ∆RFR(P) is directly proportional to ∆RFR(P) which means that the average number
of events per unit changes as the GDPPC changes. The choice of estimators of distribution parameters using a random sample is related to the probability of the sample occurring.
The probability density function of Weibull distribution does not have a characteristic shape. Thanks to this the distribution is quite consistent with empirical data. The classical methods for determining safety limits are: the percentage of the average or median or the quantiles method of the parameter’s distribution. In this paper the quantiles of distribution are used RFR(P) as a function of GDPPC. As a result, a country is considered safe if the road fatality rate RFR(P) is less than the distribution quantile RFR for the selected group of
countries, modelled with Weibull distribution and for a specific value of GDPPC.
Using the base function RFR(P),b described with formula 4, for the average value of
VTKPC the base function RFR′(P),b and a function describing the boundaries of risk areas for
the different classes RFR′(P),g(m). were adopted. To determine boundary functions between the
areas (classes) of risk, we used the base function RFR(P),b and quantile distributions of the
RFR (P) (using parameters CV - the coefficient of variation and α - the shape parameter)
which was calculated using formula 7.
𝑅𝐹𝑅(𝑃),(𝑚)′ = �𝑅𝐹𝑅(𝑃),𝑏 ∙ 𝐶𝑉� 𝛼
∙ �−ln (1 − 𝑝)𝛼 �Γ �1 + 2𝛼� − Γ2�1 + 1α��
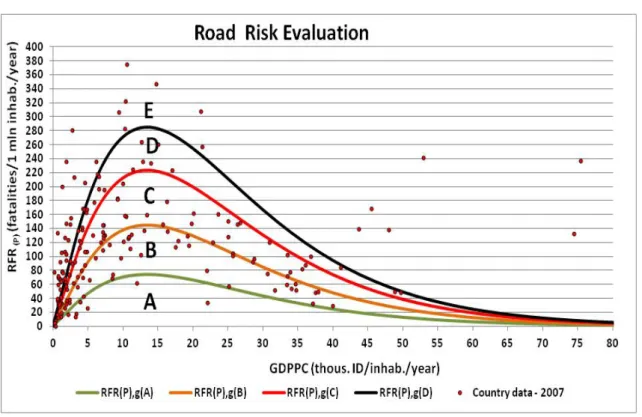
Fig. 5 shows the boundaries of classes of risk indicating the level of safety for the specific countries based on 2007 data (WB 2009). It shows that in 2007 in 180 countries under analysis the level of road safety in class:
• A (very low strategic risk) – occurred in 4.0% of the countries, • B (low strategic risk) – 23.5 % of the countries,
• C (medium strategic risk) – 25.1 % of the countries, • D (high strategic risk) – 16.2 % of the countries, • E (very high strategic risk) – 31.2 % of the countries.
Fig 5. Proposed boundaries of strategic societal risk in road transport classified for 2007 data and 180 countries.
5. POTENTIAL FOR REDUCING FATALITIES
The potential to reduce societal risk can apply to the possible reduction in the number of accidents, injured and killed and accident costs as a result of measures and interventions. In this paper the potential to reduce societal risk PFR means the number of people whose lives can be saved from a fatal road accident on the country’s road network if the measures of normalised risk RFR(P) were reduced to a specific level (e.g. to level A). Once known, the
societal risk reduction potential can be used to (Jamroz 2011):
• rank countries according to their highest risk reduction potential,
• select strategic measures (interventions) in the countries to effect a real reduction which will be at least equal to the potential reduction.
The potential to reduce fatalities in a given country (i) was calculated using this formula (8):
𝑃𝐹𝑅𝑖,(𝐴)= 𝑃𝑖 ∗∙ (𝑅𝐹𝑅(𝑃),𝑖− 𝑅𝐹𝑅(𝑃),𝑔(𝐴)′ ) (8)
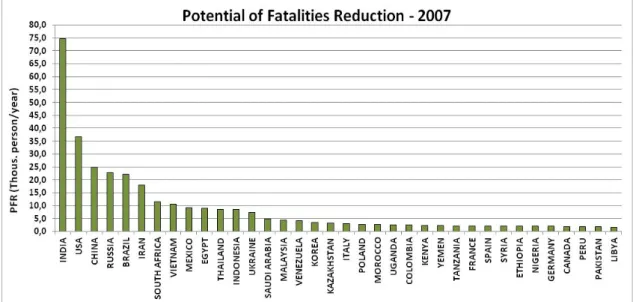
Formula 8 helped to estimate the fatality reduction potential for a group of 180 countries in the world for 2007 data (WB 2009). In the calculations the cut-off level was boundary A of risk area RFR′(P),g(A). Based on this calculation the potential for reducing fatalities for 2007
data in the countries under analysis was 385 thousand people. 20% of the countries in Fig. 6 (i.e. countries with the highest number of people who could be saved from fatal road accidents based on 2007 data) represent some 85% of the worldwide potential for reducing fatalities.
Fig. 6 Countries with the highest potential for saving lives in rad accidents (on the example of 2007 data).
6. CONCLUSIONS
Based on risk management, this method of road safety management facilitates strategic decision-making at the level of international organisations or national bodies involved in road safety.
The concepts of three tools for estimating strategic societal risk measured with the number of fatalities and risk evaluation will help improve how countries manage road safety. The method for estimating the potential for reducing road deaths will help international organisations (UN, WHO, WB) to focus more on those countries that have a greater potential for saving lives.
Developing these concepts further requires more research on the detailed features of the tools and testing them on the most recent worldwide data.
REFERENCES
EC (2011): WHITE PAPER - Roadmap to a Single European Transport Area – Towards a competitive and resource efficient transport system. EU, EC, Brussels.
EuroRAP (2010): Road risk report reveals safety of Europe's trade routes. www.eurorap.net Jamroz K., Michalski L., Gaca S. (2006): Road safety programmes as an effective tool for developing system-based road safety policies. Journal of KONBiN. Vol. 1, No 2/2006,
Jamroz K (2007).: Highway Engineering Risk Assessment. Archives of Transport, vol. 19, Issue 1-2, Warsaw 2007, pp. 67 – 74.
Jamroz K. (2008): The application of risk analysis in the assessment and management of road safety in road tunnels. Journal of KONBiN
Jamroz K., Kadzinski A., Chruzik K., Szymanek A., Gucma L. , Skorupski J. (2010):
TRANS-RISK – An integrated method for risk management in transport. Journal of KONBiN 2010.
Jamroz K., (2011): Metoda zarządzania ryzykiem w inżynierii drogowej (in Polish). (Method of risk management in highway engineering). Wydawnictwo Politechniki Gdanskiej. Gdansk, Poland.
Jamroz K. (2012/1): The impact of road network structure and mobility on the national traffic rate. EWGT 2012. 15th meeting of the EURO Working Group on Transportation. Procedia and Behavioral Sciences 54 ( 2012 ) 1370 – 1377. www.elsevier.com/locate/procedia
Jamroz K. (2012/2): Can Poland accomplish VISION ZERO at all? Poster presented at the DaCoTa Seminar, 25th - 26th November 2012, Athens
Krystek R., Michalski L., Zukowska J. et al (2012): An integrated system of transport safety. Synthesis. WKŁ Warsaw.
Lowe M.F. (2009): Globally Harmonized System of Classification and Labelling of Chemicals (GHS). US Environmental Agency, Arlington USA.
OECD (2009): Studies in Risk Management. Inovation in Country Risk Management. OECD Paris.
Schanzer D.H., Eyerman J. (2009): Strategic Risk Management in Government: A Look at Homeland Security. Managing for Performance and Results Series 2009. IBM Center for The Business of Government .
WB (2009): World Development Indicators database. World Bank