The impact of
automation software
on white-collar
productivity:
automation software
BACHELOR THESIS WITHIN: Business Administration NUMBER OF CREDITS: 15 credits
PROGRAMME OF STUDY: International Management AUTHOR: Gabriel Díaz Garza Martínez, Fernando Godínez Cornejo TUTOR:Thomas Cyron
JÖNKÖPING May, 2016
A multi-case study with a qualitative
approach.
Bachelor’s thesis in Business Administration
Title: The impact of automation software on white-collar productivity: A multi-case study with a qualitative approach
Authors: Gabriel Díaz Garza Martínez & Fernando Godínez Cornejo
Supervisor: Thomas Cyron
Date: [2016-05-23]
Subject terms: white-collar productivity, clerical work, automation software, IT implementation, white-collar productivity dimensions, business administration, office automation.
Abstract
Purpose – The purpose of this thesis is to analyze through a qualitative study, how the implementation of automation software affects the productivity of clerical work performed by white-collar employees.
Design/Methodology/Approach – Results are a product of secondary sources and the collection of primary data. Our research strategy was a multi-case study, which included four different companies. One in-depth interview per case was conducted with managers who were responsible for the software implementation in each of their companies. Findings – The automation software implementation was a success as it was perceived to impact positively white-collar productivity. Crucial findings indicate that Cost, Quantity, Time, Autonomy, and Quality, are indeed the dimensions by which the phenomenon is affected from a clerical stance. Secondly, it becomes evident that the dimensions of Quality and Time, cause the rest of the addressed dimensions, and therefore should be regarded as more important. Furthermore, it was identified that the automation software justified its investment by increasing the cash flow of the studied businesses. Finally, the success of the implementation was due to factors such as a trial period, and that the employees embraced the change, inasmuch as it replaced the workload and not them.
Originality/Value – This thesis contributes to existing literature as it identifies the dimensions in which white-collar productivity is perceived to be affected and the relation between them. This is significant for the academic world as it provides future investigators with a set of related dimensions to elaborate further research on the field. It also highlights
the benefits of automating clerical work, which currently is underestimated in business literature.
Keywords – white-collar productivity, dimensions, clerical work, automation software, IT implementation, office automation.
Table of content
1. Introduction ... 6 1.1 Background ... 6 1.2 Problem ... 6 1.3 Purpose ... 7 1.4 Research questions ... 7 1.5 Limitations ... 7 2. Literature Review ... 82.1 White-collar work and clerical tasks ... 8
2.2 The past of office automation ... 9
2.3 Automation and the study software ... 11
2.4 Productivity measurement ... 12
2.5 Liquidity and productivity ... 14
3. Methodology ... 16
3.1 Philosophical posture ... 16
3.2 Approach ... 17
3.3 Research purpose ... 18
3.4 Type of methodology ... 18
3.5 Strategy: Case study ... 19
3.6 Time Horizon ... 19
3.7 Data collection: In-depth interviews ... 20
3.7.1 Sampling ... 20 3.7.2 Primary Data ... 21 3.7.3 Secondary Data ... 22 3.8 Data analysis ... 22 3.9 Trustworthiness of research... 23 4. Findings ... 24 4.1 Quality... 24 4.2 Quantity ... 27 4.3 Cost ... 28 4.4 Autonomy ... 30 4.5 Time... 31
4.6 Negative aspects of automation software ... 32
5. Analysis ... 33
5.1. What characteristics from the implementation process, can be regarded as key-factors in future IT implementation? ... 33
5.2. Which factors need to be considered to evaluate productivity-differences between clerical work and automation? ... 36
5.2.1 Time ... 37
5.2.2 Quality ... 38
5.3. Is automation at this level justifying the company’s investment? ... 39
6. Discussion ... 41
7. Conclusion ... 43
7.1 Further research ... 44
Appendix ... 48
List of Figures Figure 1: key-elements modified at Haigh's levels. ... 33
Figure 2: Implementation process. ... 35
Figure 3: relationship among white-collar productivity dimensions ... 39
Figure 4: flow-chart of the automation software implementation ... 40
List of Tables Table 1:Cases description. ... 22
1. Introduction
1.1 Background
Computer technology applied to an office environment, does not aim only to improve the efficiency of the workplace, but also altering the nature by which office work is conducted (Olson & Lucas, 1982). Therefore, we can assume that a mistaken use of technology at an office stance, might lead to affect negatively the way work is carried out, and thus, make reality the nightmare of any manager: bring up costs.
Over the past years, Information Technologies (IT’s) have been addressed into task performance improvements through any type of business. The goal is clear, high costs and delivery time are issues that managerial decisions aim to reduce. Increase productivity goes hand in hand with any investment that a company does in order to stay competitive in the market. However, the implementation of any software does not ensure higher productivity. If we take a look at white-collar activities, there is often a lot of clerical work that lowers productivity rate and increases the administrative cost. Automation emerges as a solution for those problems. Furthermore, it represents a step forward to standardize clerical work and as a consequence, the company will benefit with better quality and productivity.
Moreover, clerical positions may involve repeating several times only few specialized tasks. This issue reflects in complaints of fatigue from employees, which is an indicator that their productivity is diminished (Davis, 1991).
1.2 Problem
Information Technology (IT) has been on the investment agenda of a lot of contemporary businesses; however, it is not clear whether this type of technology really affects in a positive way the work that is done at office facilities. There is not much information regarding the effect of the implementation of IT software on a clerical level, even though this part is constantly demanded to be efficient and expected to be effective. Managers often struggle meeting both, good output rates and quality work. Employees regularly compute big volumes of data and subsequently process it in diverse ways. The monotony and the time, which these tasks require, may deplete the quality, and may keep the worker from performing other more relevant activities.
technology tools may not be fully grasped if the evaluation approaches are static, closed systems, and focus on hard measures of the economic outcome (Chan, 2000). Therefore, engaging into a qualitative methodology is not just an appropriate decision in order to make our study more dynamic, but it also stands out as it aims to fill an existing gap in literature by doing so.
1.3 Purpose
The objective of our thesis is to analyze through a multi-case study, how the implementation of automation software affects the productivity of clerical work performed by white-collar employees. By doing so we intend to acknowledge whether this type of technology improved or not the perceived productivity at this stance. In addition, we also hope to identify the relevance of standardizing clerical work and the value it represents for a company. Moreover, we intend to point out the key-factors which may have determined the success or failure of the software implementation, with the aim of having a deeper understanding of this tool.
1.4 Research questions
The key research questions to guide the paper are based on the idea of understanding automation software’s impact on productivity arguing different dimensions.
What characteristics from the implementation process, can be regarded as key-factors in future IT implementation?
Which factors need to be considered to evaluate perceived performance-differences between clerical work and automation?
Is automation at this level justifying the company’s investment?
1.5 Limitations
The research will analyze the implementation of the software by a Mexican company named “Best Collect” in different transnational companies and will only consider the white-collar productivity of that region to determine the positive or negative effects of automation. Also, clerical work will only be considered as any activity done with a computer, such as sending emails; leaving the physical activities (printing) out of it. Finally, the research method used (in-depth interviews) focused only in a managerial level. Therefore, every
aspect analyzed was seen from the managers’ point of view, that were responsible of implementing the software in the organization.
2. Literature Review
2.1 White-collar work and clerical tasks
In order to illustrate at what organizational level the software is implemented, as well as the conditions under which it occurs, we first review the concept of white-collar jobs; due to the popular conception that the employees who work in an office, without doing manual labor, are usually categorized under the aforementioned concept (Hopp, Irvani & Liu, 2009). Jobs are divided and categorized according to the organizational role each employee maintains as he performs specific tasks. According to the job content and the tasks it involves, workers have been commonly classified as blue-collar or white-collar workers (Anjum, 2013). It is an old distinction, which still survives nowadays and whereas the former focuses on carrying out physical tasks, whilst the later one deals primarily with processing information (Denning, 2002). This contrast, regarding the processing of data instead of physical goods, has been the core of many white-collar definitions (Davis, 1991; Schreurs, 2010), establishing that white-collar employees are those who primarily work with numbers, words, symbols, concepts and information (Schreurs, 2010); such as accountants, bankers, attorneys, supervisors, etc. (Anjum, 2013).
However, by taking the approach of focusing on the job title (e.g., accountants, supervisors) rather than considering the actual tasks that the role requires, we get a conceptualization of white-collar work which offers a broad image, yet it fails to reflect the variety of activities in different work settings (Schreurs, 2010). The distinction between collar colors might thus become obsolete. Several jobs involve carrying out tasks that can be perceived as white-collar activities or vice versa making the dividing line blurry; an example are office clerks who undertake mechanic and repetitive tasks such as typing, sending e-mails, which are more related to a blue-collar nature of work (Hopp et. al, 2009).
For the realization of this thesis, we will consider the common definition of the aforementioned concept, which states that white-collar jobs consist of activities and tasks that deal with intangible resources. We will also take into account the mentioned division of
white-collar work postulated by Hopp et. al (2009), recognizing three categories: clerical, professional, and managerial. The latter two consist of unpredictable inputs, having a less potential to be automated than the clerical level, due to the fact that the tasks performed, are hard to predict a pattern and difficult to program (Davis, 1991).
Clerical tasks are fairly well defined, bounded, and frequently scripted activities, such as data processing, billing, and answering customer queries (Schultze, 2002). These operations “with predictable and closely related set of inputs, procedures, and outputs are relatively easy to plan, control, and measure” (Davis, 1991 p. 59). In result they offer large opportunities for new Information Technologies (IT’s), in which our paper will be focusing.
2.2 The past of office automation
Automation started out, in the beginnings of 1950s, in the manufacturing industry in order to increase productivity by accelerating production with less work force. However, there was certain resistance from manufacturer workers who looked automation technology as a job thief because companies were hiring less workers for daily production. Even influential magazines, like TIME with “The Automation Jobless” published in 1961, showed the concern that automation was stopping job creation and could possibly affect the economy, as unskilled workers were being pushed aside by the technology.
Nevertheless, during the late 1970s, there was a generalized idea that computers were about to change the way business operations ran and automation was the basis of this shift. Articles such as “Here comes the Automated Office” and “The office of the future”, by Infosystems and Business Week respectively, promoted the idea that automation was going to be the inflection point to achieve the main purpose of technology revolution in the office that was to provide every executive worker with a computer terminal (Haigh, 2006).
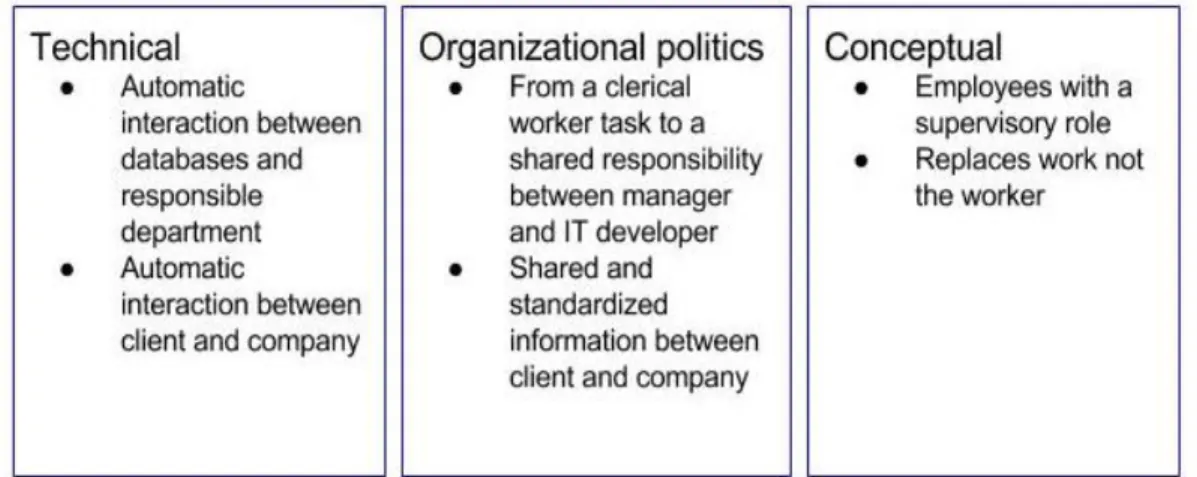
According to Haigh (2006) the significant transition in office administration with automation can be described in three different levels:
Technical: systems capable of word processing were replaced by network systems that allowed interaction between computer systems around the company with shared information.
Organizational politics: The authority for white collar workers had to manage not only employers but data processing, becoming responsible of the technology available.
Conceptual: Productivity was now associated with the idea that any investment in technology should be together with an investment in skilled workers rather than only lowering the work force.
In the early 1980s, the business opportunity that developing this type of technology represented, was worth to invest several resources for some companies. IBM, DEC, Wang and Xerox were the main pioneers for automation office, being the latest the most committed by investing big amounts of resources in the development. The main idea behind office automation was to create a series of interconnected systems with the ability of sharing information that provided managers control over word processing task such as reports, statistics and storage (Haigh, 2006). However, there were failures along the implementation of automation, which made it seem like a utopian idea. One example, described by Hiltzik (1999), was the Star workstation design by Xerox. The high investment and all technical support it needed were not the main problem, but the fact that the available hardware was not developed enough to handle the integration of software.
Also, some assumptions of automation, when trying to improve productivity, have hampered the settlement of this technology through its history. Rhea (1985) explains a case study where a federal agency tried to implement automation in their office. However, they did not have the skilled personnel to manage the IT and created a distrust environment around workers about the useful of automation.
As a consequence, managers disproved the introduction as it seemed of limited application. Assumptions carried out from the author are mainly focused on the idea that automation in the office is commonly seen like an “image-builder”. This means that there is no deep study of the measurement of productivity before and after automation is introduced into the office, leading to inadequate use of technology available and failure in the implementation.
Nowadays, automation is essential in most of production lines when seeking to increase productivity and quality. From car assembly, call centers and package recognition
in a delivery company to an administrative office in charge of statistics and reports, this technology increases competiveness in products and services by lowering time production and reducing human mistakes in a significant way. It is known that unskilled employees are being set aside and workers familiarized or educated managing technology are overtaking industries.
Autor (2015) proposes that automation, in these days, can take two directions in the business to be more attached to the near future: machine learning and environmental control. The first one refers to changing the current algorithms that make computers identify objects, real or animated, via patterns that repeats in several common objects, to an algorithm capable of understanding the essence of the matter and learn by itself the variety that may face while working.
The second one, environmental control, challenges the current lack of flexibility that automation softwares usually presents. Basically the current technology is instructed to follow some kind of instructions in order to work with inputs and deliver outputs. However, it seems that adapting to any changes that could happen in the industry or the office may be the next step by recognizing variability in the environment and being capable to react by itself in a proper way leading to the minor consequences.
2.3 Automation and the study software
Automation is defined as “the automatic operation and the process of making things automatic” (Vagia, Transeth, & Fjerdingen, 2016 p. 190), in other words, functions and activities previously performed by workers, are now carried out by machines, or in our case by software. As a result of automation, workers can avoid routine tasks and focus on intellectual and cognitive ones, changing the role of the employee from manual to supervisory (Vagia et al., 2016).
The automation software developed by the company Best Collect, and who will be the subject of our study, is explained by the words of the director of IT of the company, Ricardo Suárez in an interview which was conducted via email:
“The automated systems we develop have the capacity of retrieving data from diverse sources, such as: online portals, Excel files, text files, etc. On paper, these are the same sources an employee has access to; hence, the software takes data as inputs,
then follows the predefined process of what to do with it, in order to later offer an output in the form of a report in a wide variety of options (Excel files, PDF’s, stored information in data bases, etc.)”
Ricardo provided the next following real case, which is presented in the hopes of clarifying how the program functions:
“One of the companies we work with, receives their payment notifications through an online portal, however, this information is incomplete. In order to identify the paid invoices, as well as the payment differences; the employee had to spend a lot of time consulting 3 Excel sheets, and although they would use Excel functions, the emission of the report would take them to much time. Our software follows the same process and replicates it on the computer”.
2.4 Productivity measurement
Automation Software seeks to improve white-collar tasks in terms of productivity and quality. It is necessary to approach these concepts regarding performance and cost as it will allow us to understand benefits and downsides of implementing the software. To start, we defined productivity as a ratio determined by the quantity of outputs per number of inputs used in the realization of certain tasks. Hence, productivity is directly proportional to higher production and inversely proportional to higher investment (Coelli, et al. 2005). The main idea of this ratio is to produce more with less in order to improve.
However, the variety of work that a white collar is responsible makes hard to measure productivity. The main reason is that not every procedure is standardized. In other words, there is a huge amount of activities done in a particular way that impacts on the performance of every white-collar worker. Ramirez and Nembhard (2004) established certain benefits that will come with a suitable measure of productivity for white collar tasks. Planning, as an outcome of understanding productivity measures, seems to be the main attraction for those interested in office performance as it enables to determine capacity of workers to perform and develop strategies such as investing in weaker areas of the company.
Keeping on record every output done by a white collar worker is difficult and leads to a problem when non-added value activities are taken into account. Ramirez and Nembhard (2004) provide a number of dimensions that were developed after examining academic work on the matter of methodologies that measure white-collar worker productivity, from the previous 60 years of research. The literature they analyzed was summarized into 13 different levels, in order to assess white-collar productivity. The aforementioned dimensions are the following: (1) quantity, (2) cost, (3) timeliness, (4) autonomy, (5) efficiency, (6) quality, (7) effectiveness, (8) customer satisfaction (9) innovation (10) project success (11) responsibility of work, (12) white-collar’s perception of productivity, and (13) absenteeism. The first four dimensions (quantity, cost, timeliness, and autonomy) are the most frequently used in the analyzed methodologies by Ramirez and Nembhard (2004).
Therefore, we will only be taking into account these four dimensions, since over 96 percent of all the studied methodologies used one or a combination of these four to measure white-collar worker productivity. On top, we will also be taking into consideration quality, inasmuch as not many methodologies directly consider it, whilst most of the literature agree that it is an important factor to take into consideration when measuring white-collar worker productivity (Ramirez & Nembhard, 2004). The chosen dimensions are now better explained and described:
Quantity: it stands for the number of outputs produced, and the quantification of outcomes, such as customer and employee satisfaction (Ramirez and Nembhard, 2004).
Timeliness: meeting deadlines for any assignment, reflects the capacity of the workers to increase value added activities as an output of the system. Thus, non-value added activities duration are analyzed and helps to measure productivity as key parameter (Agarwall, 1980).
Cost reduction: taking into consideration cost of employees may be discussed. Drucker (1999) argue that workers are assets because earnings coming from task finalization do not demonstrate the real contribution of the employee in the organization. However, the analysis of the implementation of Automation Software has to be done also from the economic point of view and how it impacts on the cost reduction of an organization. For this purpose, focusing on savings, as an output,
rather than white-collar workers’ costs, is a suitable measure to understand the impact of the economic analysis (Merrifield, 1994).
Autonomy: it refers to the number of tasks an employee can undertake at the same time (Ramirez and Nembhard, 2004).
Quality: measure the effectiveness of clerical work is important in the way that re-work represents decrease in productivity and doing it right from the first time will boost performance (Ramirez and Nembhard, 2004).
Several times IT implementation has failed improving productivity or even adapting to current technologies around the office. Davis (1991) offers a set of reasons that influence IT failure through time. As said above, inadequate measurement could lead to misunderstanding the performance rate. Also, integrating IT to any sector of the organization is fundamental to succeed the adaptation. There is a misleading assumption that, despite there is plenty of disorganized technology introduction, white and blue collar workers would easily master the usage in a productive way. This means that there has to be specific education toward the correct use of hardware and software (Davis, 1991). However, most of the times the information service department is responsible of the IT support without having enough resources to cover the huge need for assistance through a company.
Davis (1991) explains how Senior Management’s lack of interest in the development of technological alternatives in the office will drive IT implementation to failure, as a result of costly decisions made because of poor interpretation of the scenario. Managers do not realize the competitive advantage of the effective use of IT in the organization by linking databases or even work procedures. Additionally, the software, hardware or database must be compatible to the actual work environment, otherwise it could lead to a disaster dropping productivity to the ground. As a result, it is important to develop a strategy to know if the IT will be use to realize a specific task or it can be used by many sectors in order to unified the work and improve in big scale productivity.
2.5 Liquidity and productivity
Business operations need to be based in cash or credit in order to manufacture a product or provide a service. Companies often seek stability in their finances by having enough resources to carry out their daily operations. This means that every value added
activity has to be able to generate, in a specific period of time, the required money to fulfill costs and debts arose by business operation. Otherwise, the organization will increase their liabilities and will lead to bankruptcy (Hada & Avram, 2014).
Here is when we start talking about liquidity, as we intend to provide information about the relationship between this financial aspect and automation software. The main reason is that this parameter allows us to verify the impact in cash flow of the companies that implemented automation software in clerical tasks and the connection it has with the main aspect we try to analyze that is productivity.
Liquidity is defined as the ability of a company to suit their liabilities, by raising money through sales or with the help of financing institutions (Madegowda, 2007). As we intend to analyze the companies in a qualitative way, we need to have information regarding liquidity ratios in a horizontal comparison. Connecting current assets and cash flow with the obligations, in time, and debt, will provide a fast measure of liquidity without the need of using the entire cash budget to analyze the situation after the implementation of the software (Agrawal, 2010).
Cash conversion cycle is a liquidity ratio for short-term solvency that is strongly related to the cases presented in this investigation. The main reason is that the software was implemented in the process of bringing money to the firm. The ratio shows the length of time that sales are transformed into cash in contrast with the length of time that the firm pay its creditors (Hartmann, 2010). Moreover, the ratio is a representation of the strength of the firm’s working capital where our main focus will be the debtors’ collection period because is the parameter that can be analyzed through our methodology.
The importance of comparing liquidity resides in the way that it is a consequence of any change in productivity. Having any kind of improvement or decrease on liquidity based on a decision to boost productivity becomes crucial when budgeting the implementation of any change, in these cases of the automation software. Eisfeldt (2000) proposed in her study
Endogenous liquidity in asset markets, that liquidity and productivity have a directly
proportional relationship. In other words, higher productivity will produce higher liquidity and this change in liquidity will root the transition in productivity. On the other hand, with a positive impact in productivity and liquidity comes higher and larger risky projects developed through the company, resulting in more sales with higher quality as established by Eisfeldt
(2000). This aspects of productivity hand by hand with liquidity could be more attractive to companies that not only are willing to commit to a long term change in terms of the way processes were done, but also want a short term solution.
3. Methodology
3.1 Philosophical posture
The philosophical stance we adopt for our research design is part of how our study perceives reality, and hence will underpin the methods we decide to use (Saunders, Lewis, & Thornhill, 2009). Saunders et al. (2009) distinguish two major philosophical dimensions in research: an ontological point of view, and an epistemological one.
The ontological stance asks ‘what is the nature of reality, and what can be known about it?’ (Guba & Lincoln, 1998). Two aspects respond to this interrogative. The first one is objectivism, which posits that “social entities exist in reality external to social actors concerned with their existence” (Saunders et al., 2009 p. 110). The second aspect is subjectivism, which defines what is real, as the dynamic interaction between the social phenomena, and the social actors interested in it (Clarke & Dawson, 1999; Saunders et al., 2009).
From an epistemological point of view, the question that is formulated is ‘what is the nature of the relationship between the knower and what can be known?’ (Guba & Lincoln, 1998), put in more simple terms ‘how do researchers strive to know about phenomena?’. Positivism is a position from this philosophical perspective, which advocates the employment of natural sciences’ methods to social reality studies. This means that only observable phenomena that can actually be perceived by the senses, lead to knowledge generation, with the main purpose of producing law-like generalizations of the topic in hand (Bryman & Bell, 2007). Realism takes an approach similar to positivism on the sense that it also takes on a scientific approach on knowledge, however, the gist of this position relies on accepting the perceived reality of our senses as truthful (Saunders et al., 2009). Contrary to the core of these two stances, interpretivism is a position based on the idea that there is a strong difference between people and the objects of natural sciences, and therefore researchers should comprehend a social action, from a subjective angle (Bryman & Bell, 2007).
The philosophical scopes that take an objective approach to reality (positivism, objectivism, and realism) were considered unsuitable positions for the answering of our research questions, due to the fact that our whole purpose is to analyze the perception of the effects of automation software on productivity. Therefore, our study was developed under the ontological umbrella of subjectivity, as we believe it allows us to grasp in a more prolific manner our purpose. Consequently, since interpretivism complements a subjective point of view, it is the epistemological approach that underpinned our method.
3.2 Approach
In order to develop a good research design, it is necessary to define which approach will be undertaken for the investigation: inductive or deductive. The importance of this choice is later reflected in the way the collected data is interpreted, aiming to provide good answers that fit the initial research questions (Saunders et al., 2009). Employing an inductive approach involves making general conclusions from our gathered data. The induction process goes from observed data, to findings, to theory building, and subsequently to the incorporation and complementation of existing knowledge (Ghauri & Grønhaug, 2005). Deduction, on the other hand, would implicate the use of a theory in the construction of a preposition, and testing it later according to our findings (Collins, 2010).
Our method and data analysis followed a mixture of both approaches as we processed our observations into findings, in a flexible manner going back and forth from literature and practice. Partly, our data analysis corresponds to a deductive approach, due to the fact that we aim to identify if the chosen Ramirez and Nembhard's white-collar dimensions of productivity (2004), are the only ones that are perceived to be impacted, or if some other levels escaped our original preposition. However, due to the unstructured nature of our method, and the under-researched field of study we are aspiring to complement, an inductive approach was also taken into account by virtue of the need of getting a further understanding on how each dimension is related and perceived, and subsequently, build prepositions from our findings.
As a consequence, the approach by which our study will take place, is abductive. This term involves a back-and-forth interaction among the social world in which the data is being collected, and with existing literature as a theoretical source for ideas (Bryman & Bell, 2007).
This alternative seeks to identify and provide a deeper understanding on complex topics by unraveling the puzzling elements of it, and turn it into clear knowledge for research (Bryman & Bell, 2007).
3.3 Research purpose
According to Saunders et al. (2009) there are three different types of research purposes: exploratory, descriptive, and explanatory. Exploratory research is used when there is little insight on an issue, and it is wished to have a better understanding of it by discovering new patterns, themes, or ideas related to the problem (Hair, 2015). Descriptive research “seeks present an accurate account of some phenomenon, the characteristics, in some social context, at a particular time, or the changes in those characteristics over time” (Blaikie, 2009 p. 71). Lastly, explanatory research aims to investigate a situation, with the final goal of establishing the relationships between variables (Sunders et al., 2009).
The purpose of our research is exploratory, as our aim is to shed some light on how automation software affects companies at a clerical level. It fits our objective as we are pursuing to grasp a better understanding on the effect of a new tool within a specific context, as we are curious to acknowledge what are its results. The novelty of the implementation of this software at a clerical stance, and hence the lack of research on this issue, is one of the main reasons why we chose an exploratory angle in contrast to a descriptive one.
3.4 Type of methodology
The type of methodology which is followed during the research process is defined by the nature of the collected data, and the way its analyzed. A quantitative approach is taken if the collection method relies on measuring and capturing numbers, as well as analyzing them through mathematical tools, in order to represent the characteristics of an issue (Hair, 2015). Opposite to it, a qualitative approach refers to a data collection technique that uses or produces non-numerical data (Saunders et al., 2009).
Regularly, in order to measure productivity, quantitative methodology would appear to be more suitable, however, most of the data that would be needed is sensitive information for a company, or it might not even exist any measurement of it yet. Numerically measuring productivity was therefore discarded due to resources constraints for our investigation. We then decided to take a qualitative approach, being more than suitable for
the task as it helps us probing the issue deeper, and allows us to identify factors that a more structured approach would oversee. Qualitative methods fit perfectly our purpose, as the gathered literature, instead of being used to construct hypothesis to prove like in quantitative approaches, functions as a guide for our data collection process (Hair, 2015).
3.5 Strategy: Case study
We can address our topic of study as very recent and complex one, as there is little information regarding the implementation of an automation software, which would undertake clerical tasks, in a white-collar environment. Researchers consider this strategy to fit particularly well exploratory studies that deal with complex issues and want to obtain a rich knowledge from it (Saunders et al., 2009; Ghauri & Grønhaug, 2005; Bryman & Bell, 2007). Hence, by taking this into consideration, and adding to it the fact that the factors and concepts of our research are not easily understood (as a consequence of its novelty) we decided to utilize the case study strategy which cover all the previously mentioned needs of our study. Case study strategy consists of “doing research which involves an empirical investigation of a particular contemporary phenomenon within its real life context using multiple sources of evidence” (Saunders et al., 2009, p. 145-146).
We decided to conduct a multi-case study, instead of a single one, thus comparing and analyzing the effects of the software under different contexts is of great importance as it will enable us to generalize our findings (Saunders et al., 2009). According to Yin (2013), the evidence compiled from multiple cases is regarded as being more compelling, thereby making the overall study more robust.
3.6 Time Horizon
The research will reflect an ongoing performance of the automation software in different companies. Also, we aim to describe the subjective perspective of productivity that managers have of the software, through their experience. However, we incorporated some horizontal elements to construct a comparison between productivity before and after the implementation of automation software.
3.7 Data collection: In-depth interviews
“In-depth interviewing is a qualitative research technique that involves conducting intensive individual interviews with a small number of respondents to explore their perspectives on a particular idea, program, or situation” (Boyce & Neale, 2006 p. 3). The purpose of this method is to generate new knowledge, and therefore provide a deep insight on the issue at hand (Legard, Keegan, & Ward, 2004), while examining stakeholders’ thoughts and behaviors (Boyce & Neale, 2006). The reasoning to use this method is that in order to answer our research questions, we need to get a full scope on the situation. Thus, we decided that by conducting in-depth interviews, based on Ramirez and Nembhard's (2004) white-collar dimensions of productivity (quality, quantity, cost, timeliness, autonomy) we will be able to obtain detailed information on the impact that the automation software has had in each of the analyzed cases. This method is suitable to our research questions as it will help us have a deep insight on the issue at different levels, and therefore unveil the factors behind the effects of the software in productivity through different cases and contexts.
3.7.1 Sampling
The sample method chosen for this study is purposeful sampling, which consists of seeking out participants who are considered likely to provide the researcher with rich and informative answers about the research questions under review (Morris, 2015). One employee per company will be interviewed, taking into consideration our sampling strategy, the representatives from each business are people who are or were in contact with the software implementation, and have a deep notion of its effects.
The four companies from which we collected our data from, were chosen as they are the only ones in Best Collect’s portfolio who have been using the software long enough to address the impact of it. This characteristic was regarded as relevant for our selection, insomuch as each case businesses has more experience working with automation software at a white-collar level, and hence can provide us with more rich information.
Even though our sample could be regarded as small, we believe that it represents for a wide population of the actual number of businesses that utilizes software to automate clerical tasks. The researcher team conducted a thorough search in several academic portals, and was not able to find any research regarding the aforementioned issue.
3.7.2 Primary Data
Initially, we conducted an email interview with the developer of the software Ricardo Suárez, with the intention of explaining more accurately the way the software works and how does it perform. This interview was conducted in Spanish.
For the structure of our in depth interviews we based them, as mentioned earlier, on Ramirez and Nembhard's (2004) white-collar dimensions of productivity, with the intention of comparing the data we collected to these dimensions, and thus being able to judge whether the implementation of the software has represented an increase of productivity for each case.
The interviews were carried out in a relaxed and appropriate tone. It was important for us to clarify from the beginning that the company our participants belong to, as well as their names and exact position would be treated anonymously in our work. Making this clarification was important, since it helps building trust among interviewer and interviewee. The entirety of the interviewees received, previous to the meeting, the structure of the questionnaire that we followed during the session. However, in the document that was provided to our participants, we omitted sensible questions such as “Has the number of workers been reduced after the implementation of automation software?” and “Do you consider that the the new activities that the worker are performing after the implementation are more value added to the company?”. This was done with the aim of preventing the interviewees of overthinking their answers and providing diplomatic answers, for they are likely to be bias and show only a positive side of the company, which might prevent us from obtaining relevant information. Also, the interviews were conducted via video call in Spanish as we were interacting with managers from Mexico City.
The following table summarizes the companies in which the automation software was implemented and a brief description to contextualize the answers given. It is worth mentioning that the similarity between these four enterprises is the size and internationality, all of them registered billionaire sales in the last year, and sell their products across the five continents.
Case Company description Length of the
A A company whose line of business is services and technologies regarding water, hygiene and energy.
36 minutes
B A company focused on health and wellbeing with a portfolio that ranges from food products, to household care ones.
38 minutes
C This company, just like B, covers a wide range of products from the food industry, to health care and cleaning sector.
23 minutes
D Multi National manufacturer company of cleaning supplies with operations in 72 countries and selling in more than 100 countries.
31 minutes
Table 1:Cases description.
3.7.3 Secondary Data
The secondary data which was included in our investigation, served the purpose of providing our future readers with a context of the cases used to conduct our thesis. This involved looking into the company’s websites in order to provide a description of their line of business. Secondly we revised public reports of the yearly sales in the past year, with the intention of understanding the similarity among participants.
3.8 Data analysis
The process of qualitative data analysis should not be regarded as easy, on the opposite, it should be seen as a demanding process (Saunders et al., 2009). Therefore, in this study the analysis was conducted in a structured and organized way, following the seven phases posited by Marshall & Rossman (2006): (1) organizing the data, (2) immersion in the data, (3) generating case summaries, categories and themes, (4) coding the data, (5) offering interpretations, (6) search for alternative understandings, and (7) writing the report.
The first step which was undertaken for the organization of the data, was transcribing each of the previously recorded interviews under different documents. For this action we did not translated any of the sessions. After each interview the characteristics and possible findings were discussed among the researchers, and were recorded in the same audio file as
each interview. Subsequently, these final conversations helped summarizing each interview and were transcribed its corresponding file in the form of bullet points.
Afterwards, each member of the team re-read several times each interview and proceeded to the categorization of the raw data. Since the chosen dimensions from Ramirez and Nembhard's (2004) work were used as framework for our interview, they were used as categories for our analysis. The interview was intended to cover every dimension and provide a deeper understanding of the impact of the software and the reasons behind the consequences of it. Therefore, we subjectively differentiated the most representative quotes into different tables, each one according to every dimension. Subsequently the columns were filled in with quotes that were related to each of them, and were the base for the development of our findings sections 4.1, 4.2, 4.3, 4.4, and 4.5. This task was conducted jointly, in order to increase the discussion among us with the intention of considering more points of view and achieving a wider scope of the answers provided by our interviewees.
Moreover, after finishing this classification of quotes into dimensions, we continued to analyze the data which did not fit into our initial categories. Thus, we read once again every interview and found two main patterns among our interviews. The first one was the liquidity aspect, which is further revised in our analysis section as it provides a better understanding of the relevance of this aspect regarding white-collar productivity. Secondly, we identified the quote referring to the software implementation processes and were able to construct a flow-chart of the process (see section 5.1).
Summing up what was mention in the past paragraphs, the initial dimensions taken from existing literature, served as categories for our analysis and underpinned our findings sections, as well as they helped us answering our second research question. The other found categories (liquidity, and process implementation characteristics) after revising the data, were the foundation for the given responses to our first and third research questions.
3.9 Trustworthiness of research
A thesis’ reliability refers to the extent to which the data collection methods, as well as the analysis techniques, result into consistent findings (Saunders et al., 2009). In order to achieve this reliability and prove the trustworthiness of the research, triangulation is tool,
which involves using more than one approach to conduct an investigation, and therefore enhances the confidence in the presented findings (Lewis-Beck, Bryman, & Liao, 2003).
Data triangulation was assured by having a multi-case strategy, in which we were able to compare different sources against each other, in order to come up with new statements. Moreover, a triangulation among researchers also adds reliability to our thesis, since two individuals with different perspectives, offering a wider scope and a more complementary one, constructed it.
4. Findings
The empirical data collected is summarized and presented in accordance to the purpose and research questions.
4.1 Quality
Quality is highly regarded among academics when it comes to evaluating white-collar productivity (Ramirez & Nembhard, 2004). According to what we observed in the interviews, every company experienced a positive increase in quality after the implementation of the automation software. The perceived improvement is addressed differently along the diverse cases of study, as well as the importance and impact on productivity.
This dimension of white-collar productivity was highly impacted by the implementation of automation software. To begin with, doing the tasks correctly from the first time is a clear image that processes has been structured in a way that the outcome satisfies the requirements set by the user. The software defines steps that verifies every requirement automatically allowing quality to be inherent in the outcome. These standards are established by the company that uses the automation software, so in a sense, the improvement in this dimension regarding rework on the white collar level is customized with the needs and problems that they are facing. Case A started to realize that clerical workers spent their efforts correcting, manually, tasks that did not comply with the requirements and consequently, quality was not as expected to boost productivity around the office. Manager from case A stated:
“Before we had an assertiveness percentage to reconcile the documents between 60 and 70%... This percentage of success to upload the document to the portal is approximately of 95% in the first seven days”.
Automation Software improved quality of the documents they needed to reconcile and hence productivity was affected increasing the percentage of assertiveness. On the other hand, we found that quality is strongly related with time since avoiding rework allowed this company to reduce time in process. Moreover, manager from case A explained the reasons to implement the software in the first place:
“The reasons were strategic. First, it seemed to me that part of my work is to train myself and my co-workers. I have to look for the best practice in the market and implement them in my office. This company competes in price, quality, service, technology and for me the software is a reality.”
Improving quality is a core competence in the company and the software was intended to be a solution to certain tasks in the office that lacked of this dimension. The automation software accomplished the expectations of implementation in this case. Providing his white-collar workers with this tool, enable them to be more productive as their efforts were focused on continuing the process and not verifying every step when reconciling the documents.
Another way to check if tasks have enough quality in their processes is to reduce human mistakes. In other words, having standard and automated processes, lowers the risk of variability produced by humans. Automation software was implemented in case B in order to improve communication processes that had been done manually by white-collar workers to allocate a schedule of transportation.
“We started to have problems with service because the coordination between appointments and arrivals to the client was not accurate. The communication was failing between three channels, so the offer was to mitigate all these human mistakes of communication and establish a software free of mistakes to reduce lost in service” (Case B).
The software significantly increased quality in the three channels by offering the white-collar worker to lower their responsibilities in non added activities that were demanding rework. Hence, the service performed by the clerical workers was boosted giving the client better reliable information.
“If you compare the number of appointments that were done before the implementation of the software and the index of problems we had, that was a big number, with today’s index problems it is practically null.” (Case B).
Another aspect in which an improvement in quality was perceived, is the processing of information. Case C acknowledges that with the aid of the automation software, the quality of data-analyses was increased on account of the ability of including more levels of information in the analysis. This aspect was also mentioned by Case A, in recognition that the software allowed the department to include more variables in the analysis, compared to previous data-processes before the implementation.
“What I like about the automation software is that my people would only do a crossed analysis involving one or two levels, while the software is able to work with five” (Case A).
On the other hand, Case B does not mention any difference in this area, due to the fact that the process in which the software was implemented, does not involve data-analysis making.
“This particularity about requirements from the client, inevitably when a person is typing may confuse one number for another and that is enough reason to create a rejection. When all the information is gathered from the system by the software, there is no mistakes and the level of error therefore is zero.” (Case D)
One of the biggest improvements of automation software is to allow continuity in the processes where it was implemented by increasing quality of information. Manager from case
D explains that rejections of bills because of small human mistakes was important to realize the necessity of such technology. A rejection from the client meant that the whole process had to start again to verify the error, by gathering the information from the portal and sending again the requirements to the client. However, by making the level of error zero, productivity was boosted with a continuous billing. Moreover, we can argue that by creating a zero error environment with the software, other dimensions such as cost, quantity and time are also improved and hence, productivity is not only improved around the office but affects in a positive way the service provided by the company.
4.2 Quantity
The majority of our participants did not address any direct changes in this dimension. Case C was the only one who perceived an increase in the amount of outputs produced by the automation software, with regard to the ones that were previously produced by the clerical workers.
“I use to analyze only logistics discounts, and leave the remaining payment differences to the sales department. Nowadays, I analyze everything because I have the capacity with the automation software, of analyzing 100% of the payment differences” (Case C).
However, manager from Case D experienced an increase in capacity of processing with the implementation of the software. The great amount of work was only doable for a technology that understood the requirements and followed certain steps to verify the information, and the automation software reach the satisfaction of case D. The software is capable of improving 40% of the human capacity in a specific task by gathering information faster from the portal and making certain comparison automatically.
“For example, the software has the capacity to process ten thousand documents per month for each one of our clients. Also it is custom made, each software has its own client. On the other hand, one person has the capacity to process eight hundred documents per month. So, the difference is huge.” (Case D).
All of the participants explicitly mentioned that they were not being able to manage the totality of the workload, and that their existing personnel was not enough to keep with the pace. This is related to quantity, inasmuch as the managers did not expect an increase in the originated outputs from the software implementation, since they already had an established quota to meet. Case B explains more accurately this point:
“We have not made more appointments, because in the end the sales are the same”.
This means that, whether or not, managers at their departments had an increase in the generated outputs as a direct outcome of the software implementation, their companies at least had the capacity to produce more. If before they were not able to keep up with the workload, with the aid of automatic processes, they now manage to meet the required quota.
4.3 Cost
Companies were struggling with monetary losses with the previous productivity of their workers. For instance, billing processes, where the automation software was implemented, had in some way to finance their clients because their workers did not have enough capacity to charge in a convenient period.
“We were not reconciling a lot of documents and if I do not locate which document corresponds with each outcome, is money that I do not bring to the company and is a cost that if in the long run I do not charge, it is a loss of money” (Case A).
After implementing the software, the company in case A reduced their finance period and charge to all their clients without exception in the established period. We can identify a positive impact in productivity in this dimension, since they are able to recover all the money which they are supposed to collect from the company’s operations. Productivity was also boosted by reducing training to white collar workers. In order to understand the process in the operations that the workers used to do before the software was implemented, it required an extensive training of databases and how to link the information to produce the outcome.
Now, after the implementation of the software, training is focused on only analyzing the outcome which, as said by all the interviewed managers, was fast and easy to understand.
“When we tried to charge some differences produced by human mistakes when billing a client, nobody recognized them. That at the end of the day, went to a receivables account, which would not be paid by anyone, and meant losses for the company. That lack of automation, and the human factor was reflected in monetary losses” (Case C)
We can say that cost reduction and quality are strongly related, since the current labor force was not able to provide the necessary information in order to keep the processes flowing. Replacing human decisions in ordinary but repetitive task in the office by the automation software, seems to reduce costs that represented a percentage to cover working capital.
“For instance, I was the responsible to approve the software, it seemed like a high cost because it was around five hundred dollars monthly per client plus taxes regarding Mexico’s law. However, when you compare the software’s scope and that it can work 24 hours 7 days a week, against the cost of hiring one or two persons doing exactly the same quantity of transaction in one month, the difference is huge, I am talking about 7:1 in a direct way.” (Case D).
All the companies faced a big problem of extra work in the white collar level. Employees were processing information that was out of their job description. Moreover, the non value activities they performed, in their respective areas, were hampering the realization of their main activities or the reasons they were hired in the first place. So, managers had to come up with a solution to improve productivity without making a big investment. Manager from case D made a direct study of cost-benefit to implement the automation software, the results showed that hiring white collar workers, that could fulfil the amount of work needed to be done, would result seven times more expensive than having the software around the office. In a sense, we can say that this decision is making the work done with less budget needed to pay the service.
4.4 Autonomy
A consensus was observed among the perceptions of all the managers in the matter of autonomy, as they all agreed that the employees who used to do activities that the software now operates, are today able to do multiple different tasks.
“We now do activities that indeed, add value, and indeed are activities that we are supposed to do. Even now I am able to assign other tasks to these personnel.” (Case A).
Case A also admits that clerical employees do not waste that much time analyzing the entirety of the information, and now focus alone in reviewing the information which the software was not able to conciliate. This is linked again to autonomy as the workers have significantly more time available, which can be destined to other more important activities.
“My personnel instead of wasting time with such a big part of the cake [...], is now able to focus in the 5% or 2% (of data) that the software is not able to conciliate”. (Case A).
Case B stated that not only the autonomy of the employees changed, but that also the nature of their work was also modified. The affected workers have now a more supervisory responsibility, as they are now in charge of looking after the results received from the software. The manager from this company admits:
“(Nowadays) they basically supervise what formerly was their job” (Case B).
Case D showed that the process of billing was a non value activity and thus, it had to be done in a way that efforts and resources were not decreasing productivity in the value added activities. The manager told us that since the implementation of the software, that process was working by itself and they were only getting annual reports that helped them to analyze in further instance when money is charged to the clients.
doing what they were hired for. This was an extra workload and therefore the importance of the solution that the software offered us.” (Case D).
4.5 Time
This dimension was unanimously regarded as one of the levels in which the software implementation impacted the most. All of the managers agreed that after automatizing clerical tasks through the software, the time required was significantly less, compared to what a worker use to take. The interviewed managers mentioned percentages and time measurements, that had changed and improved after the automation software started functioning. When we asked our interviewees if there were any productivity indicators implemented around the software performance, they all accepted that no quantitative monitoring or check up was given to the tasks performed by the software. However, all of them were able to point out percentages and time measurements, by which time was reduced after the automation software started functioning.
“We now process appointments 65% faster, than how we used to do it manually” (Case B).
“Nowadays, I take less than a week as I did before, submitting to revision the majority of the documents” (Case A).
Time reduction was not the only mentioned issue, regarding this section. Case D took into account the amount of time a software can operate in contrast to the working hours of the regular employee. The software’s capacity to run without interruption during both day and night, was seen as an advantage for it represents a more effective and simpler alternative to a regular employee.
“One person takes 10 minutes per operation, and works 8 hours, and has to rest, and
has a salary with an important social load. The software runs 24 hours and the only requirement is to keep the computer plugged [...]” (Case D).
Time reduction of tasks was such an important factor for some of the studied cases, that for Case B was a determining factor to decide whether to invest or not in this tool.
“The fact that now I am able to deliver on time a product [...], was what made us lean towards investing in a project of this size” (Case B).
4.6 Negative aspects of automation software
Managers from each company had experienced nonconformities using the automation software and also in the process of daily adaptation. For instance, one of the most frequent weaknesses mentioned of the software was the lack of flexibility for changes in parameters of daily operations. In other words, this technology works with certain inputs established from the beginning of the implementation, regarding clients, dates, databases, web portals and emails, so if the process requires adaptation for new or modified parameters, there is a necessity to contact Best Collect for a programmer in order to add or change those specifications. Also, this means higher costs for the companies using the software because the service provided by the specialist is not free of charge.
“One of the perspectives against the automation software is, perhaps, the adaptation regarding the process that the client follows, because if my client changes some parameter, we have to go all the way back to the programming implementation and make all the adjustments so that the software keeps working in a regular way.” (Case B).
“The product helps for the path you establish, but only for that one. That is the complicated part, is like a suit custom made, so tight that if there is a change in your body, you have to make a new one. If I want to use the automation software I have with another company, the programmer will have to establish a new set of inputs for the automation software and start from the beginning and that would represent an extra cost.” (Case A).
“I do not see big disadvantages of the software. However, I will definitely do it more flexible. I say this because every client has different inputs. Every client has their own way to provide information so with that flexibility, the adaptation would be easier for changes in standardized formats.” (Case C).
On the other hand, the software does not give a monitoring service. It works in an automated standard that only delivers the final output when it is done. So, clerical workers or managers that want to know the status of the work in process stay in an area of uncertainty. This type of information would be useful for the companies to increase their service and relationship with their clients by giving their process of the client’s requirements and therefore, a better planning of resources from both sides. Moreover, Best Collect was not able to provide the service that should come with the software in order to increase functionality of this technology.
“We need a certain kind of reporter. We do not know the status that we are at with the bills that are being processed everyday. We do not know how many are missing. There we have a dead time, where the client and me are unable to know the status of those bills. We tried to talk with Best Collect about it, but there is no answer. We ask for a week report but we are still waiting.” (Case D).
5.
Analysis
The findings are analyzed with respect to the theoretical framework. The data has been refined to stronger statements and compared to theory.
5.1. What characteristics from the implementation process, can be regarded as key-factors in future IT implementation?
The implementation of automation software affected all the levels identified by Haigh (2006) to obtain a significant change towards an automated office. The following figure shows key elements that were modified with the inclusion of the software in clerical tasks:
To begin with, workers were struggling with an overload of non added value activities. Their capacity to process data was not able to meet requirements of time and quality. Therefore, automating those processes meant a short term solution and the reduction of workload for employees. Hence, the implementation was easier to accept, as clerical workers were not against changing repetitive activities, on the contrary, they embraced the standardization of these tedious tasks.
On the other hand, the relationship with the client was wearing down because of requirements not being satisfied and trust was decreasing. Understanding the needs of the client was also important when implementing the automation software. Not only it changed the process in the office but also, the automation software integrated the process with the client who, at the end, is the responsible of paying the service. In other words, analyzing the end user is also important to understand the scope of the IT that is being managed, as it allows to integrate processes and make the information flow and thus, making the technology inherent to the daily operations.
In the organizational politics level, the implementation process focused on lowering the workload of the manual and repetitive tasks. Before, the responsibility of meeting requirements of non value added activities was of clerical workers and they were not able to fulfil the capacity needed. As a consequence, problems related with productivity arose and personnel was feeling frustrated. In order to succeed implementing the software in the office, managers presented the technology as a tool, a necessity to daily operations, so that the resistance from employees was not an obstacle. This new perspective motivates the employee to overcome their current knowledge of technology and try to link this tool to other processes making opportunities of development. Moreover, since the responsibility of those activities relies now on the manager and the IT developer, because they are in charge of implementing and verifying its performance, there is an effective understanding of the impact that non value added activities represent in the office and raises awareness of the importance of developing and sticking to current technologies as commonly solutions.
Furthermore, one of the bases of the implementation of automation software was the shared information with the client to increase the relevance of the technology. The companies interviewed, managed to integrate their main clients in the process by training them to