The relationship
of weather with
electricity prices:
A case study of Albania
BACHELOR/MASTER [Bachelor] THESIS WITHIN: Economics NUMBER OF CREDITS: 15 credits
PROGRAMME OF STUDY: International Economics
AUTHOR: Evgjenia Greku and Zhuohan Xie JÖNKÖPING June 2020
Renewable energy vulnerability to weather conditions and its
relationship with electricity prices in the Albanian Energy Market.
Bachelor Thesis in Economics
Title: The relationship of weather with electricity prices: A case study of Albania. Authors: Evgjenia Greku and Zhuohan Xie
Tutor: Anna Nordén Date: 2020-06-09
Electricity price, hydropower, renewable energy, state monopoly, day-ahead market, climate change, air temperature, rainfall, river water flow
Abstract
Electricity markets may become more sensitive to weather conditions because of higher penetration of renewable energy sources and climatic changes. Albania is 100% reliant on hydropower for its domestic energy generation, making this country compelling to investigate as it is highly sensitive to changing weather conditions. We use an ARMA-GARCH model to investigate whether weather and economic factors had a relationship with monthly hydroelectricity prices in the Albanian Energy Market in the period 2013-2018. We find that electricity price is affected by variations in weather and is not utterly robust to extreme hydrological changes. Generally, our dependent variable appears to be particularly influenced by air pressure followed by temperature and rainfall. We also perceive that there is a relationship between economic factors and hydroelectricity prices, where residual supply appears to have a significant negative relationship with our dependent variable. However, we were originally anticipating a higher dependency of electricity prices on weather conditions, due to the inflated hydro-power reliance for electricity production in the Albanian Energy Market. This effect is offset by several factors, where the state monopolized behaviour of the energy sector occupies a predominant influence on our results.
List of Abbreviations
ARCH Autoregressive Conditional Heteroscedasticity
ARMA Autoregressive and Moving Average Model
CEIC Census and Economic Information Centre
EUR Euro
EUROSTAT European Statistical System
GARCH Generalized Autoregressive Conditional Heteroscedasticity
GDP Gross Domestic Product
GWH Gigawatt hours
IEA International Energy Agency
INSTAT Albanian Institute of Statistics
KESH Albanian Power Corporation
MASL Meters Above Sea Level
MWH Megawatt hours
MB Millibar
UNECE United Nations Economic Commission for Europe VIF Variance Inflation Factors
Table of Contents
1.
Introduction ... 1
1.1 Research Problem……….2 1.2 Purpose………..32.
Background ... 4
2.1 Weather ... 52.2 Electricity Energy Market ... 5
2.3 Resource Exploitation and River Flows ... 6
2.4 The day-ahead market ... 7
3.
Literature Review ... 9
3.1 Theoretical Framework ... 9
3.2 Previous Empirical Studies ... 10
4.
Hypothesis ... 14
5.
Method ... 16
5.1 Econometric model ... 16 5.2 Variable Description ... 18 Dependent Variable ... 19 Independent Variables ... 205.3 Data analysis method ... 23
6.
Results ... 24
6.1 Statistics ... 24 6.2 Findings ... 277.
Conclusion ... 31
7.1 Discussion ... 31 7.2 Concluding Remarks ... 338.
Reference list ... 35
Figures
Figure 1: Average Level of Exploitation and River Flows of Fierza Hydropower Plant During
2018. Source: KESH, 2018 ... 6
Figure 2: Day-ahead price formation in practice. Source: Nord Pool Consulting, 201610 Figure 3: Simulated Spot Electricity Prices, 2013-2018. Source: Nord Pool, 2016. . 19
Tables
Table 1: Expected Signs of Independent Variables ... 15Table 2: Descriptive Statistics ... 26
Table 3: Correlation Matrix ... 26
Table 4: Effects of explanatory variables on the log of the average monthly electricity price, 2013-2018 ... 27
Table 5: Variance Inflation Factors ... 39
Table 6: Correlogram ... 39
Table 7: Group Unit Root Test ... 40
Table 8: Heteroskedasticity Test, ARCH Test ... 40
Table 9: First Regression Output ... 41
Table 10: Second Regression Output ... 41
Appendix
Appendix (EViews Outputs) ... 391. Introduction
______________________________________________________________________
In this chapter we present and motivate the overarching area of the thesis and explain the focus and purpose of our study.
______________________________________________________________________
In the last decade, many countries have initiated the adoption of energy from renewable resources, after careful consideration of climate change implications and scarce energy assets. In our case, Albania is characterized as “blessed” with freshwater resources and is ranked third after Italy in the European continent (Eurostat, 2019). However, being 100% dependent on water resources for electricity production, is showing extreme reliability risk towards changing weather conditions and insecure energy production forecasts (World Bank, 2016). Albania is a country with heterogeneous terrain and weather conditions, thus a dependency on hydropower for the dominant proportion of its power needs is particularly vulnerable to changes in climate. Hence, assessing the reliance of electricity prices on weather conditions, is of great importance because the utilization of renewable energy resources in the case of Albania is inevitable. We will study and carefully consider the impact of air pressure, rainfall, and temperature on hydro energy demand and supply which subsequently alternates electricity price trends. This analysis will be implemented in order to show the degree of vulnerability to weather and emphasize the crucial need for diversification of the present energy resource mix that Albania possesses.
Hydropower, which exploits river water flows in Albania as the fundamental input into electricity generation, is the leading renewable source for electricity generation globally, supplying 71% of all renewable electricity (Kumar et al., 2011). Even so, extreme weather conditions amend the annual mean and seasonality of runoff, all of which influence the availability and stability of hydroelectricity production and concurrently increase the storage value of hydropower reservoirs. In consequence, uncertainty associated with climate change poses great risks and challenges for hydropower planning and management (Hamududu et al., 2012). Notwithstanding the fact that renewable energy is associated with reduced marginal costs and consequently lower electricity prices, the consideration of weather conditions is essential, especially when investigating this type of energy market that is 100% based on renewable sources (Paraschiv et al., 2014).
Extreme events need to be considered during hydropower development to mitigate possible adverse influences, as climate change is predicted to increase the intensity and frequency of extreme weather conditions. Fundamentally, weather factors might come to play a more important role in the electricity market. Therefore, it is paramount to investigate how climate connects with electricity prices, particularly in the setting of Albania that is completely dependent on hydropower. Although electricity demand and supply may become more susceptible to changing weather conditions, the impact on electricity prices is still ambiguous and underrated.
1.1 Research Problem
Hydropower, although attractive as a low-cost, enduring, adaptable, and eco-friendly renewable energy source, it is sensitive to changes in hydrology as a result of variation in weather conditions particularly rainfall and temperature (Kumar et al., 2011). Our topic is part of a relatively young area which has emerged from the urgent need to adapt to diversified weather characteristics and electricity market conditions. Hence, our methodological approach allows us to answer two questions relevant for water resource management and Albania future strategy:
(1) What is the relationship between national hydropower electricity price and weather variations?
(2) Are hydroelectricity prices robust to extreme hydrological changes?
Bearing on mind the degree of sensitivity of electricity markets to weather circumstances due to higher penetration of renewable energy sources and climate change, we decide to support these research questions quantitatively. Accordingly, we examine whether weather conditions and economic factors had a growing influence on the average electricity prices in the Albanian Energy Market in the period of 2013-2018, and if so, to what extent. The country of choice is very appropriate since it is a great fit of dependency on renewable energy production.
1.2 Purpose
There has been a considerable amount of studies conducted over the years, with reference to the concept of renewable energy and its relationship with electricity prices. However, to our knowledge, few studies have focused on quantitative approaches on measuring whether there is a relationship or not between this powerful energy sector and weather conditions in non-member countries of the European Union, but still part of the European continent, such as Albania. In addition, most of the literature focuses on countries that have just recently started to embed renewable energy solutions to their energy market, without contemplating countries which are completely reliant on renewable energy since the beginning of the 21st century. Subsequently, our purpose is to provide additional empirical evidence that can shed light on the impingements that weather conditions can oppose to a country where the electricity energy market is entirely dependent on a form of renewable energy. We can contribute to the literature by examining the relationship of various climate and economic factors with electricity price stability, using regressions in a quantitative approach. This study has two main objectives: to observe the behaviour of spot prices in Albania using a time series econometric model that controls for the presence of seasonality and price peaks; and to identify to what magnitude renewable energy dependency connects with the fluctuations of electricity pricing using both climate and economic factors.
The study is organized as follows: Section 2 gives background information on weather circumstances and the Albanian Energy Market. Section 3 consists of the theoretical framework and a literature review on the relationship between weather and renewable energy with electricity prices. Section 4 includes the hypothesis developed for our research. In section 5, we describe the sample and the empirical model of choice. Section 6 contains the statistical results and findings from the conducted regressions. Section 7 is the conclusion; in Section 7.1, we discuss our limitations and opportunities for future research and finally in Section 7.2 we add our concluding remarks.
2. Background
______________________________________________________________________
In this chapter, context information of our paper will be introduced. It will provide an understanding of the importance this thesis compasses, supported by a detailed analysis of the Albanian climate, the energy market, and the monopolistic behaviour of this sector.
______________________________________________________________________ With a population of around 2.8 million, Albania is entirely dependent on hydropower for its electricity supply and this high reliance brings challenges because electricity production can vary from almost 6000 GWh to less than half that amount in very dry years. In this country, there is a water flow enough to fulfil the necessities of the whole population and only 1% of this reserve would be required. In other words, Albania has exploited only one third of the potential thus far, also being influenced by the fact that a fundamental production capacity is frittered away, creating a vast gap between production and demand quantity regardless of its potential scope. In consonance with Ebinger (2010), climate change will likely have an adverse effect on hydropower production and by 2050, the annual average electricity output from Albania’s large hydropower plants might be reduced by about 15%. The seasonality of Albania’s supply-demand imbalance raises the problem of a vicious cycle creation, where summer temperatures increase the demand for cooling and refrigeration but concurrently hydropower production is most constrained by reduced rainfall.
The European Commission has revealed that one of the main challenges of the Albanian energy sector is the diversification of the energy sources and the fulfilment of the needs by own country resources, decreasing the import dependence (European Commission, 2019). In addition, with European accession being one of the upfront challenges of the Albanian government, electricity producers have to participate in the European emissions trading scheme to maintain the acquis. However, this might result in the introduction of a feed-in tariff in the electricity prices of the Albanian energy market which contradicts with the hypothesis that renewable energy ensues in lower electricity prices as a consequence of decreased marginal costs. An Environmental Performance Review actualized by the United Nations Economic Commission for Europe (2015), identified that rainfall and temperature are two integral components to be discussed when considering this challenging situation. Conforming to this report, Albania will face a
reduction in annual rainfall and an increase in the number of intensive rainfall events during the year. These two aspects will both reinforce the plight of reduced availability of water, with an ensuing escalation of the instability of energy production and, eventually, a predominant reduction in electrical energy production. Likewise, the increase in the number of intensive rainfall events will not create more production capacity, but contradictorily, it will present additional structural air pressures on the dams (UNECE, 2015).
2.1 Weather
The extensive contrast between cold nights and hot days shows the unpredictable need for heating or air conditioning during different months of the year, which results in persistent necessity for electricity consumption (Meteoblue, 2019). High temperatures during the summer, however, are the cause of river and lake droughts throughout the Albanian terrain which instantaneously restrict the energy generation outputs from the primary hydropower plants. There is a mutual relationship where high temperatures increase the demand for air conditioning and refrigeration, while low temperatures in winter increase the demand for heating power. Forasmuch as the hydroelectric energy is the primary source of production and consumption, the dependency on this resource is recognized as a limitation. For this reason, we need to discover the reaction of producers against this phenomena and how elastic electricity prices are to weather changes. On the other hand, high rainfall fluctuations designate complications in forecasting the water reserves and the heavy reliance on hydro-power energy is why Albania is left in a predicament and is obligated to import energy, howbeit its tremendous potentials. 2.2 Electricity Energy Market
Albanian Electric Power Corporation (KESH) is the state-owned producer and at the same time the largest producer of electricity energy in Albania. In essence, Albania's power industry is a highly monopolized industry, with an enterprise administrative monopoly in every link of power production and transportation. The single enterprise has the absolute power to fully control the dispatching, distribution, sales and settlement of electricity (Ali, 2015). According to Helga Zogolli (2015), the Albanian market model is characterized by bilateral power contracts between market participants. The Albanian market model has a wide range of control over prices and other conditions.
Economic optimization enables KESH to secure additional income, as a consequence of the difference between the selling and the purchase price of energy, without influencing the energy reserves. This process is realized, in those cases when the system allows it, by purchasing a certain amount of energy during off-peak hours, that time when the price of energy is low, and selling it during peak hours with a higher price. The selling price of electricity in euros per MWh, has experienced a sharp decrease from 2014 to 2016, being approximately 37% less in value (KESH, 2018). Surprisingly, during 2017 and 2018 it has had an increasing trend, achieving a higher selling price than ever between these years, which is 64.06 €/MWh (KESH, 2018). As a deduction, it is interesting to study this fluctuation of electricity prices in terms of weather’s influence.
2.3 Resource Exploitation and River Flows
Being entirely dependent on hydropower, Albania relies on the river flow of Drin River for its power generation. This is the longest river in Albania and its flows form the Fierza Lake. Subsequently, the river flow from Drin to Fierza is directly connected to the water reservoir levels of the power dams that produce electricity. Despite of river flow, the level of the Fierza Lake is also an important indicator of how KESH utilizes this resource and to what levels it exploits it.
289.72 291.97 295.06 296.51 296.44 295.98 293.95 287.45 277.88 270.18 266.47 267.33 279.9 280.4 284.6 289.5 292.1 292.1 288.9 283.5 277.8 274 273.6 278.3 243 436 710 462 307 170 122 63 82 49 73 108 228 282 355 332 262 148 14 51 63 101 178 257 0 100 200 300 400 500 600 700 800 250 255 260 265 270 275 280 285 290 295 300 Ri ve r F lo w (m ³/s ec ) Lev el (m as l) Month
Fierza Level Average Fierza Level Fierza River Flow Fierza Average River Flow
Figure 1: Average Level of Exploitation and River Flows of Fierza Hydropower Plant During 2018. Source: KESH, 2018
From Figure 1 above, we can observe the average level of exploitation and river flows of Fierza Hydropower plant during 2018 compared to the average of 14 years from 2004 to 2018. Apropos of the Fierza level during 2018 we can inspect that it was higher than the average during the first eight months of the year, until August, and it started descending afterwards until December, acquiring a value of 267.33 meters above sea level compared (masl) to the 14-year average of 278.83 masl. This could be an indication, that the rainfall levels have initiated to deteriorate in 2018 compared to the 14-annual average. As a consequence, this result could potentially have a correlation with the superiorly discussed increase of the electricity price during 2018, due to less production capacities and higher marginal costs.
2.4 The day-ahead market
Nord Pool operates in Scandinavia and was the first multinational exchange for electric power to be created in the European Union (European Commission, 2016). Nord Pool is the Europe’s leading power market and has introduced the day-ahead electricity price scheme which is important for understanding how it is bid and traded in the energy sector. From 2016, Nord Pool has been considering its extension to other regions where hydro power poses abundant potentials. For the purposes of expanding their market they have conducted research on Albania’s current energy market situation and have calculated the electricity simulation prices for this country from 2013 to 2018, collaborating approximations with other similar countries such as Hungary and Greece (Nord Pool, 2016). Nord Pool is closely linked to our study because it is developed in countries that produce their electricity predominantly from water resources and it provides us with a guideline on how to analyze the hydro power sector. During the study of the Albanian power market Nord Pool suggests that Albania can take advantage of its location and unique hydro power assets and should use the opportunity to take lead position in the development of the regional power market. By developing a day-ahead market, the Albanian power sector will unlock the value of its flexible hydro power plants and ensure an appropriate market design. Hydropower is the second with the lowest marginal costs after the group of newly introduced renewable energy sources; solar power, wind power and biomass (Nord Pool, 2016).
Energy producers use different approaches to hydropower scheduling, explaining the tendency to prefer to produce when the water value is lower than the day-ahead price. On the other hand, they would prefer to save water when the day-ahead price is lower than water value (Kristiansen, 2012). Consumers can choose a decision that suits their own consumption level according to their own characteristics and can ultimately save energy, ergo, this is the basic principle of Nord Pool trading (Malik et al., 2006). In the process of bidding pricing, the product price is determined by the marginal cost of the product and the highest bid price of the unit that successfully wins the bid at each time point, so the price is constantly changing (Nielsen et al., 2011). Predominantly, water is a resource that can be recycled continuously which alternatively suggests that the amount of electricity generated in the future is equal to the estimated opportunity cost of water (Faria et al., 2011). Low reservoir water levels increase opportunity costs, thus increase the marginal costs and the antithesis occurs for high reservoir hydro levels.
3. Literature Review
______________________________________________________________________
The purpose of this chapter is to provide the theoretical framework for our research topic and to give an insight on prior studies conducted that are relevant to our selected subject.
3.1 Theoretical Framework
From the introduction of our information and background facts regarding the current situation of the Albanian Energy Market and climate change predictions from experts, we believe that observing how weather factors and economic circumstances affect the shifting of the market is of great importance.
Figure 2 below, reflects the day-ahead price formation in the Energy Market and is composed of various factors that affect supply and demand, respectively. In principle, factors affecting supply for electricity vary from total costs of production, weather, hydro situation, and CO2 emission allowances. These determinants are closely intertwined with what our analysis should include to explain the variation of electricity prices. To illustrate, if variable costs of production increase, the supply curve is expected to shift to the left as production becomes less profitable. Recursively, producers are obligated to increase the electricity price, in order to compensate for the profit loss due to the increased production costs. On the other hand, demand is additionally persuaded by retail volumes and delivery obligations. In terms of energy trading, Macedonia, Montenegro, and other surrounding countries have expressed interest in the Albanian market, even though some of them have already established power exchanges (Nord Pool Consulting, 2016). Therefore, if Albania pursues a competitive market instead the supply curve will shift to the right, resulting in a higher turnover where the market price remains unchanged.
The following figure also entails that if the water flow increases or the sun shines, the supply curve moves to the right as this form of electricity generation is characterized by very low marginal costs. An increase in temperature is accompanied with a shift of the demand curve to the right, due to elevated need for cooling or refrigeration. Likewise, a decrease in temperature is accompanied with a movement of the demand curve to the right, due to elevated need for heating. Rainfall on the other hand, moves the supply curve to the right, as higher river flows bring about higher exploitation of the water resources
and decrease the market price. However, the economic interpretation of this weather factor is not enough when assessing the shifts of supply and demand because there are various external factors that oppose this effect (see more in section 4).
These statements are conceptualized on the grounds of the Law of Supply and Demand (Marshall, 1890) and by result, the electricity price may become more directly connected to weather conditions (Murder, et al., 2013). The elasticity to electricity prices is dependent to the shape of both the supply and demand curve, hence the flatter these curves, the smaller the price effect of changes in supply and demand and the higher the price elasticity.
Figure 2: Day-ahead price formation in practice. Source: Nord Pool Consulting, 2016
3.2 Previous Empirical Studies
We place our paper in the context of several literature streams: the economic impact of renewable energy, the power of weather on forecasting electricity prices, the dynamics of hydroelectric power generation on the electricity prices and different models that seek to explain electricity price setting. Some studies focus on renewable energy as the main driver of electricity price fluctuations, some others emphasize the impact of weather on the latter, and the rest try to detect the concurrent relationship amongst the three variables. Firstly, the theoretical results that sustainable energy policies lead to lower energy prices have been ingrained by Sensfuss et al. (2008) and Linares et al. (2008) who provide intuitiveness from simulation studies. Conjointly, Johnsson et al. (2010), and Gelabert et al. (2011) have examined the impact of renewables on wholesale electricity prices and
Market Price Volume MWh Price EUR/MWh Turnover Factors affecting the
supply for electricity: Fixed costs of production Variable costs of production CO₂ allowance prices Weather Hydro situation
Factors affecting the demand for electricity: Retail volumes and delivery obligations: 1. Weather 2. Open deliveries Industrial consumers: 1. Fixed costs 2. Variable costs 3. Startup and shutdown costs 4. Flexibility of processes SU PPL Y DEM AN D
provide empirical proof for the claim. For instance, Gelabert et al. (2011) examine the Spanish market between 2005 and 2009 and report that a marginal increase of 1 GWh of renewable electricity production and cogeneration yields a 4% decline in electricity prices. Empirical support for this claim is relatively scarce possibly due to lack of data as it takes a long time before policies result in a large enough share of sustainable energy to observe this effect in market prices.
While a few studies have recognized the need for modelling weather directly, these mainly addressed the weather effect on electricity sales. Moral-Carcedo and Vicens-Otero (2005) study temperature effects on the variability of daily electricity demand in Spain and document a nonlinear relationship between variations in temperature and the demand response. For this reason, we believe that the inclusion of factors that affect demand and supply as two of our economic independent variables is viable to explain the variation of our dependent variable, electricity price. The importance of including these economic factors in our model is also underlined by the study from Cartea and Figueroa (2005), where they find that storing electricity is hard and expensive, which justifies electricity price’s sensitivity to unexpected signs in supply or demand (Janczura et al., 2013). More attention to the relationship between prices and weather is given by Knittel and Roberts (2005) who compare price models that incorporate seasonal and temperature variables with models that do not include these variables on hour-ahead electricity prices obtained from the Californian market, and provide preliminary evidence that the former models significantly outperform in terms of forecast accuracy. This estimation also emphasizes the importance of weather variables for determining electricity prices.
In general, having reviewed the priorly disclosed studies we discovered that weather factors are momentous in the establishment of electricity prices as they affect demand and supply. To illustrate this, through demand, lower temperatures trigger a higher consumption of electricity and vice versa. Therefore, higher temperatures imply lower heating requirements, which translates into lower prices. Yet, higher temperatures might also signify a higher consumption of electricity due to an increased demand for cooling. This implies, that we should be careful to assess this contradictory relationship between weather and demand for electricity. Hence, addressing weather variables that directly reflect the electricity supply and demand is preferred. However, when considering the
economic perspective, other studies emphasize that the economic development level of a country is also an essential factor when studying the relationship with electricity prices. In particular Jamil and Ahmad (2010), analyze the relationship between electricity prices and GDP in Pakistan where they find that electricity price will rise as a result of economic growth. They emphasize that future targets and planning for electricity production need to be synchronized with overall economic planning for GDP and sectoral growth. Huurman et al. (2010), suggest that weather forecasts can price the weather premium on electricity prices. Their empirical results propose that weather forecasts play a central role in forecasting day-ahead prices. They also find that the relation between electricity prices and weather forecasts is highly nonlinear and depends on the price drivers associated both with the demand and with the supply side behind each bidding area. However, there are some limitations in this study, because as they themselves point out they lack other plausible weather-related variables, such as water reservoir levels. Similarly, Huisman et al. (2013) show that higher reservoir levels, more hydro capacity, lead to significant lower power prices. From this study they conclude that a reduction of power prices occurs due to the decreased marginal costs from renewable energy.
These studies also underline the importance of considering different weather conditions (not only temperature and rainfall) when assessing the hydro energy sector. However, since water reservoir levels data are not available, it is important to find a proxy variable that can represent the river flow levels. Chanson and Hubert (2004) explain the concept of open channel flows, which in our case are river flows. They describe that the river flow is determined by atmospheric air pressure at the flow free surface. The Bernoulli’s Principle, confirms the validity of this statement and illustrates that there is an opposite relationship between air pressure and river flows (Bernoulli, 1738). Hence, they provide evidence that air pressure is essential when forecasting river flows and is a variable that can showcase the relationship between weather conditions and electricity prices. Ergo, we affirm that three weather conditions; temperature, rainfall, and air pressure, determine straightforwardly renewable energy capacity, demand, and production, which in effect influences the electricity prices.
Distinctively from the other studies, Mosquera-López et al. (2018) use an event study approach, to explicitly identify the shock in the Nord Pool market and quantify the economic importance of expanding the interconnected market and the inclusion of more renewable sources in the generation mix of the system to smooth out price spikes. They find that when a freezing event occurs, the average electricity prices increase and that the negative relationship between temperature and prices also increases. However, they observe that these changes are more pronounced in countries that are most dependent on hydropower generation, which confirms that Albania is a well-suited choice when wanting to evaluate the relationship between weather conditions and hydroelectricity prices.
Encapsulating all the research studies listed above it is noticeable that some of the conclusions are analogous to one another. We can infer that using log transformations of the monthly electricity prices will be our selected method, on the grounds that the majority of the studies have followed this approach justifying it is the most adequate process to use in the case of nonlinearity between the variables and allows for the coefficients to be read as elasticities. In addition, we observe that the GARCH model is commonly used throughout the majority of previous literature on the field of electricity price modeling and forecasting. GARCH-variety models adept at modeling electricity price volatility, which is characterized by clusters of non-constant variance.
Moreover, we summarize that there are contradictory judgements when it comes to the relationship of renewable electricity production on electricity prices. Some of the studies ascertain that renewable energy introduction yields in a decline of electricity prices due to a reduction of the marginal costs. Per contra, other studies find that the imposition of renewable energies causes an increase in the final price consumers pay due to the introduction of the feed-in tariff (Paraschiv, et al. 2014). Eminently, it is proven that weather forecasts play a principal role in predictions of day-ahead electricity prices and if an extreme temperature level occurs this results in an increase of the negative relationship between temperatures and prices.
4. Hypothesis
______________________________________________________________________
In this section we introduce the tentative statement of our anticipated relationship between the investigated explanatory variables and electricity price.
______________________________________________________________________ Our hypothesis initially constitutes of the fact that weather conditions, such as temperature, rainfall and air pressure are three imperative factors that influence the electricity prices negatively or positively according to the circumstances. Hence, in the case of very high temperatures we expect river droughts and natural sedimentation to negatively persuade the river flows and production levels, resulting in an increased price of electricity. In other words, because the production procedure becomes more expensive there is a need to increase the selling price of electricity to overcome the additional costs incurred. Additionally, in the situation of high amount of rainfall levels we anticipate two opposite perspectives of the spectrum. On one hand, we expect river flows and production levels to elevate simultaneously, having a negative outcome on the electricity prices, by decreasing them. On the other hand, we anticipate that intensified rainfall levels will promote the extra release of high overflow which will result in revenue loss of hydropower producers, and hence increase electricity prices (Yin et al., 2018).
When considering the air pressure variable, we base our hypothesis on the grounds of the Bernoulli Principle. From this principle, we extrapolate that air pressure will have a positive effect on electricity prices, considering that an increase of air pressure results in a decrease of river flows, which recursively reduces electricity production (Bernoulli, 1738). Likewise, we presume that there also some economic factors such as: residual supply, residual demand, and real GDP that influence supply and demand, which recursively affect the level of electricity prices. Thus, an increase in demand, should potentially signify an increase of the electricity price and the contrasting effect is foreseen to be observed with the residual supply variable. To clarify, residual supply is inversely proportional to electricity price. In our hypothesis, we anticipate residual supply to decrease hydroelectricity price because the highest the residual supply, the smaller the KESH’s market power. Because competition in the Albanian energy sector is almost negligible and market power exchange is not well-established yet, the residual supply is low. This indicates that KESH possesses the supreme market power and its ability to
determine prices is substantially high. Real GDP, which represents the general economic development level of Albania, is also presumed to have a moderate positive effect on electricity prices, because electricity price and GDP growth move at the same direction. In terms of the climate factors, electricity prices will show higher volatility if they become more sensitive to weather conditions. During favorable weather conditions, high levels of production from water reservoirs may press the electricity price close to zero, while during less favorable conditions, prices might surge to levels reflecting supply scarcity. So, to summarize, we foresee that electricity prices are affected by the seasonality impact of varying weather circumstances and the economic impact of demand and supply in the following way:
𝐻𝐻0: 𝑁𝑁𝑁𝑁 𝑅𝑅𝑅𝑅𝑅𝑅𝑅𝑅𝑅𝑅𝑅𝑅𝑁𝑁𝑅𝑅𝑅𝑅ℎ𝑅𝑅𝑖𝑖 𝑏𝑏𝑅𝑅𝑅𝑅𝑏𝑏𝑅𝑅𝑅𝑅𝑅𝑅 𝑐𝑐𝑅𝑅𝑅𝑅𝑐𝑐𝑅𝑅𝑅𝑅𝑅𝑅 𝑓𝑓𝑅𝑅𝑐𝑐𝑅𝑅𝑁𝑁𝑓𝑓𝑅𝑅 𝑅𝑅𝑅𝑅𝑎𝑎 𝑅𝑅𝑅𝑅𝑅𝑅𝑐𝑐𝑅𝑅𝑓𝑓𝑅𝑅𝑐𝑐𝑅𝑅𝑅𝑅𝑒𝑒 𝑖𝑖𝑓𝑓𝑅𝑅𝑐𝑐𝑅𝑅
𝐻𝐻1: 𝑅𝑅𝑅𝑅𝑅𝑅𝑅𝑅𝑅𝑅𝑅𝑅𝑁𝑁𝑅𝑅𝑅𝑅ℎ𝑅𝑅𝑖𝑖 𝑏𝑏𝑅𝑅𝑅𝑅𝑏𝑏𝑅𝑅𝑅𝑅𝑅𝑅 𝑐𝑐𝑅𝑅𝑅𝑅𝑐𝑐𝑅𝑅𝑅𝑅𝑅𝑅 𝑓𝑓𝑅𝑅𝑐𝑐𝑅𝑅𝑁𝑁𝑓𝑓𝑅𝑅 𝑅𝑅𝑅𝑅𝑎𝑎 𝑅𝑅𝑅𝑅𝑅𝑅𝑐𝑐𝑅𝑅𝑓𝑓𝑅𝑅𝑐𝑐𝑅𝑅𝑅𝑅𝑒𝑒 𝑖𝑖𝑓𝑓𝑅𝑅𝑐𝑐𝑅𝑅
𝐻𝐻0: 𝑁𝑁𝑁𝑁 𝑅𝑅𝑅𝑅𝑅𝑅𝑅𝑅𝑅𝑅𝑅𝑅𝑁𝑁𝑅𝑅𝑅𝑅ℎ𝑅𝑅𝑖𝑖 𝑏𝑏𝑅𝑅𝑅𝑅𝑏𝑏𝑅𝑅𝑅𝑅𝑅𝑅 𝑅𝑅𝑐𝑐𝑁𝑁𝑅𝑅𝑁𝑁𝑐𝑐𝑅𝑅𝑐𝑐 𝑓𝑓𝑅𝑅𝑐𝑐𝑅𝑅𝑁𝑁𝑓𝑓𝑅𝑅 𝑅𝑅𝑅𝑅𝑎𝑎 𝑅𝑅𝑅𝑅𝑅𝑅𝑐𝑐𝑅𝑅𝑓𝑓𝑅𝑅𝑐𝑐𝑅𝑅𝑅𝑅𝑒𝑒 𝑖𝑖𝑓𝑓𝑅𝑅𝑐𝑐𝑅𝑅
𝐻𝐻1: 𝑅𝑅𝑅𝑅𝑅𝑅𝑅𝑅𝑅𝑅𝑅𝑅𝑁𝑁𝑅𝑅𝑅𝑅ℎ𝑅𝑅𝑖𝑖 𝑏𝑏𝑅𝑅𝑅𝑅𝑏𝑏𝑅𝑅𝑅𝑅𝑅𝑅 𝑅𝑅𝑐𝑐𝑁𝑁𝑅𝑅𝑁𝑁𝑐𝑐𝑅𝑅𝑐𝑐 𝑓𝑓𝑅𝑅𝑐𝑐𝑅𝑅𝑁𝑁𝑓𝑓𝑅𝑅 𝑅𝑅𝑅𝑅𝑎𝑎 𝑅𝑅𝑅𝑅𝑅𝑅𝑐𝑐𝑅𝑅𝑓𝑓𝑅𝑅𝑐𝑐𝑅𝑅𝑅𝑅𝑒𝑒 𝑖𝑖𝑓𝑓𝑅𝑅𝑐𝑐𝑅𝑅
Table 1: Expected Signs of Independent Variables
Independent Variable Variable symbol Expected Sign
Temperature TEMP +
Rainfall RL +/-*
Air pressure PRE +
Residual supply RS -
Residual Demand ED +
Real GDP RGDP +
5. Method
_____________________________________________________________________
In this chapter, we mainly discuss the econometric model used for answering our research question. This section also presents the data collection method and categorically evaluates each constituting variable.
______________________________________________________________________ 5.1 Econometric model
This study examines the behavior of electricity prices in Albania by considering the market’s characteristics of seasonality, high volatility, and peaks in prices following Janzura et al., (2010). In order to estimate the impact of specific factors on prices, we need to control for factors which alter the movements of the demand and the supply curve (Davis and Garcés, 2010). To this extent, we also include major factors playing a role in setting the monthly simulated spot electricity price in the Albanian market (EP). Model
(1) gives the reduced-form equation. Our econometric model is based on a similar
empirical analysis conducted by Mulder et al. (2013) in the Dutch electricity market. However, it has been adjusted to the current energy conditions of the Albanian market because there are many distinctions with regard to market competition, type of renewable energy generation and data availability.
Electricity price is the dependent variable in our econometric model. In our analysis we include both economic and climate factors, which represent our explanatory variables. The main economic factors affecting the electricity price are electricityresidual demand, electricity residual supply, and real GDP growth. The main climate factors which are taken into account are air pressure, rainfall level and temperature. We estimate the model in logs as the impact of explanatory variables on the electricity prices is likely to be non-linear (Bessec et al., 2008). It is important to note that the temperature variable, is also possible to be expressed in logs as its value is rarely negative on average in Albania during the year. However, the control variable Real GDP cannot be indicated by log since it has carried negative values throughout many months of our data set. As such, we get the following equation:
𝐿𝐿𝐿𝐿𝐿𝐿𝐿𝐿𝐿𝐿𝑡𝑡 = 𝛼𝛼0 + 𝛼𝛼1𝐿𝐿𝐿𝐿𝐿𝐿𝐿𝐿𝑅𝑅𝐿𝐿𝑡𝑡+ 𝛼𝛼2𝐿𝐿𝐿𝐿𝐿𝐿𝑅𝑅𝐿𝐿𝑡𝑡+ 𝛼𝛼3𝐿𝐿𝐿𝐿𝐿𝐿𝐿𝐿𝐿𝐿𝐿𝐿𝐿𝐿𝑡𝑡+ 𝛼𝛼4𝐿𝐿𝐿𝐿𝐿𝐿𝐿𝐿𝐿𝐿𝑡𝑡+
𝛼𝛼5𝐿𝐿𝐿𝐿𝐿𝐿𝑅𝑅𝐿𝐿𝑡𝑡+ 𝛼𝛼6𝑅𝑅𝐿𝐿𝐿𝐿𝐿𝐿𝑡𝑡+ 𝜀𝜀𝑡𝑡 , where: (1)
LOG is the logarithm of the variables; t refers to every month from January 2013 to December 2018; 𝛼𝛼0 is the intercept of the regression equation; 𝛼𝛼𝑖𝑖, 𝑅𝑅 = 1,2, … ,6 represents
the impact of each variable on log electricity price; 𝜀𝜀𝑡𝑡 is the error term of the regression
equation.
Considering that the sequence is a time series, there may be autocorrelation problems, so we observe the autocorrelation and partial autocorrelation graphs of the interpreted variable sequence LOGEP. We find that the adjoint probability of the Q-statistic is less than 0.05 (see Table 5) and conclude that there is autocorrelation in the sequence. Hence, we consider applying an ARMA model by adding two autoregressive terms and one moving average term. Their addition manifests significant coefficients, increases the coefficient of determination and shrinks autocorrelation. Consequently, our improved model now is represented as:
𝐿𝐿𝐿𝐿𝐿𝐿𝐿𝐿𝐿𝐿𝑡𝑡 = 𝛼𝛼0 + 𝛼𝛼1𝐿𝐿𝐿𝐿𝐿𝐿𝐿𝐿𝑅𝑅𝐿𝐿𝑡𝑡+ 𝛼𝛼2𝐿𝐿𝐿𝐿𝐿𝐿𝑅𝑅𝐿𝐿𝑡𝑡+ 𝛼𝛼3𝐿𝐿𝐿𝐿𝐿𝐿𝐿𝐿𝐿𝐿𝐿𝐿𝐿𝐿𝑡𝑡+ 𝛼𝛼4𝐿𝐿𝐿𝐿𝐿𝐿𝐿𝐿𝐿𝐿𝑡𝑡+
𝛼𝛼5𝐿𝐿𝐿𝐿𝐿𝐿𝑅𝑅𝐿𝐿𝑡𝑡+ 𝛼𝛼6𝑅𝑅𝐿𝐿𝐿𝐿𝐿𝐿𝑡𝑡+ 𝜑𝜑1𝐿𝐿𝐿𝐿𝐿𝐿𝐿𝐿𝐿𝐿𝑡𝑡−1+ 𝜑𝜑2𝐿𝐿𝐿𝐿𝐿𝐿𝐿𝐿𝐿𝐿𝑡𝑡−2+ 𝜀𝜀𝑡𝑡+ 𝜃𝜃1𝜀𝜀𝑡𝑡−1, where: (2)
𝐿𝐿𝐿𝐿𝐿𝐿𝐿𝐿𝐿𝐿𝑡𝑡−1, 𝐿𝐿𝐿𝐿𝐿𝐿𝐿𝐿𝐿𝐿𝑡𝑡−2 is a dependent variable as time lag t-1,t-2; 𝜑𝜑1 and 𝜑𝜑2 represent
the autoregressive coefficient of 𝐿𝐿𝐿𝐿𝐿𝐿𝐿𝐿𝐿𝐿𝑡𝑡−1 and 𝐿𝐿𝐿𝐿𝐿𝐿𝐿𝐿𝐿𝐿𝑡𝑡−2; 𝜀𝜀𝑡𝑡−1 means the error term of
the influence of unexplained variables in the model; 𝜃𝜃1 is the estimated coefficient of the
error term of the influence of unexplained variables.
After performing a correlation test on the square of the residual sequence we conclude that autocorrelation is present in the first four lags of our model. Because the time series ARMA model only considers the historical electricity price data and ignores other factors that affect electricity prices, such as load, weather or congestion, there are certain limitations (Hu and Peng, 2008). Therefore, we elucidate the market’s characteristics of seasonality, high volatility, and peaks in prices by introducing an ARCH – LM model. ARMA-GARCH models assume homoscedasticity and the preliminary data analysis has disclosed that the electricity prices exhibit volatility clustering. We extend the previous model by assuming a time-varying conditional variance for the noise term. The
heteroscedasticity is modelled by a Generalized Autoregressive Conditional Heteroscedastic GARCH(p, q) model (Bollerslev, 1986). Relaxing the assumption of homoscedasticity may change the parameter estimates of the ARMA models. Furthermore, GARCH models better capture changes in the conditional volatility of electricity market prices (Hadsell, et al. 2007). Therefore, our final model is the following:
𝐿𝐿𝐿𝐿𝐿𝐿𝐿𝐿𝐿𝐿𝑡𝑡 = 𝛼𝛼0 + 𝛼𝛼1𝐿𝐿𝐿𝐿𝐿𝐿𝐿𝐿𝑅𝑅𝐿𝐿𝑡𝑡+ 𝛼𝛼2𝐿𝐿𝐿𝐿𝐿𝐿𝑅𝑅𝐿𝐿𝑡𝑡+ 𝛼𝛼3𝐿𝐿𝐿𝐿𝐿𝐿𝐿𝐿𝐿𝐿𝐿𝐿𝐿𝐿𝑡𝑡+ 𝛼𝛼4𝐿𝐿𝐿𝐿𝐿𝐿𝐿𝐿𝐿𝐿𝑡𝑡+
𝛼𝛼5𝐿𝐿𝐿𝐿𝐿𝐿𝑅𝑅𝐿𝐿𝑡𝑡+ 𝛼𝛼6𝑅𝑅𝐿𝐿𝐿𝐿𝐿𝐿𝑡𝑡+ 𝜑𝜑1𝐿𝐿𝐿𝐿𝐿𝐿𝐿𝐿𝐿𝐿𝑡𝑡−1+ 𝜑𝜑2𝐿𝐿𝐿𝐿𝐿𝐿𝐿𝐿𝐿𝐿𝑡𝑡−2+ 𝜀𝜀𝑡𝑡+ 𝜃𝜃1𝜀𝜀𝑡𝑡−1+ ρ𝜎𝜎𝑡𝑡 (3)
Where the GARCH effect is calculated as:
𝜎𝜎𝑡𝑡2 = 𝜔𝜔 + 𝛽𝛽1𝜀𝜀𝑡𝑡−12 + 𝛾𝛾1𝜎𝜎𝑡𝑡−12 + 𝛾𝛾2𝜎𝜎𝑡𝑡−22 , where: (4)
We added the standard deviation term of the variance of the residuals to the mean reversion equation of equation (3), where 𝜌𝜌 represents estimated coefficient for standard deviation . In the variance equation of equation (4), 𝜎𝜎𝑡𝑡2 represents the residual variance of
the current period; 𝜔𝜔 is the intercept of variance equation; 𝜀𝜀𝑡𝑡−12 represents the square of
the residual for the first time lag; 𝛽𝛽1 is the coefficient of the square of the residual for the
first time lag; 𝛾𝛾1and 𝛾𝛾2 represent the coefficient for the residual variance of the first and
second time lag.
5.2 Variable Description
The main tool of data collection was gathering secondary data from different meteorological databases (World Weather Online), the Albanian Statistical Institute (INSTAT), KESH’s online performance reports and CEIC Data’s Global Database. In order to better estimate the model, we include climate and economic factors in our raw dataset. The main climate factors which are considered are air pressure, rainfall level and temperature. The economic factors that we account for are residual demand, residual supply, and real GDP growth. Some of the material collected from KESH was in Albanian and consequently we have translated this information into English for better analysis and understanding. Furthermore, all price series are given or converted to EUR. Transforming all prices to a common currency could induce dependencies related to exchange rate fluctuations and not energy price fluctuations (Hovanov et al., 2004).
Dependent Variable
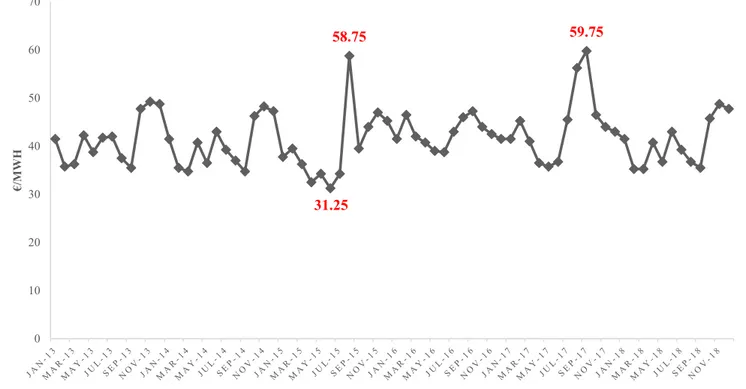
Our dependent variable is the simulated spot electricity price for the Albanian Energy Market. This data is extracted from a Nord Pool report on the Albanian Energy market potentials (Nord Pool Consulting, 2016). The unit of this variable is €/Megawatt hours (€/MWh). This data set was available on a weekly frequency but in the interest of having comparable statistics with all the other variables we appraise the average of the four weeks for approximating the monthly values from 2013 to 2018. The following argument is also in favor of the monthly data set frequency. If we were to use micro data instead, we would result with a trivial price adaptation to demand which stems from the inelastic nature of electricity load in the short run (Blochlinger, 2008). Predominantly, the electricity price variation has not been exceeding a certain range of (30-50 €/MWh). During August 2015 and 2017 we observe two peaks of electricity prices, reaching a value of 58.75 €/MWh and 59.75 €/MWh, respectively. Similarly, the lowest value registered during this interval of years was in June 2015 with a price of 31.25 €/MWh. Figure 3, displays the monthly simulated electricity prices for Albania from 2013-2018.
31.25 58.75 59.75 0 10 20 30 40 50 60 70 €/M WH MONTH
Independent Variables Climate Independent Variables:
Temperature
Temperature is one of the most crucial variables in our study, because the change in temperature can affect water energy capacities in electricity production in the opposite direction. The unit of this variable is degrees Celsius (°C). We have chosen to take into consideration the average monthly temperatures from 2013 to 2018 in the city of Tirana, derived from World Weather Online ( https://www.worldweatheronline.com/tirana-weather-history/tirane/al.aspx). The reason for choosing this city is because it is located in central Albania and it possesses the average value of temperatures in the Albanian territory. If we were to consider other cities from the south which are warmer, or northern cities which are colder, the result would have been biased and not consistent. What can be noticed from our data set, is that the average temperatures have generally been stable during the years. From May to September the Albanian territory registers the highest average temperatures of the year. We also derive that 2017 has recorded the lowest temperatures during the winter compared to the six-year interval we are studying. Rainfall
We have chosen to take into consideration the average rainfall levels from 2013 to 2018 in the city of Tirana, derived from World Weather Online (https://www.worldweatheronline.com/tirana-weather-history/tirane/al.aspx). The unit of this variable is millimeters (mm). In years with heavy rainfall, the installed capabilities of hydropower changes between 6000 GWh, while in years with little rainfall, the installed capabilities of hydropower drop significantly. These facts provided by the International Energy Agency have proven a positive correlation between precipitation level and hydropower-led electricity production. Rainfall fluctuations over time make forecasting water reserves very complex and Albania has to import energy due to its over-reliance on hydropower. The average rainfall level has considerably increased during the last years, carrying a positive increasing trend. The month of November acquires the highest average rainfall level throughout the examined years.
Air pressure
Because the Albanian energy production is entirely based on hydropower production, we believe that accounting for a weather condition that directly affects river water flow is noteworthy. We cannot include the river water flow variable in the model since it is highly correlated with the rainfall level variable. Hence, we include air pressure which - according to the Bernoulli’s Principle - decreases if the water flow is higher and vice versa. We obtain the average monthly air pressure for Tirana from World Weather Online as well (https://www.worldweatheronline.com/tirana-weather-history/tirane/al.aspx). The unit of this variable is millibars (mb). Air pressure is highly volatile during the months of the year and no particular trend can be observed.
Economic Independent Variables: Real GDP
As priorly mentioned during our literature review, the economic development level of a country is one of the factors that affects the movement of the supply and demand curve, and therefore influences the price level of electricity. We use the value of goods and services adjusted for inflation, reflected by the real gross domestic product. The data for real GDP is extracted by the CEIC database (https://www.ceicdata.com/en/indicator/albania/real-gdp-growth).
Residual Demand
Residual demand reflects the tightness of the market. This is an influential factor because it captures the contrast between the demand for electricity, which is highly volatile, and generation capacity that features inflexibility in the short run. The ability to respond to marginal demand increases is weakened when more capacity is exploited. We measure this effect by the monthly average level of the residual demand, which is the demand excluding the demand met by decentralized generation. The unit of this variable is Megawatt hours (MWh). The balance of electricity from 2013-2018 was collected from INSTAT (http://www.instat.gov.al/en/themes/environment-and-energy/energy/#tab2), including net domestic production, gross imports, gross exports and consumption of electricity by domestic users, all in monthly scale. INSTAT reports calculate the available energy by summing net domestic production with gross imports and subtracting gross
exports. We use available energy as a proxy for residual demand and therefore compute it as the aggregated production of the domestically centralized generators plus imports minus exports. In the period under review, the residual demand in Albania is characterized by a relatively constant variance in general. However, we notice that the production has seen a considerable fluctuation between the years but has been offset by equivalent adjustments in the level of imports. Thus, the residual demand is calculated as follows:
𝑅𝑅𝑅𝑅𝑅𝑅𝑅𝑅𝑎𝑎𝑅𝑅𝑅𝑅𝑅𝑅 𝐿𝐿𝑅𝑅𝑐𝑐𝑅𝑅𝑅𝑅𝑎𝑎𝑡𝑡= (𝐿𝐿𝑁𝑁𝑐𝑐𝑅𝑅𝑅𝑅𝑅𝑅𝑅𝑅𝑐𝑐 𝐿𝐿𝑓𝑓𝑁𝑁𝑎𝑎𝑅𝑅𝑐𝑐𝑅𝑅𝑅𝑅𝑁𝑁𝑅𝑅𝑡𝑡+ 𝐼𝐼𝑐𝑐𝑖𝑖𝑁𝑁𝑓𝑓𝑅𝑅𝑅𝑅𝑡𝑡) − 𝐿𝐿𝐸𝐸𝑖𝑖𝑁𝑁𝑓𝑓𝑅𝑅𝑅𝑅𝑡𝑡 (5)
Residual supply
Sheffrin (2002) proposed a calculation for the Residual Supply and implemented it for the Californian electricity market. The residual supply variable reflects the aggregate supply capacity that remains in the hydropower sector after subtracting the dam’s generation capacity. The additional power that the residual supply has, is that it monitors the market power of the public supplier in Albania (KESH) in relation to the total hydro power supply. We extract this data from KESH performance reports (http://online.anyflip.com/ztfc/ndop/mobile/index.html). The unit of this variable is Megawatt hours (MWh).The higher the Residual Supply, the less market power the energy sector is supposed to have. We deduce that the market power in Albania is highly established and shows an increasing pattern, which is displayed by the low calculated Residual Supply (KESH, 2018).We use the following equation to measure the residual supply:
𝑅𝑅𝑅𝑅𝑅𝑅𝑅𝑅𝑎𝑎𝑅𝑅𝑅𝑅𝑅𝑅 𝐿𝐿𝑅𝑅𝑖𝑖𝑖𝑖𝑅𝑅𝑒𝑒𝑡𝑡=
5.3 Data analysis method
The ARMA and GARCH model have been widely used in modeling relationships between electricity price and renewable energy by many scholars. The premise of the application of these methods is that the time series are based on a stationary sequence (Hu and Peng, 2008). The power market reform, however, is not perfect. This indicates that market rules and market structure are constantly changing and the factors affecting electricity prices are also very diversified. By result, electricity price series generally exhibit strong volatility, more price spikes, and abnormal jumps.
Furthermore, electricity price fluctuations also have obvious volatility clustering, meaning fluctuations or small fluctuations in electricity prices occurring one after another. This aggregation effect of electricity prices makes it difficult for traditional time series models to effectively describe the aforementioned changes in electricity prices (Hu and Wang, 2007). As a result, the ARMA-GARCH model is a powerful tool that adapts to the characteristics of electricity prices and is one of the most prevalent models used in this field of empirical research.
To determine whether our model fulfils all the requirements for being trustful and to prevent falling into misleading results, we will perform several tests. First of all, we will test for stationarity using a group unit root test which consists of the Augmented Dickey Fuller Test, Philips-Perron test and other stationarity tests. Next, we will perform a Variance Inflation Factors (VIF) test to confirm that multicollinearity is not present in our regression. Formerly, we will test for the presence of heteroskedasticity, using the ARCH Heteroskedasticity test. Lastly, we will depict if there is autocorrelation, using a correlogram which estimates the significance of certain lags for autocorrelation and partial autocorrelation.
6. Results
_____________________________________________________________________
In this chapter, we include the empirical section of the report initiating it with a pure analysis of our descriptive statistics. This segment also incorporates tables from the main regression analysis and the test results for verifying how well our empirical design works, in terms of stationarity, cointegration, autocorrelation and heteroscedasticity.
______________________________________________________________________ 6.1 Statistics
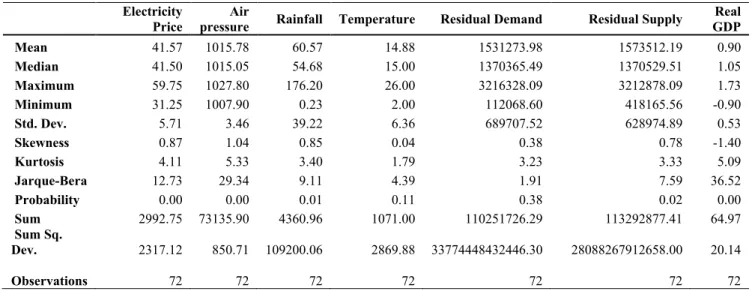
We estimate the day-ahead price in the Albanian market on the basis of monthly data over the period 2013-2018 with model (3). As a substitute of weekly data, we use monthly data instead as most of our explanatory variables are only available on a monthly basis. We estimate our model in logs not only because the coefficients can be read as elasticities but also due in order to obtain series with more stable variances. We also include the root term in the mean regression output which represents the constant quasi-difference term. This term is used to introduce the function of conditional variance into the mean equation. Table 2 and 3, are composed of the descriptive statistics and the correlation matrix, respectively. The descriptive statistics equip us with the basic information with reference to central tendency, dispersion, and normality of our dataset. The size of our sample is relatively moderate, including 72 observations. However, this amount of observations does not influence the normality assumption of our data set. To clarify, the null hypothesis of the Jarque-Bera test states that there is normal distribution, and since the six out of seven variables have probabilities less than the significance level of 0.1, we do not reject the null hypothesis and conclude we have normal distribution in our time series. The only variable where we reject the null hypothesis of normal distribution is residual demand (ED).
Furthermore, in regard to central tendency of our dataset, we deduce that our data are symmetric because the mean and median are very similar. In addition, the high value of standard deviation indicates a high spread in the data, especially for rainfall, residual demand, and residual supply. This interpretation is in coherence with the high fluctuation of rainfall levels in the Albanian territory, along with the varying demand and supply levels according to changing weather conditions during the year.
From the correlation matrix we detect that we have high correlation between residual demand and residual supply equal to 0.72. On these grounds, we test for the existence of multicollinearity in our dataset by using the Variance Inflated Factor (see Table 5). If VIF value exceeds 4.0 then there is a problem with multicollinearity (Hair et al., 2010). The most apparent result is that the VIFs are all down to satisfactory values since they are all less than 5. Hence, we confirm that multicollinearity is not present in our data set. After the examination of the remaining independent variables we find that there is not a significant correlation between the other explanatory variables and electricity price. Prior to the use of the data in the regression analysis, we apply statistical tests on stationarity, autocorrelation, and heteroskedasticity. Firstly, we test for stationarity to guarantee that the received results are neither biased nor inconsistent. We use a correlogram with autocorrelation and partial autocorrelation that have insignificant lags with random patterns, which conveys that the time series are stationary. To reinforce this statement, we carry out a Group Unit Root Test (see Table 7). The results confirm that the null hypothesis of non-stationarity is rejected.
In our model we use the Maximum Likelihood – ARCH estimation method. Likewise, we enclose two autoregressive variables and one moving average variable to control for autocorrelation and we add a variance equation to control for clustered volatility. Subsequently, we allow for conditional variance by introducing GARCH (1,1) structure. The choice of our model is based on some preliminary tests applied on the data. As an illustration, the Ordinary Least Squares method cannot be used because it will not allow us to restraint accumulated volatility in our model by including a variance equation. This can be supported by the fact that when running the OLS regression autocorrelation and non-stationarity are present. However, when implementing the ARMA model the problem of autocorrelation and nonstationarity of the residuals is solved, accompanied by an increased goodness of fit and a Durbin-Watson d-statistic equal to 2, which signifies no evidence of autocorrelation.
Furthermore, based on the test statistics of the ARCH test for heteroskedasticity (see table 8), we reject the null hypothesis of homoskedasticity at all levels of significance, meaning that an ARCH effect is existent. This implies that the error term is heteroskedastic and standard errors should be adjusted. It is of vital importance to fix for this issue and we
manage to do so by implementing an ARCH model. In particular, we use an ARCH-LM test on the new residual sequence and conclude that there is no ARCH effect anymore, hence homoskedasticity is attained.
Table 2: Descriptive Statistics
Electricity Price pressure Air Rainfall Temperature Residual Demand Residual Supply GDP Real
Mean 41.57 1015.78 60.57 14.88 1531273.98 1573512.19 0.90 Median 41.50 1015.05 54.68 15.00 1370365.49 1370529.51 1.05 Maximum 59.75 1027.80 176.20 26.00 3216328.09 3212878.09 1.73 Minimum 31.25 1007.90 0.23 2.00 112068.60 418165.56 -0.90 Std. Dev. 5.71 3.46 39.22 6.36 689707.52 628974.89 0.53 Skewness 0.87 1.04 0.85 0.04 0.38 0.78 -1.40 Kurtosis 4.11 5.33 3.40 1.79 3.23 3.33 5.09 Jarque-Bera 12.73 29.34 9.11 4.39 1.91 7.59 36.52 Probability 0.00 0.00 0.01 0.11 0.38 0.02 0.00 Sum 2992.75 73135.90 4360.96 1071.00 110251726.29 113292877.41 64.97 Sum Sq. Dev. 2317.12 850.71 109200.06 2869.88 33774448432446.30 28088267912658.00 20.14 Observations 72 72 72 72 72 72 72
Table 3: Correlation Matrix
Log Electricity Price
Log Air
pressure Rainfall Log Temperature Log
Log Residual Demand
Log Residual
Supply GDP Real Log Electricity Price 1.00 0.36 0.00 0.04 -0.18 -0.48 0.10
Log Air pressure 0.36 1.00 -0.36 -0.37 -0.02 -0.19 0.05
Log Rainfall 0.00 -0.36 1.00 -0.17 0.16 0.19 -0.06
Log Temperature 0.04 -0.37 -0.17 1.00 -0.34 -0.33 0.02
Log Residual Demand -0.18 -0.02 0.16 -0.34 1.00 0.72 -0.15
Log Residual supply -0.48 -0.19 0.19 -0.33 0.72 1.00 0.08
6.2 Findings
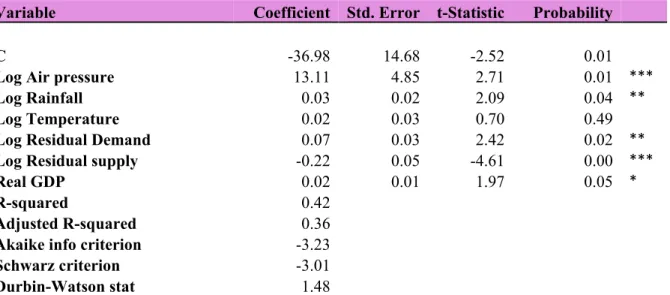
Table 4: Effects of explanatory variables on the log of the average monthly electricity price, 2013-2018
Dependent Variable: Log Electricity
Price
Method: ML-ARCH (Marquandt) -
Normal Distribution
Variable Coefficient Standard Error Significance
SQRT(GARCH) -0.76 0.42 0.07 *
C -35.95 8.62 0.00 ***
Log Air pressure 12.79 2.85 0.00 ***
Log Rainfall 0.02 0.00 0.00 ***
Log Temperature 0.04 0.02 0.06 *
Log Residual Demand 0.08 0.01 0.00 ***
Log Residual Supply -0.23 0.03 0.00 ***
Real GDP 0.01 0.00 0.06 * AR(1) 1.02 0.17 0.00 *** AR(2) -0.34 0.13 0.01 *** MA(1) -0.93 0.08 0.00 *** Variance Equation C 6.88E-06 1.77E-05 0.69 Resid(-1)² 0.32 0.19 0.08 * GARCH(-1) 1.11 0.21 0.00 *** GARCH(-2) -0.43 0.12 0.00 ***
First Quarter Seasonal Dummy 0.00 0.00 0.02 **
R² 0.57
Adjusted R² 0.50
Note: *, ** and *** refer to 10%, 5% and 1% significance levels, respectively
Table 4, illustrates the final estimation output with the results of the coefficients for all the aforementioned explanatory variables, together with the ARMA model terms and the variance equation. We examine from the variance equation in Table 4, that the GARCH effect from the variance equation is significant, which implies that the volatility clustering is persistent. In other words, the significant GARCH effect indicates there are periods of low volatility and periods where volatility is high in our data set.
The coefficient of the lagged squared residuals is positive and highly significant, which indicates that positive shocks affect conditional volatility. Likewise, the “D1” variable in the variance equation, captures the seasonal effect of the first quarter. This dummy variable shows that the effect on electricity price is significant from January to March. Since demand is elevated during these months, the electricity prices rise correspondingly. The inclusion of the two autoregressive terms and the moving average term, seems to
serve the purpose of controlling for autocorrelation since their coefficients are considerably high and exceptionally significant.
Having observed the resulted estimation output, we identify that all of the enclosed economic and climate factors have an impact on electricity prices. The estimated coefficients for the control variables are statistically significant, have the expected sign, and their magnitudes seem reasonable. The market structure, which is captured by the residual demand explanatory variable (LOGED), has had a relatively low but significant positive influence on electricity prices of 0.08%. This effect is aligned with what we were originally hypothesizing. It conveys that electricity prices are essentially elastic to changing demand levels. Simply put, the hydropower plant electricity produced is priced with a moderate influence from the consumers’ demand. This variable captures the size of the market and thus, the positive sign suggests the absence of a scale effect. Nonetheless, this result can also be interpreted by a secondary reason. Particularly, it embellishes that the goal of increasing effective competition in the domestic energy market has not been accomplished yet. The Albanian Government endorsed the promotion of local competition since 2015 by passing new laws and reforms in the Albanian power industry, but the obtained results reflect that these measures have not been effective so far.
As for the residual supply (LOGRS), a 1% increase of this variable results in a 0.23% reduction in electricity prices. This is consistent with our initial assumption, where the increase of residual supply reflects that the market power for the Albanian public energy sector is decreased. Under these circumstances, KESH does not have enough market power to set higher prices. Additionally, the increase in residual supply also indicates that more independent manufacturers and the influx of power exchanges will make the governmental price-setting process more uncertain. The high dependency on supply, features that supply shocks disrupt electricity productions and are potentially caused by weather factors as the role of weather in electricity price formation is indisputable. Furthermore, the positive relationship between real GDP (RGDP) and electricity price of 0.009% approves our primary assumption that the general economic development level modestly plays a role in explaining the variation of electricity price levels.
With respect to the climate factors, we witness that all three; air pressure, rainfall levels and temperature affect electricity prices in Albania. To begin with the air pressure variable, we unexpectedly find a highly positive and significant coefficient. A 1% increase in air pressure (LOGPRE), increases the electricity price by approximately 13%. This means that our independent variable is extensively influenced by the level of air pressure. As previously demonstrated and confirmed by our results when the level of air pressure increases, the water flow decreases. This means that the hydropower reservoir levels are lower, and the water value is enhanced. Therefore, this change is accompanied with an increase of the electricity price. Bernoulli’s Law is directly related to the principle of conservation of energy. We suspect that this highly significant relationship is reinforced by virtue of the 100% reliance on hydropower in the Albanian territory. Coupled with this climate variable, rainfall level is also significant in partly explaining the electricity prices. Hence, we conclude that water reservoirs depend on the level of precipitation. Notably, the relationship between this explanatory variable and the dependent variable is positive, which coincides with the second alternative of our initial hypothesis. In percentage terms, a 1% increase of rainfall (LOGRL) increases the electricity price by 0.015%, and this relation can be supported by three different inferences. Firstly, high levels of rainfall levels increase the level of water reservoirs which may press the electricity price upwards, because the cost of holding water is very high. Secondly, one of the viable justifications behind this outcome is the high volatility of rainfall levels in our dataset. Third, since experts forecast that the level of intensive rainfalls has and will continue to magnify in the future, this extreme weather condition can negatively govern the physical conditions of the dams. This will exert higher costs in the production chain and thereafter increase electricity price. From an actualized research it is estimated that large dams sacrifice on average roughly 18.2% of their contemporaneous production for the purpose of flood control (Tien et al., 2018). It conforms with the third potential interpretation for the results we obtained.
Pursuing with the last climate factor discussed in this paper, the price elasticity of Albanian temperature (LOGTEMP) is roughly 0.038 and its impact has been perpetual throughout all the time periods investigated. Logically, temperature affects the demand for electricity as well as its supply. The results provide relevant insights about a higher dependence on hydroelectric production makes a country more vulnerable to temperature,