The impact of immigration on
unemployment and GDP per capita
BACHELOR
THESIS WITHIN: Economics NUMBER OF CREDITS: 15hp PROGRAMME OF STUDY: International Economics
AUTHORS: Maria Lahdo & Angela Georgiou Nano
Bachelor in Economics
Title: The impact of immigration on the unemployment rate and GDP per capita for the time periods 1985-2000 and 2006-2016
Authors: Maria Lahdo & Angela Georgiou Nano Tutor: Paul Nystedt & Toni Duras
Date: 2019-05-19
Keywords: Immigration, unemployment rate, GDP per capita, immigrants
ABSTRACT
The consequences of immigration have been heavily discussed by researchers, economists, politicians and people in general. The existing literature regarding immigration and its impact on the economy is divided and looked upon through different perspectives. Therefore, it could be said that immigration and its economic impact on the host country is a controversial subject. The purpose of this study is to analyse the impact of immigration on the European OECD countries economy by looking at the unemployment rate and GDP per capita for two different time periods, those being 1985-2000 and 2006-2016, to see the effect of each time period and to compare the waves of immigration. The methodology used is a fixed effect regression. The results obtained were in line with the existing theory showing a positive impact or no impact at all of immigration on the unemployment rate and GDP per capita, but shared different results across time.
2
1. INTRODUCTION ... 3
2. BACKGROUND ... 6
2.1 FACTORS AND TYPES OF MIGRATION ... 7
2.2 OECD immigration ... 8
2.3 DATA SECTION ... 10
3. LITERATURE REVIEW ... 21
4. EMPIRICAL DESIGN ... 25
4.1 DESCRIPTIVE STATISTICS ... 28
4.1 EMPIRICAL RESULTS FOR UNEMPLOYMENT RATE ... 29
4.2 EMPIRICAL RESULTS FOR GDP PER CAPITA ... 33
5. CONCLUSION ... 39
6. REFERENCE LIST ... 41
3
1. INTRODUCTION
People have travelled across the continents since the beginning of humankind history. The motivations for moving have varied throughout the years and some reasons has been the exploration of a better life, new opportunities or explore other places. The mobility of individuals to other regions, countries and continents can be defined as migration. The word ’’migration’’ can be characterized as the perpetual process of individuals creating new residences, more specifically leaving their residence and moving to a new place of living. The process of migrating to other regions throughout history has been a detrimental effect on how the world, cultures, ethnicities and languages have been shaped (Human migration, 2008).
Relative to the concept of migration follows immigration. Immigration can be described as the process of moving to another country with the purpose of permanently settling there (Immigration, 2013). Regarding immigration there has been a movement of people across countries throughout history and in year 2017 approximately 3,4% of the world population did not live in the country they were born in, which accounts for around 258 million people (Population Facts, 2017). The past years there have been two large immigration waves in Europe, the first one being in the 1990s during the Yugoslavian war and the second and more recent one from 2014 and on during the syrian civil war that forced a wide range of people to leave their countries and flee to safer places. There have also been immigration due to other factors during those time periods.
Immigration and the effects of it have been extensively debated. The ongoing debate regarding the consequences on the host country is complex, over the years the opinions and discoveries have not been black or white. With other words, it cannot be certainly said that immigration has a positive or negative impact on the host country’s economy without taking into consideration the country’s characteristics and policies regarding the intake of immigrants as well as the immigrants’ skills and characteristics. Researches that have gone through these effects will be dicussed further in this paper.
4
The views upon the effects of immigration are divided and mainly depended on the country’s economic well being. There are studies showing a possitive impact of immigrantion on the host country ( Friedberg and Hunt , 1995; Cattaneo, Fiorio & Peri, 2015; Boubtane, Coulibaly & Rault, 2013). However, there are also studies which implies that immigration could have a negative effect on the host country ( Haris & Todaro, 1970; Angrist & Kugler, 2003).
Not only do immigrants face challenges when settling down in a new country, but a country also faces challenges with integrating the immigrants, support them financially and providing them with what they need to become a part of the country. Hence, the main purpose of this paper is to study and analyse the economic impact of immigration on the European OECD countries during two different time period, the first one being 1985 to 2000 and the second one 2006 to 2016. The underlying idea was to analayse different time periods that were caracterized by large immigration waves, but also to have a long time period to study. The frist and second time period catches the immigrants from the two wars, but the main focus is not only the immigrants fleeing from war but all types of immigrants dureing. Thus, this study did not isolate immigration due to war. To analyse the economic consequences of immigration GDP per capita and unemployment will be studied and used as indicators. Furthermore, the time periods will be studied separately, and then compared to see if the result varies over these two immigration waves. There are many theories and studies about economic effects of immigration, however this study will look closer to how two different immigration waves two the OECD countries in Europe have affected the economy and if there are any differences or similarities between them. Immigrants are a type of human factor that possesses different characterssitics, and these may vary over time as well as the characterisitcs of the cpountry changes over time. Higher or lower skill levels depending on where the immigrants comes from and there reasons for immigrating, the technological advances and many more factors may have an effect. The research question of the paper is The impact of immigration on Unemployment rate and GDP per capita for the time periods 1985-2000 and 2006-2016.
In order to study the impact of immigration on the economy of the OECD European countries under the time periods mentioned, not all the OECD countries will be included since the differences in the economic cycles, types of immigration and distance may make the data
5
inaccurate. Therefore, only the European OECD countries be will be taken into account for the study. The main idea of having those particular countries is because of the similar business cycles, trade amongst each other that makes the economies integrated, and due to closer distance to the catastrophe areas compared to US, Australia or other OECD countries far away.
The primary thought was to examine the OECD countries in the European Union. The difference of including OECD countries of the EU or the OECD countries in the European continent are three countries: Norway, Iceland and Switzerland. Although they are not members of the EU, they have a close relationship with the union and its member countries. Hence, the OECD countries that are excluded from this study are the ones that are not in the European continent, such as Australia, Canada, Israel, Japan, Korea, Mexico, New Zealand, Turkey and the United States.
The countries that are included in the studies for the time period 2006-2016 are: Austria, Belgium, Czech Republic, Denmark, Estonia, Finland, France, Germany, Greece, Hungary, Iceland, Ireland, Italy Latvia, Lithuania, Luxembourg, Netherlands, Norway, Poland, Portugal, Slovak Republic, Slovenia, Spain, Sweden Switzerland and United Kingdom.
For the time period 1985 not all 26 countries used in the first time period are included since values for the inflow of foreign population were missing. Only 14 countries will be studied for the early time period and these are: Belgium, Denmark, Finland, France, Germany, Hungary, Italy, Luxembourg, Netherlands, Norway, Spain, Sweden, Switzerland and United Kingdom.
The methods that will be used in the thesis are secondary sources. Firstly, ordinary least squares regression will be applied to get a broader idea of the explanatory variables and their effect on the dependent variables. Then a fixed effect model with dummies for each cross-sectional subject and for the time will be applied. The advantage of having dummy variables is that they take into account the heterogeneity of each country. The fixed effect model will be used as the main model to study the impact of immigration.
6
2. BACKGROUND
Throughout history, many wars have taken place across the globe, which results in death, destruction, and forced people to immigrate. To be forced to leave one's country and settle down somewhere else have been a reality for many people, which have influenced the immigrants, and the receiving countries as well in a sense that there are challenges to adapt to the new environment, culture, and the host country faces the challenge of integrating the immigrants.
Two recent wars that have resulted in mass immigration to the European OECD countries are the Yugoslavian war in the 90s and the Syrian civil war that started 2011 and is still going on. The two wars left a large group of immigrants that still impacts and influences the economies and societies of those countries, together with other immigrants.
In 1991 Slovenia and Croatia declared independence from the Yugoslav federation, this was followed with other countries doing the same, which was the end of Yugoslavia and the start of the conflict in Balkan region in the 1990s. The conflict developed into a full-scale war with over 140 000 deaths (Transitional Justice in the Former Yugoslavia, 2009). The war destroyed the country, as well as it forced hundreds of thousands of people to flee. In Bosnia half of the population left their home, and a total of 4 million refugees from former Yugoslavia were displaced. However, in the coming years after the war was over, 2,5 million refugees returned, while over 650,000 settled down in other countries (Wilkinson,, 2005).
The Syrian civil war started in 2011 when some of the Syrian citizens started the uprising against their president Bashar al-Assad. The reason for their actions was because they wanted to end the dictatorship that has been around in Syria since 1971. As a consequence, violent methods were used by the Syrian government in order to stop the protests which later on, developed into the civil war. The dissatisfaction with how the country was ruled by Bashar al-Assad, how the country kept facing economic struggles and with the insufficient amount of rain that led to poverty, triggered the Syrian uprising. The combination of the economic and political issues created chaos and instability in the country and gave the opportunity to the creation of militarized rebels that have been involved in the conflicts
7
against the regime, which resulted in the disasters (ENCYCLOPEDIA BRITANNICA, 2019). The Syrian civil war has created one of the largest and most serious humanitarian catastrophes of our time and set millions of people on the movement to escape the war (Refugees, 2019). After years of conflict, almost 13 million Syrians have left their home, which is more than sixty per cent of the pre-conflict population. Half of the refugees are still in Syria, while the rest left for other countries. About 5 million are in the neighbouring countries like Turkey, Lebanon and Jordan. Europe has been receiving more than 1 million Syrian refugees (Connor, 2018).
2.1 FACTORS AND TYPES OF MIGRATION
If the phenomenon of immigration is considered from a broader perspective, people tend to leave their country for another country due to economic factors, political factors and humanitarian factors. There are people that take the decision to migrate to a country that has better economic wellbeing like higher income levels and better opportunities when it comes to working. There are also people that are attracted to the incentive of better educational levels that another country has, and also attracted to where discrimination is not happening in a large scale and to a country where civil rights exist and are respected. Moreover, a country that is stable from a political point of view, has laws and orders, has no conflicts and is overall safe, is a motivation for some people to migrate to that country (B.Bodvarsson & Van den Berg, 2013).
All of the above determinants can be grouped into one of the four categories that determine whether or not immigration will happen in a certain country. The category that the determinants discussed above fall, is the ''pull'' factors, in other words, those characteristics pull people into the country. Other factors that can make people immigrate to another country are the ''push'' factors. Some of those factors could be that a country that is politically unstable, has a civil war going on, a poor economy, unemployment or criminality (B.Bodvarsson & Van den Berg, 2013).
The third and fourth categories are factors that discourage people to leave their countries. ''Stay'' factors are the factors that make people hesitate to leave one’s country. Few of those factors are the social network that is built in the home country and the convenience of knowing how the country operates in terms of language, laws, employment and many other
8
factors. On the other hand, the difficulty of learning a new language, different culture, unemployment rates, criminality and war are the factors that will induce people to stay away from such countries having those characteristics. Therefore, those factors are the ''stay away'' factors (B.Bodvarsson & Van den Berg, 2013).
Because of the different factors that are behind whether people migrate or not, come the different types of migrations. Migration can be categorized into internal and international. Internal migration is when people migrate within the country, for example from the rural areas to the urban areas. Whereas, international migration is when people migrate from one country to another country (Human migration, 2008).
In addition, migration can be categorized into voluntary and forced migration. Migration can be described as voluntary when the driving factor is the search for better life opportunities. However, forced migration has to do with people that unwillingly have to move to a new country due to government expelling them, due to war, or people that have been transported as slaves and prisoners across countries. In-between voluntary and forced migration is the voluntary migration of people fleeing from their countries due to war, natural catastrophes and hunger (Human migration, 2008). Particularly, the people fleeing from their countries due to any dangers that could be imposed on their lives are called refugees and asylum seekers (B.Bodvarsson & Van den Berg, 2013). Concerning the recent large wave of immigration into the OECD countries in 2014, the largest group of immigrants are refugees and asylum seekers that have fled their countries due to the Syrian civil war, followed by people from Afghanistan and from Somalia (UNHCR, 2015).
2.2 OECD immigration
A paper published by the OECD in 2014 tried to answer the question if immigrants are actually an asset or burden for the host country. According to this paper, 47% of the workforce increase in United States and 70 % in Europe is represented by immigrants over a period of 10 years, immigrants also filled the gaps of different sectors in the economy. By entering the labour force, immigrants help to increase the host countries working-age population since countries with population ageing needs more people to be able to work. Moreover, human capital and the technological process get boosted by the skills, knowledge
9
and innovation of immigrants, which play an important role in the economic growth of a country ("Is migration good for the economy?", 2014). Immigrants in general is not a homogenous group, they have different background, experience, education and skills. In a report made by OECD it appears that less than 25% of all immigrants in the OECD countries have only or less than a primary education, while a third of them have a higher education degree. It is shown that for the low educated immigrants the unemployment rate is the same as for the low educated natives, but the rates between high educated immigrants and natives the rates differ remarkably and when employed they are 50% more likely than a native to be overqualified for a job (OECD, 2018). As migrants do not have the same educational background, it was found that immigrants of young age have a higher level of education compared to the previous generation of immigrants. Since the beginning of the 21st century, the education degree of the workforce has increased, immigrants representing 31% of the increment of the highly knowledgeable workforce in Canada, 21% in United States and 14 % in Europe. Additionally, 22% of immigrants entering the labour force in the United states and 15% in Europe are shown to be working in flourishing professions while in the meantime, in the United states 28% of the immigrants entering the labour force works in professions with declining employment and in Europe the percentage is 24. A study recently made about the immigration’s fiscal impact, has found that individuals who have migrated over the last 50 years into the european OECD countries, Australia, Canada and United states, had almost zero impact, barely went beyond 0.5% of GDP, with an exception of Switzerland and Luxembourg with a 2% of GDP gain. Related to this part, the results of a study conducted for 22 European OECD countries for the period 1986-2006, were that economic impact of immigration is positive but very small. Furthermore, even though the natives pay more taxes, immigrants also pay taxes that helps the country into its needs and the fact that they contribute less is due to their lower wages and not because of social benefits that they get. Therefore, increasing and helping the immigrants to enter the labour force in the level of the natives, will induce a higher positive fiscal impact (OECD, 2014).
10
2.3 DATA SECTION
Graphs have been made in order to get a visual representation of the studied data, with other words inflow of foreign population per capita, unemployment rate and GDP per capita.
The first graph visulize the inflow of fproign population that the 14 OECD countries had from 1985 to 2000. The numbers are represented per capita.
Figure 1. Inflow of foreign population into the european OECD countries for the period 1985-2000 (International Migration
11
Figure 2. The average of inflow of foreign population into the european OECD countries for the period 1985-2000
(International Migration Database, n.d).
As can be seen in figure 1 there are some differences concerning the intake of immigrants for the 14 countries. Luxembourg, Germany and Switzerland are three of the countries with the highest intake when considering the inflow per capita compared to the rest of the countries. Whereas, Finland and Hungary were a few of the countries that received the least immigrants. In order to have an overview of the inflow of foreign population, the mean of the inflow of immigrants of each year for all countries was composed which is represented in figure 2. Looking at figure 2, it could be seen that there has been an increase of immigrants from 1985 to 2000. The trend however, has not been upward sloping thought the whole time period. Firstly, an increase from 1985 to 1992 could be seen. Later, it could been noticed that a decrease of immigrants in 1992 until 1997 where the trend then becomes once more upward sloping, with an increasing number of immigrants. Due to economical advances in Asia and also the opening up to Eastern Europe there was a rapid increase of immigrants up until 1992 when the countries with high inflow of foreign population took actions against the immigration in order to slow it down (OECD, 2003).
12
Graph 3 and 4 represent the unemployment rate for 1985-2000. Data is missing for Germany and Hungary for 1985-1990.
13
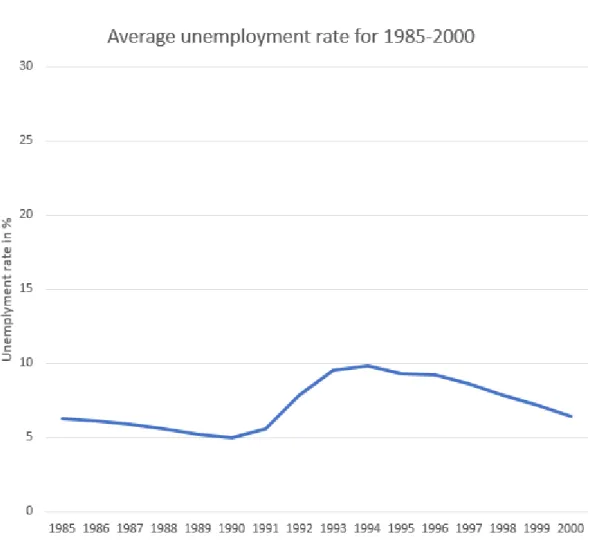
Figure 4. The average unemployment rate of the European OECD countries for the period of 1985-2000 (OECD.Stat,
2018).
As seen in figure 3, the unemployment rate varied for different countries. Some of the countries that had high unemployment rates were Spain for the whole time period and Finland for the 1990s. Switzerland, Luxembourg and Norway on the other side, had low unemployment rates compared to the other countries. In figure 4 which represents the average unemployment rate, a drop could be seen from 1985 to 1990 and a rise then from 1990 until 1994, where the unemployment rate started to fall again. The rise of the unemployment rate in the beginning of the 90s was due to financial crisis that struck large parts of the western world. Some of the underlying causes that lead to the crisis was the fall of the iron curtain, which had divided western and eastern Europe for many years and the Gulf war, which lead to higher oil prices. Finland and Sweden were two countries that had a high increase of unemployment rate since they were both strongly affected by economic crisis. This led them into a recession which lead to economic consequences that were some of the most severe throughout modern time for the two Nordic countries (Jonung & Hagberg,
14
2005). By the year 2000 the unemployment rate had been stabilized for the countries on average and was back to the same level approximately as it was in 1985, which was around 6 percent.
In the following figure GDP per capita is represented. Note that data for GDP per capita is missing for Hungary for year 1985-1990.
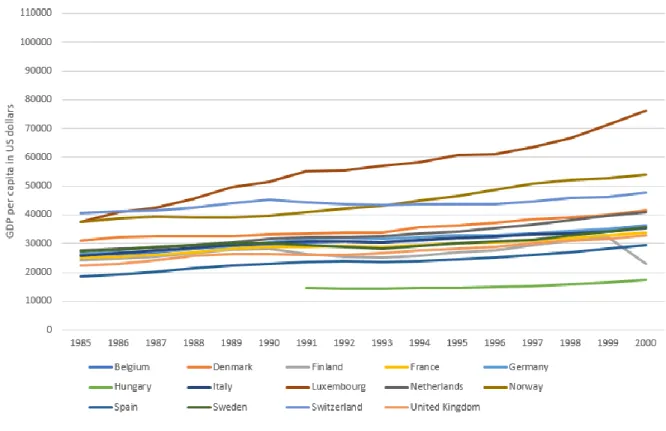
Figure 5. GDP per capita for the European OECD countries for the period 1985-2000 ("Gross domestic product (GDP) :
GDP per head, US $, constant prices, constant PPPs, reference year 2010", n.d.)
When it comes to the GDP per capita, in figures 5 a general persistent increase of the GDP per capita has been seen for the 14 countries for the whole time period. In addition, Luxembourg had a higher level of GDP per capita than any other country and Hungary was one of the countries with a GDP per capita lower than the other countries.
The same figures will be represented for the second time period, 2006-2016. The first one representing the inflow of forieign poupulation for the 26 countries. For the second time period the 26 countries have been divided in two graphs for better visualization.
15
Figure 7. Inflow of foreign population into the european OECD countries for the period 2006-2016 ("OECD International
16
Figure 8. Inflow of foreign population into the european OECD countries for the period 2006-2016 ("OECD International
17
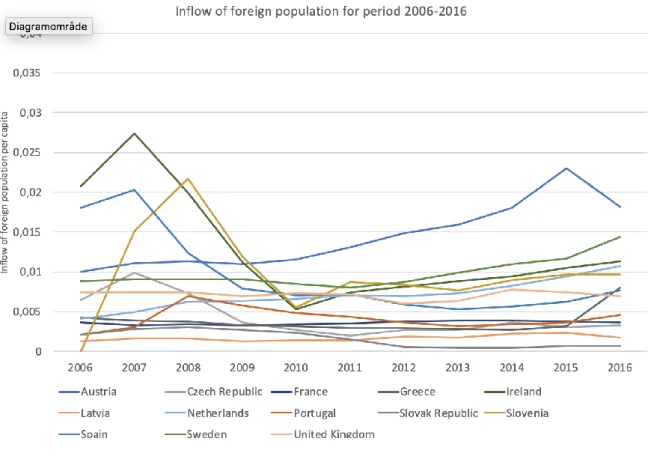
Figure 9. The average of inflow of foreign population into the european OECD countries for the period 2006-2016 ("OECD
International Migration Database and labour market outcomes of immigrants - OECD", 2018).
As it could be seen in figures 7 to 9 there are large differences in the intake of foreign population among the countries. When comparing all countries, Germany, Luxembourg and Switzerland are the countries that had the highest inflow of immigrants. While, Estonia and Lithuania are some of the countries that took the least immigrants. Over the time period some countries had a decrease of immigrants, few of those being Czech Republic, Spain, Slovenia, and Ireland. While other countries like Sweden, Poland, Netherlands and Denmark had an increase in their inflow of immigrants. In the case of Spain (Arteta, 2017), Czech Republic (Ram, 2009) and Slovenia ("Slovenia | MIPEX 2015", 2015), the decrease may have been a consequence of the financial crisis of 2008 that hit the countries, which caused a so called stay away factor that is mentioned above. While, in the case of Ireland, the drop in immigrants was due to the lower inflow of immigrants from other EU countries (countries that joined EU between 2004-2007) that previously have immigrated to Ireland (Quinn & Ruhs, 2009). On the other hand Sweden for instance had a high inflow of immigrants, one reason was because they granted syrian refugees permanent residence permits 2014-2016, and therefore experienced a peak during those years (Sweden and migration, 2019). Also Germany had generous immigration policies that allowed for immigration (UNHCR,2015). Denmark also had a increase of immigrants, however, the levels are much lower compared to Sweden and Germany, since they had more restrictive policies towards immigrants, they experienced an increase mostly due to the overall increase in immigrants to Europe (The Ministry of Immigration and Integration, 2017). It could be due to the economic wellbeing of the countries as could be later seen in graph 11, that attracts individuals to choose Sweden and Germany, this could be seen as a pull factor. The increases seen in the graphs of the number of immigrants is a also a consequence of the fact that the total number of immigrants in the world increased with 8.3 million people from 2013 to 2014, which is the largest increase of immigrants over a year. 219000 of those immigrants passed through the mediterranean sea in order to reach Europe (UNHCR,2015). Poland have since 2009 worked and developed policies in favor of immigration to the country, making it easier and thus more attractive for people to immigrate to poland, and this is a reason behind the higher amount of immigrants (Fihel, Kaczmarczyk & Stefanska, 2012).
18
Graph 10 and 11 represent the unemployment rate for 2006-2016.
Figure 10. The unemployment rate of the European OECD countries for the period of 2006-2016 ("Unemployment -
19
Figure 11. The average unemployment rate of the European OECD countries for the period of 2006-2016 ("Unemployment
- Unemployment rate - OECD Data", n.d.).
As seen in figure 9 and 10 there is a general upward going trend in 2008 and the following years, the trend seen is due to the economic crisis that hit many of the European countries in 2008. Some countries, for instance Spain and Greece stand out with their unemployment rates reaching over 25%. These countries had the highest rates compared to the other OECD countries, since the crisis hit those countries very hard. Countries like Norway, Germany and Switzerland had a low unemployment rate and a stable development over the time period that was measured. In figure 10, it could be seen that the crisis did have an impact on the average unemployment rate of the countries, although, from 2010 the unemployment rate starts to stabilize. Moreover, 2013 was the year where a decline of the unemployment rate could be seen with an average rate of approximately ten percent, this was due to economical improvements in the European countries (Flores & Krogstad, 2018).
20
In graph 12 the unemployment rate for the 26 countries in 2006-2016 will be represented.
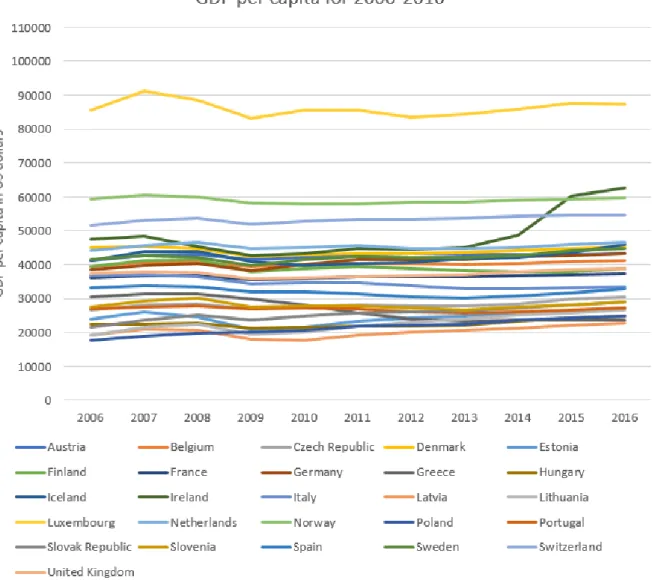
Figure 12. GDP per capita for the European OECD countries for the period 2006-2016 ("Gross domestic product (GDP) :
21
3. LITERATURE REVIEW
As previously mentioned in this paper, the views of immigration and its overall impact on the countries that receive immigrants has been widely debated and tackled from different perspectives, and the conclusions have not been unanimous, neither have the theories and studies been. Some studies have found a negative association of immigration on the host countries and some have found a positive impact of the immigration or even no impact on the received countries. Several studies have been made on countries that have had a high inflow of immigrants, and when examining them, the findings are that immigration in general does not have an effect or only a modest effect on the wages and unemployment levels of natives. However, there are studies that suggest a small negative impact on the wage for other immigrants that immigrated to the country earlier. These results will be gone thorugh in this section.
It should be noted that when analyzing the labour market effects, researchers make a distinguish between workers based on their skills to see which groups of the labour market are affected by the inflow of foreign population. Immigrants are often divided in skilled and unskilled labor, where skilled labor are usually defined as those of either higher education or experience. Theories suggest that the immigrants will have an impact on the labour market if the level of skilled and unskilled are not equal to the native ones. For instance if the labour market in the receiving country consists of more unskilled workers, then there will be an excess supply of unskilled workers, and their wages will be depressed. At the same time, there are relatively less skilled workers compared to before the inflow of immigrants, thus they will experience a higher wage. Although, if there are more highly skilled workers, the result is the opposite (Dustmann, Glitz, & Frattini, 2008). However, the studies on the employment rate varies, some claim that the effect of immigrants on the less skilled labour is very small (Altonji & Card, 1989).
Borjas (2003) report found that the high inflow of low skilled immigrants have had the same effect that is predicted in the theory mentioned above, lower wage for low skilled workers, and that the effect is decreasing the higher the education of the natives. However, he stresses the fact that the overall economic effect is dependent on many factors which have been ignored in his study, and they could have had an effect on the overall economic effect. Some
22
of the factors mentioned are the parts played by high skilled immigrants on the technological advances, or the capital changes in the long run that is caused by immigrants (Borjas, 2003). Other economists come to similar conclusions about the effects on the labour market by immigration, but claim that the effect is smaller. The overall effect is very small but larger for natives with low skills (Card, 2001). However, recent studies made by the same economist on the effect of immigrants on natives do not support the basic theory that low skilled immigrants affect low skilled natives due to more supply of workers ( Card, 2005).
It could rather be seen that immigration, and mainly immigration that consists of high skilled workers boost innovation and thereby it may have a positive effect on productivity and wages for the natives (Peri, 2014). By the same token, the empirical testing for immigrants impact on the UK found a negative assosiation. The study has demonstrated positive effects which also stretches the fact that the type of immigration, and more specifically the skills of the immigrants is an important aspect to consider when measuring the effect of the immigrants on the host countries (Dustmann, Fabbri & Preston, 2005). Similar results have been found by Venturi and Villosio (2006) with a study made on Italy and by Pischke and Velling (1997) with a study made on Germany, which saw no effect on the unemployment of natives because of immigration.
Moreover, there are different theoretical models that predict various results due to immigration. A study conducted by Ortega (2000), wanted to shed light into immigration's impact on the natives wages and unemployment, and particularly the fact that immigration could have positive impact on those two variables compared to previous studies made by other economists that examined the possibility of immigration negatively affecting the natives of the host country. The authors model was based on the fact that there are two countries with different structural features and include workers that are either from country 1 or country 2 and when they do not have any job, they either decide to search a new job in their home country or in the other country. Employers in each country offer available jobs and take into consideration the searching costs of the workers when looking for a new job in the countries. Looking for jobs abroad will happen only if they are sufficiently paid in order to compensate for the costs of migration. Whereas, the employers assume that they can pay low wages to the immigrants. Firms benefit from the lower wages which enable them to increase their demand in labour, this will in return benefit natives that are employed due to
23
more open job vacancies because of the inflow of immigrants. Immigrants benefit as well because the new country offers the job opportunities with higher wages than the wages that they would have earned in their home country, given that they would find a job there. The findings out of Ortega’s study are that everyone could benefit from immigration; however, that depends on the structural characteristics of each country, how alike or different they are and how strict union wages are.
Additionally, a paper written by Friedberg & Hunt (1995) has collected few theories related to immigration. What was implicitly communicated throughout their paper was that the theoretical impact of immigration depends on which model is used when trying to describe the economic effect of immigration on the host country. Immigration will have different results depending on if the country is a closed economy or an open economy. A closed economy country, is a country that does not have any trade with other countries and an open economy country, is a country that has trade with other countries. An inflow of immigrants in a closed economy will make the price of factors to decline if they are perfect substitutes, will not have a clear effect on the price of them if they are imperfect substitutes and will make the price of the factors higher if they are complements. What is meant by factors, are the factors of production such as capital and labour. Then, capital and skilled labour are complements, while unskilled labor is a substitute for capital and skilled labour. If the inflow of immigrants consists of unskilled workers, then immigration in that case, will have a negative effect on the wages of the native unskilled workers , while the effect on the wages of the skilled workers and return of capital will be debatable. The decline in the wage for the unskilled labor could lead to that employers will replace capital and skilled labor with unskilled labor. However, the larger amount of unskilled labor means also a higher output and the employers will therefore use all of the inputs of the countries. On the other hand, if the immigrants are skilled, the effect of them will be lower wages for the skilled labor, and an uncertain effect on the wages of the unskilled wage. But once more, the lower wage of the skilled labor and the higher employment of the skilled labor due to lower wages will lead to an increase in the return of capital due to the higher demand of the capital. So once more, either skilled or unskilled immigrants will result in the end in an increase of the return to capital.
24
The results from immigration are quite different on the countries that have an open economy, based on a theoretical model of trade and factor flows. In this model, countries have different factor endowments and focus on producing a narrow scope of goods in order to be efficient. Countries that have a large amount of labour in comparison to capital, will specialize in goods that are labour intensive, compared to countries that have large amount of capital. A large inflow of immigrants into an open economy, will drive the country to produce more labour intensive goods which in return will lower their world prices, thus lower the wages. While a small influx of immigrants, will not have any effect on wages since the country will produce more of its labor intensive goods, thus supply more of those goods in the world, which will in return lead to factor price equalization. Any effects on wages of the native labor come with changes in the labor market , meaning changes in the employment. In the case of the closed economy, with the inflow of unskilled immigrants, even though the employment of unskilled workers in total have increased due to the influx and wages became lower, due to the lower wages the native workers may leave the labor market or reduce the hours of working causing the employment level to decrease in the end. While the other unaffected group of workers’ wages may rise and the employment in that sector may as well increase due to immigration (Friedberg & Hunt, 1995).
The models or theories discussed above do not imply that immigration causes unemployment rather that there is a movement or differences between the groups of workers depending on the skills, and that due to the job matching, in the short run, unemployment for the natives can occur. Moreover, due to the wages rigidity, it can happen that wages do not change and unemployment could result out of that, as is the case with the labor union. The empirical evidence from the study shows that immigrants have a negligible effect on the labour market, even for the similarity-skilled natives. Moreover, overall impact on the economic growth seems to depend on the resources the immigrants have (Friedberg & Hunt, 1995).
Even if most studies indicate a small positive effect or no effect, there are also a few that illustrate a negative effect. Harris and Todaro (1970) examine the relationship between immigration and unemployment rates, with the use of a two-sector model in order to explain how native workers are displaced because of the inflow of immigrants. Moreover, another study that looked upon immigration with a negative perspective, is a study made by Angrist and Kugler (2003) that looks at the effect of immigration on 18 European countries, where
25
it is common to have policies and institutions in order to integrate the immigrants, over the time period 1983-1999. The study found a small negative effect on the unemployment rate of the natives.
Besides the unemployment rate, one should not forget the impact of immigration on the economic growth of a country. When it comes to this case, the Solow model (Solow, 1956) and the Schumpeter model indicate that immigrants could positively affect the economy of the host country by playing an important part and contributing to the technological progress. According to these models, the main factor that contributes to a country’s economy is technology and then other factors follow, such as physical and human capital. Immigrants are seen in these models as a significant factor of input that could increase the productivity of a country by the knowledge, skills and ideas that they carry with them into the country they immigrate to. The whole idea of immigrants as an input of the technological process of a country, is a chain of events; knowledge, ideas and skills of immigrants create innovation, then innovation leads to technological improvements, that in return lead to the increase of the economic growth (B.Bodvarsson & Van den Berg, 2013).
4. EMPIRICAL DESIGN
Before conducting the empirical studies, the variables included in the regressions are going to be explained. In order to study the result and compare the two immigration waves of the Balkan war and Syrian civil war, the data of each time period for the unemployment rate and GDP per capita will be regressed. Due to the lack of some data for 1985-2000 , the number of countries in the two time periods will be unequal, having 14 countries in the first time period and 26 in the second one. To control for this, regression will be also conducted for the same 14 countries for 2006-2016 in order to ensure that there are no differences in the results compared to the regression having the 26 countries in 2006 to 2016. The methods used to study the impact of immigration on the unemployment rate and GDP per capita for the OECD countries are pooled OLS and fixed effect regression. When conducting the fixed effect model, we are basically taking into account the heterogeneity of each country, the country’s specific characteristics that determine how immigration could impact the receiving country, while conducting only poooled OLS it pooles the data together neglecting individual differences of each country.
26
When conducting an OLS regression with our variables, inflow of foreign population was used as the only independent variable and then GDP per capita was added as the impact of immigration on the unemployment was studied. When GDP per capita is the dependent variable, inflow of foreign population was used as the only independent variable and then unemployment rate and age dependency ratio were added. To avoid having the variables being correlated with each other which would cause multicollinearity problems, correlation was checked in two different tests which did not indicate any serious correlations as seen in the appendix. To be noted there are ommited variables that could fit in the model in order to explain the unemployment rate and GDP per capita, however due to not being able to find data for each one of them and also due to some high values of corellation, the paper is limited to those that have been previously introduced.
Unemployment rate
When studying the immigration’s effect on the unemployment rate, the variables that will be used are inflow of foreign population per capita and GDP per capita. Unemployment rate is the dependent variable in our regression analysis. Inflow of foreign population per capita will be used as an independent variable which is our mainly focus. Inflow of foreign population per capita, is the inflow of foreign population divided by the respective country’s population. In order to answer the thesis question if immigration have an impact on the unemployment rate of the receiving countries, another independent variable, GDP per capita will be used as a control variable, as it controls for fluctuations in the economy which also could have an impact on the unemployment rate. According to Okun’s law there is a negative association between unemployment rate and GDP, an increase in GDP shows an increase in the country’s economic activity that leads to lower unemployment (Sánchez & Liborio, 2012). In addition, the economic well being of a country seen as GDP per capita is a pull factor for immigrants as previously mentioned in the paper. In the beginning wages and inflation were going to be included as independent variables, since they also do have an relationship with unemployment rate. While doing an OLS regression it was found that inflation was insignificant on all significance levels ( alpha= 0,01, 0,05, 0,1) and wages were highly correlated with GDP per capita which would cause multicollinearity and not trustworthy coefficients. Therefore, inflation and wages were excluded from the model.
27
When conducting an OLS regression with our variables, inflow of foreign population was used as the only independent variable and then GDP per capita was added. To avoid having the variables being correlated with each other which would cause multicollinearity problems, correlation was checked in two different ways, a correlation table and a VIF test was made which did not indicate any serious correlations.
GDP per capita
When it comes to studying immigration’s impact on the GDP per capita, inflow of foreign population per capita, unemployment rate and age dependency ratio will be used as the independent variables and GDP per capita will be the dependent variable. Once more, inflow of foreign population per capita is our main focus but more indicators are included for control variables. A theory that explains the correlation between unemployment and GDP is Okun's law, the theory suggest that higher unemployment will lead to lower GDP (Lee, 2000). Unemployment could be used to explain GDP per capita in essence that, higher unemployment causes economic and social costs to the economy. Higher unemployment means more people are being unemployed, meaning there will be less spending from them, less profits for the business then and greater costs for the government due to receiving less taxes and providing unemployment benefits to the unemployed people. Moreover having unemployed people leads to a loss in economic output (Ekmekçioğlu, 2012 )
Another variable that is included in our study since it has an effect on GDP is the age dependency ratio, this measured by dividing the dependent population by the people in working age. The dependent group is defined as those over 64 and under 15. People outside the working age group generally do not work and generate an income but they cost money for the society, so having a higher ratio means a greater burden for the working group in order to support the dependent group (Amadeo, 2019). Through history the age dependency ratio has never been as high as today due to lower fertility rates and longevity (Bloom, & Canning, 2004). Different groups like children, people within the working age and retired people all have different needs and a change in the age structures will therefore have economical effects (Bloom, & Canning, & Fink, 2010).
28
4.1 DESCRIPTIVE STATISTICS
The following tables show the descriptive statistics for the data of both time periods. 4.1.1.1 Table 1.Descriptive Statistics for 1985-2000 (14 countries)
Variables Observations Mean Std.Dev Min Max
Unem 210 0,0769637 0,0410482 0,00474 0,19759
Inflow 218 0,5606977 0,5980306 0,011261 2,735583
GDP 218 331259,24 10115,65 14148 76114
Note. Data for the unemployment rate from (OECD.Stat, 2018), for the inflow of foreign population from (International Migration Database, n.d) and ("Demography - Population - OECD Data", n.d.), for the GDP per capita from ("Gross domestic product (GDP) : GDP per head, US $, constant prices, constant PPPs, reference year 2010", n.d.).
4.1.1.1 Table 2.Descriptive Statistics for 2006-2016 (26 countries)
Variables Observations Mean Std.Dev Min Max
Unem 282 0,0860656 0,0460392 0,0224 0,2747
Inflow 285 0,8327599 0,774504 0,035515 3,967669
GDP 286 37344,41 14245,73 17561 91191
Note. Data for the unemployment rate from ("Unemployment - Unemployment rate - OECD Data", n.d.), for the inflow of foreign population from ("OECD International Migration Database and labour market outcomes of immigrants - OECD", 2018) and ("Population, total | Data", n.d.), for the GDP per capita from ("Gross domestic product (GDP) : GDP per head, US $, constant prices, constant PPPs, reference year 2010", n.d.).
4.1.1.1 Table 3.Descriptive Statistics for 2006-2016 (14 countries)
Variables Observations Mean Std.Dev Min Max
Unem 150 0,076836 0,0409221 0,025 0,2609
Inflow 154 1,021222 0,8251656 0,20463 3,967669
GDP 154 4 382 6,9 14 579 ,75 21 346 91 191
Note. Data for the unemployment rate from ("Unemployment - Unemployment rate - OECD Data", n.d.), for the inflow of foreign population from ("OECD International Migration Database and labour market outcomes of immigrants - OECD",
29
2018) and ("Population, total | Data", n.d.), for the GDP per capita from ("Gross domestic product (GDP) : GDP per head, US $, constant prices, constant PPPs, reference year 2010", n.d.)
4.1 EMPIRICAL RESULTS FOR UNEMPLOYMENT RATE
Table 4 and 5 show the empirical results for the unemployment rate during the two time periods. Column named OLS 1 is the OLS regression having inflow as the only independent variable, OLS 2 column is the OLS regression where all independent variables are included. Fixed effect 1 column is the fixed effect regression having inflow as the only independent variable and fixed effect 2 column is the fixed regression having all independent variables included. The model that will be used to study whether immigration has an effect is fixed effect 2, when the inflow and control variables are included.
4.1.1.1 Table 4. Empirical results for 1985-2000 and 2006-2016 having unemployment rate as the dependent variable.
Note. Data for the unemployment rate from (OECD.Stat, 2018), for the inflow of foreign population from (International Migration Database, n.d) and ("Demography - Population - OECD Data", n.d.), for the GDP per capita from ("Gross domestic product (GDP) : GDP per head, US $, constant prices, constant PPPs, reference year 2010", n.d.).
Variables OLS 1 1985-2000 OLS 2 1985-2000 Fixed Effect 1 1985-2000 Fixed Effect 2 1985-2000 OLS 1 2006-2016 OLS 2 2006-2016 Fixed Effect 1 2006-2016 Fixed effect 2 Inflow ***-0,042 (0,000) **-0,013 (0,017) **-0,029 (0,017) -0,016 (0,208) ***-0,012 (0,000) ***-0,003 (0,276) ***-0,005 (0,003) ***-0,004 (0,008) GDP ***-2,13e-06 (0,000) ***-1,55e -06 (0,009) ***-1,33e-06 (0,000) ***-7,79e-06 (0,000) R squared 0,478 0,568 0,328 0,354 0,192 0,307 0,319 0,527 F-value 0,000 0,000 0,000 0,000 0,000 0,000 0,000 0,000 Number of Obs 207 281 *p-value <0,1 **p-value <0,05 ***p-value <0,01
30
Note. Data for the unemployment rate from ("Unemployment - Unemployment rate - OECD Data", n.d.), for the inflow of foreign population from ("OECD International Migration Database and labour market outcomes of immigrants - OECD", 2018) and ("Population, total | Data", n.d.), for the GDP per capita from ("Gross domestic product (GDP) : GDP per head, US $, constant prices, constant PPPs, reference year 2010", n.d.).
Table 5. Empirical results the control period having unemployment rate as the dependent
variable.
Variables OLS 1 OLS 2 Fixed Effect 1 Fixed Effect 2
Inflow ***-0,0066794 (0,005) -0,0002578 (0,916) ***-0,0041126 (0,004) *-0,0024275 (0,055) GDP ***-1,27e-06 (0,000) ***-1,03e-04 (0,000) R squared 0,1066 0,2638 0,2914 0,4753 F-value 0,1390 0,0000 0,0000 0,0000 Number of Obs 150 *p-value <0,1 **p-value <0,05 ***p-value <0,01
Note. Data for the unemployment rate from ("Unemployment - Unemployment rate - OECD Data", n.d.), for the inflow of foreign population from ("OECD International Migration Database and labour market outcomes of immigrants - OECD", 2018) and ("Population, total | Data", n.d.), for the GDP per capita from ("Gross domestic product (GDP) : GDP per head, US $, constant prices, constant PPPs, reference year 2010", n.d.)
As seen in table 4 for the first time period, the results gotten from OLS 1 and 2 indicated that inflow of foreign population had a negative relationship with unemployment rate and was significant. If the ratio of the inflow of foreign population increases by one percentage point the unemployment rate decreases by 4,2 percentage points in OLS 1 and by 1,3 percentage points in OLS 2. In model OLS 2, GDP per capita had a negative relationship and was as well significant, the result shows that if GDP increases by one dollar, unemployment decrease by 0,00000213 percentage points.
31
The results from table 4 for the second time period indicates that inflow of foreign population had a negative relationship with unemployment rate and was significant in OLS 1. If the ratio of the inflow of foreign population increases by one percentage point the unemployment rate decreases by 1,2 percentage point. In OLS 2 inflow is insignificant, while GDP per capita had a negative relationship and was significant. The result shows that if GDP increases by one dollar, unemployment decrease by 0,00000133 percentage points.
In table 5, the results gotten from the OLS 1 was that having inflow as the only explanatory variable made the model insignificant overall due to the F-value being insignificant. When adding GDP per capita as a independent variable the F-value becomes significant. In OLS 2 inflow of foreign population had no significant effect on unemployment rate, while GDP per capita had a negative significant effect. If the GDP per capita increases by one dollar, the unemployment rate decreases by 0,00000127 percentage points.
The equation representing the data for the fixed effect model is as follows
where: i=1,2,3...14, representing each country t= , representing the years studied
α= a dummy variable for each country u= a dummy variable for time
Inflow= inflow of foreign population per capita GDP= GDP/capita
ε= error term
Fixed effect 1for the first time period, indicates that inflow has a negative relationship with unemployment rate and is significant. As the ratio of the inflow of foreign population increases by 1 percentage point the unemployment rate decreases by 2,9 percentage points. In Fixed effect 2 the inflow becomes insignificant, while the GDP per capita had a significant and a negative relationship with unemployment rate, with a 0,00000155 percentage point decrease for unemployment as GDP per capita increase by 1 percent point.
32
When studying the immigration's effect on the unemployment rate, the OLS model indicated that the inflow of foreign population had a significant effect on the unemployment rate, while it had a significant effect in the fixed effect model 1 but not in fixed effect model 2. This can be explained by the fact that OLS takes into account the differences between the countries while the fixed effect takes into account the differences within the country itself, which means that immigration does not have an effect on the receiving countries unemployment rate. This indicates that immigration had no significant effect on unemployment rate for the 14 OECD countries during the time period 1985-2000, when GDP per capita was used as a control variable.
Fixed effect 1 and 2 for the second time period, both show that inflow had a significant effect with a negative relationship with unemployment rate. If the inflow ratio increases by one percentage point then unemployment decreases by 0,52 percentage point in fixed effect 1 and unemployment rate decreases by 0,39 percentage points in fixed effect 2. The control variable GDP increases has a significant effect with a negative relationship, if GDP increase by one dollar then unemployment rate decreased by 0,00000779 percentage points.
When studying the immigration's effect on the unemployment rate, the OLS model 2 indicated that the inflow of foreign population had no significant effect on the unemployment rate, while it had a significant effect in the fixed effect model 2. This can be explained by the fact that OLS takes into account the differences between the countries while the fixed effect takes into account the differences within the country itself, which means that immigration does have an effect on the receiving countries unemployment rate. This indicates that immigration led to a lower unemployment rate for the 26 OECD countries during the time period 2006-2016.
In fixed effect 1 and 2 in table 5, inflow appeared to be significant and had a negative sign meaning that there is a negative relationship between immigration and unemployment rate. If the inflow ratio increases by one percentage point, then unemployment decreases by 0,41 percentage points in fixed effect 1 and 0,24 percentage points in fixed effect 2. GDP per capita has significant effect on unemployment in fixed effect 2 and a negative relation,
33
indicating that if GDP increase by one dollar, unemployment rate decreases by 0,000103 percentage points.
When studying the immigration's effect on the unemployment rate, the OLS 2 model indicated that the inflow of foreign population had no significant effect on the unemployment rate, while it had a significant effect in the fixed effect 2 model. This indicates that immigration led to a lower unemployment rate for the 14 OECD countries during the time period 2006-2016, which is the same result as we obtained from all 26 countries in the same time period.
4.2 EMPIRICAL RESULTS FOR GDP PER CAPITA
Tables 6, 7 and 8 show the descriptive statistics. Table 9 and 10 show the empirical results for the GDP per capita during the two time periods. The column OLS 1 is the OLS regression having inflow as the only independent variable, OLS 2 column is the OLS regression where inflow and unemployment rate are included and OLS 3 column is the OLS regression when all independent variables are included. Fixed effect 1 column is the fixed effect regression having inflow as the only independent variable and fixed effect 2 column is the fixed regression having all independent variables included. The model that will be used to study whether immigration has an effect is fixed effect 2, when the inflow and control variables are included.
4.2.1.1 Table 6. Descriptive Statistics for 1985-2000 (14 countries)
Variables Observations Mean Std.Dev Min Max
GDP 218 33159,24 10115,65 14148 76114
Inflow 218 0,5606977 0,5980306 0,0112361 2,735583
Unem 210 0,0769637 0,0410482 0,00474 0,19759
Age 224 0,4958637 0,0357261 0,4347918 0,5716494
Note. Data for the GDP per capita from ("Gross domestic product (GDP) : GDP per head, US $, constant prices, constant PPPs, reference year 2010", n.d.), for the inflow of foreign population from (International Migration Database, n.d) and ("Demography - Population - OECD Data", n.d.), for the unemployment rate from (OECD.Stat, 2018), for the age dependency ratio from ("Age dependency ratio (% of working-age population) | Data", 2017).
34
Table 7. Descriptive Statistics for 2006-2016
Variables Observations Mean Std.Dev Min Max
GDP 286 37344,41 14245,73 17561 91191
Inflow 285 0,8327599 0,774504 0,035515 3,967669
Unem 282 0,0860656 0,0460392 0,0224 0,2747
Age 286 0,4947891 0,0436275 0,3845168 0,6005243
Note. Data for the GDP per capita from ("Gross domestic product (GDP) : GDP per head, US $, constant prices, constant PPPs, reference year 2010", n.d.), for the inflow of foreign population from ("OECD International Migration Database and labour market outcomes of immigrants - OECD", 2018) and ("Population, total | Data", n.d.), for the unemployment rate from ("Unemployment - Unemployment rate - OECD Data", n.d.), for the age dependency ratio from ("Age dependency ratio (% of working-age population) | Data", 2017).
Table 8. Descriptive statistics for the control period
Variables Observations Mean Std.Dev Min Max
GDP 154 43826,9 14579,75 21346 91191
Inflow 154 1,021222 0,8251656 0,20463 3,967669
Unem 150 0,076836 0,0409221 0,025 0,2609
Age 154 0,5129027 0,0367122 0,436207 0,6005243
Note. Data for the GDP per capita from ("Gross domestic product (GDP) : GDP per head, US $, constant prices, constant PPPs, reference year 2010", n.d.), for the inflow of foreign population from ("OECD International Migration Database and labour market outcomes of immigrants - OECD", 2018) and ("Population, total | Data", n.d.), for the unemployment rate from ("Unemployment - Unemployment rate - OECD Data", n.d.), for the age dependency ratio from ("Age dependency ratio (% of working-age population) | Data", 2017).
4.2.1.2 Table 9. Empirical results for 1985-2000 and 2006-2016 having GDP per capita as the dependent variable.
Variabl es
OLS 1 OLS 2 OLS 3 Fixed
Effect 1 Fixed Effect 2
OLS 1 OLS 2 OLS 3 Fixed
effect 1
Fixed effect 2
35
Note. Data for the GDP per capita from ("Gross domestic product (GDP) : GDP per head, US $, constant prices, constant PPPs, reference year 2010", n.d.), for the inflow of foreign population from (International Migration Database, n.d) and ("Demography - Population - OECD Data", n.d.), for the unemployment rate from (OECD.Stat, 2018), for the age dependency ratio from ("Age dependency ratio (% of working-age population) | Data", 2017).
Note. Data for the GDP per capita from ("Gross domestic product (GDP) : GDP per head, US $, constant prices, constant PPPs, reference year 2010", n.d.), for the inflow of foreign population from ("OECD International Migration Database and labour market outcomes of immigrants - OECD", 2018) and ("Population, total | Data", n.d.), for the unemployment rate from ("Unemployment - Unemployment rate - OECD Data", n.d.), for the age dependency ratio from ("Age dependency ratio (% of working-age population) | Data", 2017).
Table 9 for the first time period illustrates that inflow of foreign population has a significant effect and positive relationship with GDP per capita in OLS 1, 2 and 3. In OLS 1, if the
1985-2000 1985-2000 1985-2000 1985-2000 1985-2000 2006-2016 2006-2016 2006-2016 2006-2016 2006-2016 Inflow ***131 55,15 (0,000) ***1331 3,4 (0,000) ***141 97,09 (0,000) ***767 8,536 (0,000) ***8345, 423 (0,000) ***694 1,285(0 ,000) ***5595, 424 (0,000) ***5626, 533 (0,000)) 165,852 (0,179) -14,064 (0,893) Unem 0,281531 3 (0,711) 0,45942 46 (0,531) -0,070269 5 (0,826) *** -106877,3 (0,000) ***-101914,8 (0,000) ***-39730,63 (0,000) Age ***472 38,25 (0,000) ***5365 9,96 (0,000) ***5085 6,43 (0,002) ***2147 7,54 (0,007-9 R squared 0,676 0,691 0,715 0,691 0,711 0,326 0,417 0,438 0,273 0,509 F-value 0,0000 0,000 0,000 0,000 0,000 0,000 0,000 0,000 0,000 Numbe r of obs 215 207 215 207 285 281 285 281 *p-value <0,1 **p-value <0,05 ***p-value <0,001
36
inflow ratio increase by one percentage point, GDP per capita increase by 13155,15 dollars, by 13313,4 dollars in OLS 2 and by 14197,09 dollars in OLS 3. In OLS 2 and 3 unemployment rate is insignificant. Age in OLS 3 is significant and has a positive relationship with GDP per capita, meaning that if age dependency ratio increase by one percentage point, GDP per capita increases by 472,383 dollars.
Table 9 for the second time period, illustrates that inflow of foreign population has a significant effect and positive relationship with GDP per capita in OLS 1, 2 and 3. In OLS 1, if the inflow ratio increases by one percentage point, GDP per capita increase by 6941,285 dollars, by 5595,424 dollars in OLS 2 and by 5626,533 dollars in OLS 3. In OLS 2 and 3 unemployment rate is significant with a negative relationship, if unemployment rate increases by one percentage point, GDP per capita decreases by 1068,773 dollars in OLS 2 and by 1019,148 dollars in OLS 3 . Age in OLS 3 is significant and has a positive relationship with GDP per capita, meaning that if age dependency ratio increases by one percentage point, GDP per capita increases by 508,5643 dollars.
Table 10. Empirical results for the control period having GDP per capita as the dependent variable.
Variables OLS 1 OLS 2 OLS 3 Fixed Effect 1 Fixed Effect 2
Inflow ***5117,467 (0,000) ***4139,084 (0,000) ***3557,856 (0,000) **159,6947 (0,026) 59,80995 (0,342) Unem ***-138835,7 (0,000) ***-146378,2 (0,000) ***-24996,27 (0,000) Age ***-86394,2 (0,004) -856,6768 (0,888) R squared 0,2463 0,3753 0,4126 0,4450 0,5992 F-value 0,0000 0,0000 0,0000 0,0000 0,0000 Number of obs 154 150 154 150 *p-value <0,1 **p-value <0,05
37
***p-value <0,001
Note. Data for the GDP per capita from ("Gross domestic product (GDP) : GDP per head, US $, constant prices, constant PPPs, reference year 2010", n.d.), for the inflow of foreign population from ("OECD International Migration Database and labour market outcomes of immigrants - OECD", 2018) and ("Population, total | Data", n.d.), for the unemployment rate from ("Unemployment - Unemployment rate - OECD Data", n.d.), for the age dependency ratio from ("Age dependency ratio (% of working-age population) | Data", 2017).
In table 10, the inflow ratio has a significant effect and a positive relationship with the GDP per capita in OLS 1,2 and 3. If inflow increase by one percentage point, GDP per capita increases by 5117,467 dollar in OLS 1, by 4139,084 dollars in OLS 2 and by 3557,856 dollars in OLS 3. Unemployment rate in OLS 2 and 3 is significant and has a negative relationship with GDP per capita. If unemployment rate increase by one percentage point, GDP per capita decreases by 1388,357 dollars in OLS 2, and by 1463,782 dollars in OLS 3. Age dependency ratio in OLS 3 is significant and has a negative relationship with GDP per capita, if age increases by one percentage point, GDP per capita decreases by 863,942 dollars in OLS 3.
The equation representing the data for the fixed effect model is as follows
where: i=1,2,3….14 representing each country t= representing the years studied
α= a dummy variable for each country u= a dummy variable for time
Inflow= inflow of foreign population per capita Age= age dependency ratio
Unem= unemployment rate ε= error term
Looking in table 9, for the first time period, in fixed effect 1 and 2 inflow has a positive relationship with GDP per capita and is significant. In the fixed effect model 1, if inflow
38
increases by 1 percentage point then GDP per capita increases by 7678,536 dollars and by 8345,423 dollars in fixed effect 2. When all the variables are included in the model inflow and age are significant, while unemployment rate becomes insignificant. If age dependency ratio increases by 1 percentage point, GDP per capita increases by 536,5996 dollars, in fixed effect 2.
As the effect of immigration on GDP per capita is studied, the OLS model and fixed effect model shows that inflow of foreign population had a significant effect.
For the second time period, the results shown in table 9 from the fixed effect model 1 and 2 shows no significant effect of the inflow ratio on GDP per capita, while unemployment and age have a significant effect. If unemployment rate increases by then GDP per capita decreases by 397,306 dollars. If age dependency ratio increases by one percentage point, GDP per capita increases by 214,7754 dollars.
As the effect of immigration on GDP per capita is studied, the OLS models shows that inflow of foreign population had a significant effect, while the inflow does not have a significant effect in the fixed effect models. As mentioned above the OLS takes into account the differences between the countries while the fixed effect takes into account the differences within the country itself, which means that the inflow did not have a significant effect on the 26 OECD countries GDP per capita during the time period 2006-2016.
In table 10, for the fixed effect model 1 inflow has a significant effect on GDP per capita and a positive relationship, with an increase of 159,695 dollars if inflow goes up by one percentage point. Inflow in fixed effect 2 is insignificant. Unemployment rate is significant for fixed effect 2 model, with a decrease of 249,963 dollars for a one percentage point increase in unemployment rate. Age dependency ratio became insignificant in fixed effect model 2.
As the effect of immigration on GDP per capita is studied, the OLS models shows that inflow of foreign population had a significant effect, while the inflow does not have a significant effect in the fixed effect model 2. As mentioned above the OLS takes into account the differences between the countries while the fixed effect takes into account the differences
39
within the country itself, which means that the inflow did not have a significant effect on the 14 OECD countries GDP per capita during the time period 2006-2016, which is same result as obtained when all 26 countries are studied for the same time period.
Overall, this study found either that immigration impacted the unemployment rate and GDP per capita of the host country positively as Boubtane, Coulibaly and Rault (2013) found in their study for OECD countries for the period of 1987-2009 or that the impact of immigrants had no significant effect on the economic indicators. The result found in this research paper is in line with the existing theory that have been discussed in the literature review.
5. CONCLUSION
The aim of this study was to analyse the economic impact of immigration on the European OECD countries, more specifically how the inflow of foreigners impact the unemployment rate and GDP per capita. Two different time periods that were characterized by high number of immigrants to Europe were examined, one of them being 1985-2000 and the other 2006-2016. During the first time period (1985-2000) when 14 countries where included, immigration had no significant effect on the unemployment rate, while in the second time period (2006-2016) immigration had an effect on the unemployment rate, with a one percent increase in inflow, unemployment rate increased by 0,39 percentage point. When it comes to GDP per capita, during the first time period, immigration had an effect on it, with a one percent increase of inflow, GDP per capita increased by 8345,423 dollars. During the second time period, immigration had an insignificant effect on the GDP per capita.
The existing theories on the subject has been controversial and not unified throughout the years. Some economists found a negative effect of immigration, some others positive while some others no effect. Many researchers, economists, politicians and even people that have no expertise on this subject have been discussing the outcome of immigration and have had different point of views. Therefore, one cannot say that immigration negatively or positively affect the receiving countries rather that it all depends on the country’s and immigrants’ characteristics. This study relates very much to the theory as the results varied over different time periods, for instance during 1985-2000 immigration had no significant effect in unemployment rate while in the later time period it had an effect. The same results can be