for statistics on generation and recovery
and disposal of waste in Sweden 2004
according to EU Regulation on Waste
Statistics 2150/2002
for statistics on generation and recovery and disposal of waste in Sweden 2004 according to EU Regulation on Waste Statistics 2150/2002
15-06-2006
SWEDISH ENVIRONMENTAL PROTECTION AGENCY
Orders
Phone: + 46 (0)8-505 933 40 Fax: + 46 (0)8-505 933 99
E-mail: natur@cm.se
Address: CM-Gruppen, Box 110 93, SE-161 11 Bromma, Sweden Internet: www.naturvardsverket.se/bokhandeln
The Swedish Environmental Protection Agency Phone: + 46 (0)8-698 10 00, Fax: + 46 (0)8-20 29 25
E-mail: natur@naturvardsverket.se
Address: Naturvårdsverket, SE-106 48 Stockholm, Sweden Internet: www.naturvardsverket.se
ISBN 91-620-5594-1 ISSN 0282-7298
Preface
The Regulation of the European Parliament and the Council No 2150/2002 of 25 November 2002 on waste statistics contains rules for the reporting of waste statis-tics to the EU. Reporting according to the regulation is to take place every second year. Reporting shall be submitted each time 18 months after the end of the report-ing period. The first reportreport-ing is to be submitted by 30 June 2006 at the latest. This report contains the quality declaration for the data reported in June 2006, referring to the generation of waste and the recovery and disposal of waste during 2004. The report is produced by the consortium SMED by order of the Swedish Environmental Protection Agency.
Table of contents
PREFACE 3
INTRODUCTION AND GUIDELINES 9
General information on the EU Regulation on Waste Statistics 9
Report description 10
PART I
DESCRIPTION OF THE DATA 11
Identification 11
Contact person 11
Organisation of reporting 11 General description of methods used 13 General information on the scope and limitations of the statistics 14
Overview of methods 17
Investigation regarding Agriculture, hunting and
forestry (NACE A) and fishing (NACE B) 22 Survey regarding Mining and quarrying (NACE C)
and Manufacturing (NACE D): 22 Survey regarding Electricity, gas and water supply (NACE E) 22 Survey regarding Construction (NACE F) 22 Survey regarding Services (NACE G-Q excluding 51.57 and 90) 23 Survey regarding Recycling (NACE 37) 23 Survey regarding Wholesale of waste and scrap (NACE 51.57) 23 Survey regarding Dismantling of end-of-life-vehicles
within NACE 37 and NACE 51.57 24 Survey regarding Sewage and refuse disposal,
sanitation and similar activities (NACE 90) 24 Survey regarding waste generated by households 24 Changes since the previous reference year 25 Expected changes to the 2008 reporting on 2006 25
PART II QUALITY ATTRIBUTES 26 1 Relevance 26 2 Accuracy 27 2.1 Sampling errors 30 2.2 Non-sampling errors 30 3 Timeliness 38
4 Accessibility and clarity 39
5 Comparability 39
5.1 Comparability with other member states and between sectors 39 5.2 Regional comparability of waste treatment 40 5.3 Comparability over time 40
6 Coherence 41
7 Burden on respondents 41
DEFINITIONS, UNITS AND ABBREVIATIONS 43
APPENDIX 1
AGRICULTURE, HUNTING AND FORESTRY (NACE A) AND
FISHING (NACE B) 46
APPENDIX 2
MINING AND QUARRYING (NACE C) AND MANUFACTURING (NACE D) 48
1 Sources 48
2 Accuracy of data 49
2.1 Sampling errors 49
2.2 Non-sampling errors 49
5 Comparability 59
5.2 Regional comparability of waste treatment 59
APPENDIX 3
ELECTRICITY, GAS, STEAM, HOT WATER AND WATER SUPPLY (NACE E) 61
1 Sources 61
1.1 Enterprises with energy production from combustion 61 1.2 Nuclear power plants 62
1.3 Manufacture of gas 62
1.4 Hydroelectric power stations 62
1.5 Wind power stations 62
1.6 Electricity network enterprises 62 1.7 Electricity trade enterprises 63
1.8 Water supply 63
1.9 Household waste generated by the whole industry 63
2 Accuracy of data 63
2.1 Sampling errors 63
2.2 Non-sampling errors 63
5 Comparability 71
5.2 Regional comparability of waste treatment 71
APPENDIX 4 CONSTRUCTION(NACE F) 73 1 Sources 73 2 Accuracy of data 73 2.1 Sampling errors 74 2.2 Non-sampling errors 74 5 Comparability 75
APPENDIX 5 SERVICES (NACE G-Q) 76 1 Sources 76 2 Accuracy of data 77 2.1 Sampling errors 77 2.2 Non-sampling errors 77 5 Comparability 79
5.2 Regional comparability of waste treatment 79
APPENDIX 6 RECYCLING (NACE 37) 80 1 Sources 80 2 Accuracy of data 80 2.1 Sampling errors 80 2.2 Non-sampling errors 81 5 Comparability 84
5.2 Regional comparability of waste treatment 84
APPENDIX 7
WHOLESALE OF WASTE AND SCRAP (NACE 51.57) 85
1 Sources 85
2 Accuracy of data 85
2.1 Sampling errors 85
2.2 Non-sampling errors 86
5 Comparability 89
5.2 Regional comparability of waste treatment 89
APPENDIX 8
DISMANTLING OF END-OF-LIFE-VEHICLES WITHIN NACE 37 AND 51.57 90
1 Sources 90
2 Accuracy of data 90
2.1 Sampling errors 90
2.2 Non-sampling errors 91
5 Comparability 92
5.2 Regional comparability of waste treatment 92
APPENDIX 9
COLLECTION AND TREATMENT OF SEWAGE (NACE 90.01) 93
1 Sources 93
2 Accuracy of data 93
2.1 Sampling errors 93
2.2 Non-sampling errors 93
5 Comparability 95
APPENDIX 10
COLLECTION AND TREATMENT OF OTHER WASTE (NACE 90.02) 96
1. Sources 96
2 Accuracy of data 97
2.1 Sampling errors 97
2.2 Non-sampling errors 97
5 Comparability 100
5.2 Regional comparability of waste treatment 100
APPENDIX 11
SANITATION AND RELATED ACTIVITIES (NACE 90.03) 101
1 Sources 101
2 Accuracy of data 101
2.1 Sampling errors 101
2.2 Non-sampling errors 101
5 Comparability 102
5.2 Regional comparability of waste treatment 102
APPENDIX 12 HOUSEHOLDS 103 1 Sources 103 2 Accuracy of data 104 2.1 Sampling errors 104 2.2 Non-sampling errors 104 5 Comparability 106
5.2 Regional comparability of waste treatment 106
APPENDIX 13
RECOVERY AND DISPOSAL OF WASTE 107
1 Sources 107
2 Accuracy 108
2.1 Sampling errors 108
2.2 Non-sampling errors 108
5 Comparability 112
5.2 Regional comparability of waste treatment 112
APPENDIX 14
UNCERTAINTY ESTIMATES OF KEY AGGREGATES 113
1 Uncertainty in the questionnaire surveys 113 2 Uncertainty in other sources 113 3 List of uncertainties in key aggregates 114
Introduction and guidelines
General information on the
EU Regulation on Waste Statistics
The Regulation of the European Parliament and the Council No 2150/2002 of 25 November 2002 on waste statistics (hereafter referred to as "the waste statistics regulation" or "WStatR"1) contains rules for the reporting of waste statistics to the EU2. Reporting according to the regulation is to take place every second year. Reporting shall be submitted each time 18 months after the end of the reporting period. The first reporting is to be submitted by 30 June 2006 at the latest and should refer to the generation of waste and the recovery and disposal of waste during 2004. The regulation contains three annexes that describe in more detail what should be reported:
Annex I: The generated quantities of waste are to be reported for a total of 20
different sectors including
• all economic activities (sections A-Q according to NACE Rev.1 or SNI 2002)
• waste arising from recovery and/or disposal operations • waste generated by households.
The generation of waste for these 20 sectors should be given according to the waste classification EWC-Stat. EWC-Stat is a special material-based waste classification that is founded on the usual waste listings. There are a total of 48 different types of waste in EWC-Stat.
Annex II: The treatment of waste is to be reported by waste amount for the
different types of waste according to EWC-Stat and method of treatment. The method of treatment relates to various recovery and disposal operations3 (also called R and D operations). These are compiled into 5 different groups:
1) Incineration: Use principally as a fuel or other means to generate energy 2) Incineration: Incineration on land
3) Recovery excluding energy recovery
4) Disposal operations: depositing, deep injection, impoundment, permanent storage
5) Disposal operations: land treatment, release into water
1
WStatR refers in this context to the Waste Statistics Regulation
2
An "EU regulation" implies that the legislation is immediately applicable in all member states (in con-trast to a directive which becomes applicable in every member state only once it has been incorporated into the country's own legislation).
3
Processes for recovery and disposal are defined in Annexes 4 and 5 of the Swedish Waste Ordinance (2001:1063) and in Annexes IIA and IIB of the EU Framework Directive on Waste (1975/442/EEC). The different recovery processes are classified as R1 to R13 (R stands for Recovery) and there are 16
Certain recovery and disposal operations that constitute pre-treatment should not be reported.
According to Annex II, the number of treatment facilities and the capacity for different treatments should also be reported regionally according to NUTS 2 (i.e. 8 aggregates of counties for Sweden).
Annex III presents a division of the types of waste according to EWC-Stat.
Report description
The following report constitutes one part of the obligatory delivery to the EU. According to the waste statistics regulation, every member state should submit a report on the coverage and quality of the statistics. The report is also published in Sweden in Swedish for Swedish users of statistics. The contents and structure of the report have been determined by the European Commission in a specific regula-tion4. The report is structured in conformity with this regulation.
The report is divided into three parts:
• Part 1: Description of the data. This part contains primarily - General information, for example, on the responsibility and
organisation of the reporting
- General description of the methods used. An overview of how the data have been produced
• Part II: Quality attributes. This part includes a description of the various aspects that affect the quality of the produced data, in particular, in relation to Section 2 Accuracy. The headings are taken from the Euro-pean Commission's regulation on the contents of quality reports. • Appendices to Part II: A more detailed description of the more
impor-tant quality attributes of the sub-surveys that were carried out.
4
COMMISSION REGULATION (EC) No 1445/2005 of 5 September 2005, defining the proper quality evaluation criteria and the contents of the quality reports for waste statistics for the purposes of Regula-tion (EC) No 2150/2002 of the European Parliament and of the Council
Part I
Description of the data
This part deals first with some obligatory formal details. This is followed by a general description of the methods used to compile the data.
Identification
Country: Sweden Reference year: 2004 Datasets: WASTE_GENER_A2_SE_2004_0000 WASTE_INCIN_A2_SE_2004_0000 WASTE_RECOV_A2_SE_2004_0000 WASTE_DISPO_A2_SE_2004_0000 WASTE_REGIO_A2_SE_2004_0000 Transmission date: 20-06-2006Contact person
Name: Helena Looström Urban Telephone: +46 8 698 10 00
E-mail: helena.loostrom.urban@naturvardsverket.se Organisation: Swedish Environmental Protection Agency
SE-106 48 Stockholm, Sweden
For the 2006 reporting, Sweden has been granted derogations for the reporting regarding the generation of waste in NACE A, NACE B and NACE G-Q (excluding 51.57 and 90).
Organisation of reporting
There are a number of laws and regulations governing the work with waste statis-tics. The European Union's waste statistics regulation (WStatR) relates directly to this as well as the Swedish Official Statistics Act and Ordinance5. The waste statis-tics regulation governs the contents, reporting frequency and format of the statisstatis-tics to be re-ported to the EU. The Swedish Ordinance on official statistics allocates responsibility for the official statistics on waste to the Swedish Environmental Protection Agency as well as the right of decision-making on the scope and content of the statistics.
Adjacent legislation and conventions that primarily indirectly govern the responsi-bility of the Swedish Environmental Protection Agency relating to statistics pro-duction and reporting include the Secrecy Act6, the Personal Data Act7, Ordinance concerning government authorities' collection of data8, the SimpLex Ordinance9 and also the Århus Convention10 regarding data on emissions. According to this convention, data on emissions should not be confidential. Enterprises' obligations to document waste management for the purposes of environmental protection are primarily governed by the Environmental Code11 and the Waste Ordinance12, the ordinance on environmentally harmful operations and environmental protection13 and others.
In addition to these, there are several other directives and ordinances in the field of waste that govern Sweden's commitments regarding international reporting, includ-ing statistics and data on waste14.
With the aim of complying with the reporting according to the waste statistics regulation and of supplying cost-effective national waste data, Sweden has organ-ised the work into two semi-parallel phases:
• In preparation for the reporting in 2006 and 2008, the development of methodologies and an inventory of waste flows according to the format requirements in the waste statistics regulation. Data collection has been based on statistical legislation and has been optional for enterprises. • In preparation for the reporting in 2010, the analysis and development of
a waste reporting system. The aim is to produce good quality statistics to enable the follow-up of waste issues in environmental policies both na-tionally and internana-tionally, the implementation of measures within the national strategy for a non-toxic and resource-effective ecocycle, the minimising of the burden on respondents, a reduction in the costs to soci-ety and, as far as possible, the capacity to utilise the same data for both national and international purposes.14
In Sweden, the Swedish Environmental Protection Agency is responsible for producing, publishing and reporting national waste statistics. The Swedish Envi-ronmental Protection Agency has a framework agreement with the SMED
6
Secrecy Act (1980: 100) and the Secrecy Ordinance 1980
7
Personal Data Act (1998:204)
8
SFS 1982:668 Ordinance concerning government authorities collection of data
9
Simplex ordinance SFS 1998:1820, Ordinance on individual analysis of consequences of the effect of legislation on conditions for small enterprises
10 Århus Convention Ds 2004:29 11 Environmental Code 1998:808 12 Waste Ordinance (2001:1063) 13
Ordinance on environmentally harmful operations and environmental protection (1998:899)
14
How to produce better and cheaper waste statistics? Preliminary study on Swedish reporting systems for waste data, Swedish Environmental Protection Agency, Report 5530:Dec 2005.
tium (Swedish Methodology for Environmental Data)15 for the provision of services regarding data collection, statistics production and the development of methodology for reporting activities. The waste statistics with accompanying documentation have been produced by SMED.
In preparation for the 2006 reporting, the work has been organised as follows:
For the reporting according to the waste statistics regulation, a quality system has been developed covering the areas of responsibility for SMED16 and the Swedish Environ-mental Protection Agency17. These ensure the possibility to repeat and trace the work carried out.
General description of methods used
The statistics on the generation of waste and the recovery and disposal of waste are based on a comprehensive inventory of waste flows in Sweden. A variety of meth-ods have been used: questionnaire surveys, waste factors, calculation models and expert assessments. An overall description of the scope and limitations of the inventory is given below. There is also a general overview of the methods applied, with reference to the appendices where more detailed information on the various sub-surveys can be found.
15
The consortium consists of the Swedish Meteorological and Hydrological Institute (SMHI), the Swed-ish University of Agricultural Sciences (SLU), the SwedSwed-ish Environmental Research Institute (IVL) and Statistics Sweden.
16
Manual for SMED's Quality System for waste reporting according to WStatR, 2006-04-10
17
Swedish Environmental Protection Agency Quality Manual for reporting of waste statistics according
SMED
The Swedish Association of Waste Manage-ment
Other industry organisations
Board of Swedish Industry and Commerce for Better Regulation
Association of Local Authorities and Regions County Administrative Boards
Local authorities
Environmental Protection Agency Respondents
questionnaire surveys
SMED Waste Coordinator
Project leader and coordination team Sub-projects led by sub-project leaders Swedish Envi-ronmental Protection Agency Development project EMIR
Statistics Sweden’s Business Register Statistics Sweden’s Energy Unit Industry experts
Development project
General information on the scope and limitations of the statistics
SECTORS AND HOUSEHOLDS
The statistics cover the generation of waste in all economic sectors and households, with the exception of certain parts of the service sector (NACE G-Q excluding 51.57 and 90) and the agriculture, hunting and forestry sector (NACE A) and fish-ing sector (NACE B). They cover waste activities of both small and large enter-prises. In Sweden, there are 800 000 enterprises and slightly under 5 million households.
WASTE GENERATION AND DEFINITIONS OF WASTE
Waste is, according to Sweden's national encyclopaedia, all remains that are considered to lack any utility value. However, that which is considered waste differs among the different sectors of society. In EU legislation, waste is any item that the owner of the item wishes to get rid of, regardless of its value. The EU's waste definition18 is repeated in the Swedish Environmental Code19 and reads:
Waste shall mean any substance or object included in one of the waste catego-ries and which the holder discards or intends or is required to discard20.
The EU's definition of waste has also been judged in several cases in the European Court of Justice (ECJ). On the basis of these judgements, the following conclusions can be drawn:
• A material can be waste even if it has an economic value21 .
• By-products are, in many cases, waste. Only when a by-product is pro-duced deliberately rather than unintentionally can it be declassified22. • In conjunction with recycling, waste ceases to be waste first when it has
become a new product in the process23. These points are developed further below.
Within the EU, a list of waste has also been compiled24. This list is also found as Annex 2 in the Swedish Waste Ordinance25. The list contains close to 850 different types of waste and also indicates the various types of waste that should be classi-fied as hazardous. The list of waste also specifies a number of criteria for assessing whether waste should be classified as hazardous.
18
Council Directive 15 July 1975 on waste (75/442/EEC)
19
Environmental Code 1998:808, Chapter 15, § 1
20
Annex 1 in the Swedish Waste Ordinance (2001:1063) lists 16 different waste categories, Q1 to Q16.
21
The ECJ's ruling in the combined cases C-206/88 and C-207/88, Vessoso and Zanetti (REG 1990, s. I-1461), point 9
22
ECJ ruling C-457/02 (Niselli); ECJ ruling C-235/02 (Saetti & Frediani)
23
ECJ ruling C- 444/00 (Mayer Parry)
24
COMMISSION DECISION of 3 May 2000 (2000/532/EEC)
25
In this survey, we have applied the definition of waste broadly. At the same time,
we have experienced that respondents (those generating and treating waste) do not, in practice, interpret the definition in the same way. Drawing a line between a by-product and waste is difficult, particularly when the waste/by-product is recy-cled or sold. The statistics therefore cover many waste types/by-products from
industrial processes which are not understood as waste in the daily industrial op-erations, or in general. One example of this is sawdust and other wood waste from sawmills, and also metal scrap.
In this survey, we have often interpreted these borderline cases as waste. A differ-ent interpretation of the concept of waste in these cases would give a significantly different result in the waste statistics.
Generated waste quantities may be counted twice when the waste first appears as one type of waste and then, after some treatment, the quantity of material is trans-formed into another type of waste. An example of this: 258 000 tonnes of discarded vehicle (hazardous waste) that, after dismantling of the hazardous parts, generates 219 000 tonnes of discarded vehicle (non-hazardous waste). The quantity of waste generated in these statistics is not therefore a measurement of the primary waste generated in society as a result of consumption and production. It is instead a gross sum of both primary waste and secondary waste generated, where the latter is a result of waste treatment.
INTERPRETATION OF WASTE AND BY-PRODUCTS
The ECJ ruling in the case Saetti & Frediani (C-235/02) states that it is not necessary to classify a by-product as waste if the production (generation) of the by-product is the result of a technical choice and the by-product is not necessarily produced in the actual process. This means that the by-product does not necessarily have to be generated by the actual process but it has been chosen to generate this product because of its market value. In the survey, it has usually been difficult to determine when a by-product is generated "voluntarily" or "necessarily". We have in general applied a fairly strict interpretation. For example, the following "by-products" (occurring in large quantities) have been classified as waste:
• Wood waste from sawmills. This is sold to heating plants or the pulp industry.
• Metal waste (scrap) from the metal industry. This is sold to the scrap industry (normally in NACE 37 or 51.57), who then sell it on to metal works (NACE 28).
• Excavated material. The majority of excavated material dug-up during construction or foundation projects is reused in other construction projects.
INTERPRETATION OF RECYCLING AND RECOVERY
The ECJ case Mayer Parry (C-444/00) states that waste ceases to be waste first when it becomes a new product. We have interpreted this so that recycling is the moment when waste becomes a new product. Previously, the general interpretation has been that waste ceases to be waste when it can be used as a raw material in a manufacturing process. When looking at recyclable paper, for example, waste paper can be considered waste until it has become new pulp or new paper at a pulp/paper factory. This means that pre-treatment, sorting, etc. does not constitute recycling. Sorting and such like occurs within NACE 37 Recycling but one conse-quence of the Mayer-Parry case is that recycling no longer occurs in practice within NACE 37 but most commonly within the manufacturing industry (NACE D).
The concepts of recycling and recovery also include the production of soil improvement fertilisers from composting or anaerobic digestion. The use of ashes, slag, mineral waste as construction materials in roads, for example, is also included in recycling and recovery. This is also the case when various by-products are used as material for the coverage and packing of landfill sites. In all these cases, the waste is considered to replace another material.
When reporting recovery, we have included only the "final" recovery or "final" recycling when the waste becomes a new product, not pre-treatment and sorting. This interpretation ensures that recovery is not reported twice, as one particular waste flow is only reported once in the statistics on the recovery of waste.
LANDFILLING
Waste from mining is included in the survey in the Sector Mining and quarrying (NACE C). Some of the waste from mining is used in various ways to restore the mining pits (terracing, landscaping and such like). We have classified this as de-positing D1.
IMPORTS AND EXPORTS
Statistics do not cover imports and exports of waste. However imported waste quantities can be seen as a subset of the statistics when the waste is treated in Sweden.
KEY AGGREGATES AND AGGREGATION OF SLUDGE AND DREDGING SPOILS
According to the waste statistics regulation, a number of summations and aggrega-tions of types of wastes shall be calculated. In the Swedish statistics these have been done as follows:
• In the Key Aggregates, the amounts of all types of waste are included in their normal wet condition. This is also the case for the types of waste Industrial effluent sludges (03.2) and Common sludges (11).
• In the summations of “total hazardous waste”, “total non-hazardous waste” and “total amount of waste”, the amounts of all types of waste are
included in their normal wet condition. This is also the case for the types of waste Indus-trial effluent sludges (03.2) and Common sludges (11). • In the tables for incineration and disposal of waste, the type of waste 11,
Common sludges including dredging spoils (11.3), is included. Both the amount in normal wet condition and the quantity of dry matter content should be reported. In the given wet weight, both sludge and dredging spoils are included in wet condition. In the dry matter content, the amount of dry common sludges (excluding dredging spoils) and an esti-mated dry matter content of dredging spoils are included. The dry matter content for dredging spoils has, on good grounds, been assumed to be 7.5% of the wet dredging spoils.
Overview of methods
Table I.1 presents an overview of the methods used to compile the data on the generation and the recovery and disposal of waste. When selecting the methods to be used, we have based the choice on the desire to increase knowledge on the mag-nitude of the generation and treatment of different types of waste. Particular focus has been placed on obtaining data on the larger waste flows and the flows of hazardous waste, which have made it possible to produce the statistics more effectively in the long-term.
According to the waste statistics regulation, enterprises with less than ten employees are exempt from the surveys, unless they contribute significantly to the generation of waste. Questionnaire surveys have therefore not been used in the majority of cases on small enterprises (fewer than 10 employees). Other methods have been applied. However, small enterprises in some sectors have been surveyed using questionnaires, when experts have assessed that these enterprise populations can be responsible for large and, from an environmental perspective, significant flows of waste.
The questionnaire surveys carried out (see Table I.1) have been optional for respondents. The surveys have been carried out using paper questionnaires. Ques-tionnaire surveys have been covered by statistical confidentiality26. As a result of this, partial results can be confidential if the data originate from only a few ques-tionnaire responses or can, in some way, indirectly or directly, be attributed to a specific local unit, facility or enterprise.
In some sectors, the questionnaire surveys have been total, i.e. covering all local units/facilities/enterprises in the industry, while sample surveys have been used in other sectors. With the sample surveys, a division into different strata or sub-populations has been done first (by number of employees). A random sample of facilities who will receive the questionnaire was then taken from every stratum. When data are then compiled, a proportional extrapolation is carried out of the waste quantities received within each stratum, i.e. those responding within each stratum are considered representative of the stratum as a whole.
An overall description of the methods used is given below, with reference to the more detailed descriptions of methodology for the different industry sectors.
The inventory work has been divided into several sub-surveys. The division of sectors described in Annex I in the waste statistics regulation, i.e. the sectors for which generation of waste are to be reported, have been used as a basis for the division into sub-surveys. Every sub-survey has involved an inventory of both data on waste generated and data on the recovery and disposal of waste, including ca-pacity in the section, division, group or class of NACE in question. Table I.1 gives an overview of the methods used.
Table I.1. Overview of methods used for inventory work
Item NACE Description Methods – data on generation of waste Methods – data on recovery and disposal (includ-ing capacity)
1 A Agriculture, hunting and forestry No statistics produced for 2006.27 No waste treatment is thought to occur in this sector,
see Appendix 1.
2 B Fishing No statistics produced for 2006.28 No waste treatment is thought to occur in this sector,
see Appendix 1.
3 C Mining and quarrying Questionnaire survey – sample survey*, model
calcula-tion for enterprises with less than 10 employees. See Appendix 2.
Questionnaire survey – sample survey* (waste treat-ment only assumed to occur in larger enterprises). See Appendix 2 and Appendix 13.
4 DA Manufacture of food products, beverages
and tobacco
Questionnaire survey – sample survey*, model calcula-tion for enterprises with less than 10 employees. See Appendix 2.
Questionnaire survey – sample survey*. See Appendix 2 and Appendix 13.
5 DB +
DC
Manufacture of textiles and textile products + manufacture of leather and leather prod-ucts
Extrapolation of data from survey on Industrial waste 2002. Expert assessments on the distribution of total quantities of different types of waste. See Appendix 2.
No waste treatment has been identified in this sector in previous surveys. See Appendix 2 and Appendix 13.
6 DD Manufacture of wood and wood products Questionnaire survey – sample survey*. Model
calcula-tion for enterprises with less than 10 employees. See Appendix 2.
Questionnaire survey – sample survey* See Appendix 2 and Appendix 13
7 DE Manufacture of pulp, paper and paper
prod-ucts; publishing and printing
Questionnaire survey – sample survey*
Model calculation for enterprises with less than 10 em-ployees. See Appendix 2.
Questionnaire survey – sample survey* See Appendix 2 and Appendix 13
8 DF Manufacturing of coke, refined petroleum
products and nuclear fuel
Questionnaire survey – sample survey*
Model calculation for enterprises with less than 10 em-ployees. See Appendix 2
Questionnaire survey – sample survey* See Appendix 2 and Appendix 13
27
Sweden has been granted a derogation for the reporting according to the waste statistics regulation for the generation of waste in this sector (COMMISSION REGULATION (EC) No 784/2005 of 24 May 2005)
28
Sweden has been granted a derogation for the reporting according to the waste statistics regulation for the generation of waste in this sector (COMMISSION REGULATION (EC) No 784/2005 of 24 May 2005).
9 DG + DH
Manufacturing of chemicals and chemical products + manufacture of rubber and plastic products
Questionnaire survey – sample survey*
Model calculation for enterprises with less than 10 em-ployees. See Appendix 2
Questionnaire survey – sample survey* See Appendix 2 and Appendix 13
10 DI Manufacture of other non-metallic mineral
products
Questionnaire survey – sample survey*
Model calculation for enterprises with less than 10 em-ployees. See Appendix 2
Questionnaire survey – sample survey* See Appendix 2 and Appendix 13 11 DJ Manufacture of basic metals and fabricated
metal products
Questionnaire survey – sample survey*
Model calculation for enterprises with less than 10 em-ployees. See Appendix 2
Questionnaire survey – sample survey* See Appendix 2 and Appendix 13
12 DK +
DL + DM
Manufacture of machinery and equipment n.e.c + manufacture of electrical and optical equipment + manufacture of transport equipment
Questionnaire survey – sample survey*
Model calculation for enterprises with less than 10 em-ployees. See Appendix 2
Questionnaire survey – sample survey* See Appendix 2 and Appendix 13
13 DN excl. 37
Manufacturing n.e.c Extrapolation of data from survey on Industrial waste
2002. Expert assessments on the distribution of total quantities of different types of waste. See Appendix 2
No waste treatment has been identified in this sector in previous surveys
See Appendix 2 and Appendix 13
14 E Electricity, gas and water supply Incineration facilities: Questionnaire survey – total
popula-tion survey of incinerapopula-tion facilities.
Investigation (telephone inquiries, environmental reports, etc) of gas works, nuclear power stations, electricity distribution companies, etc
Water supply: waste factors. See Appendix 3
Questionnaire survey – total population survey of incineration facilities.
See Appendix 3 and Appendix 13
15 F Construction Expert panel assessments
See Appendix 4
Expert panel – only recovery of excavation materials (mineral waste) occurs at construction sites, see Apen-dix 4 and AppenApen-dix 13
6 G-Q excl. 90 and
Services:
wholesale and retail trade; repair of motor vehicles, household and personal articles + hotels and restaurants + transport, storage
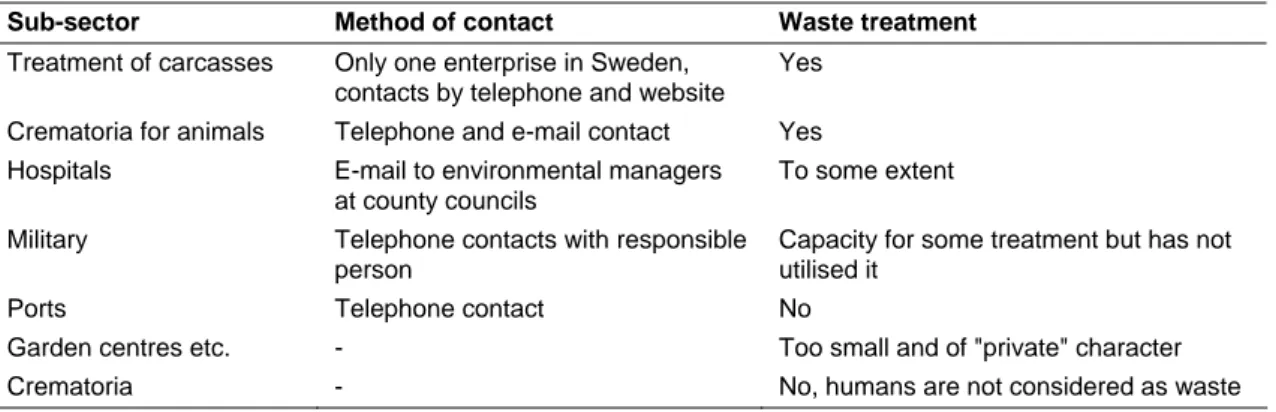
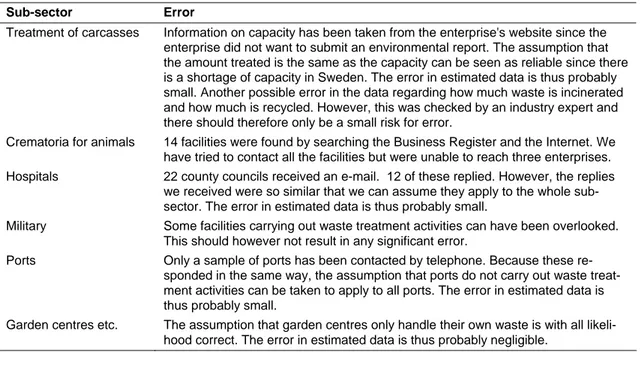
No statistics produced for 2006.29 Investigation of occurrence of treatment. Telephone
and e-mail contact with enterprises/facility/local unit where waste treatment has been identified See Appendix 5 and Appendix 13
29
Sweden has been granted a derogation for the reporting according to the waste statistics regulation for the generation of waste for this sector (COMMISSION REGULATION (EC) No 784/2005 of 24 May 2005)
51.57 and communication + financial mediation + real estate, rental and business activities + public service, defence and compulsory social insurance + education + health and social services; + other community, social and personal service activities + activities in households + extra-territorial organisations and bodies
17 37 Recovery Questionnaire survey – total population survey. Waste
factors for dismantling of cars. See Appendices 6 and 8
Questionnaire survey – total population survey See Appendices 6 and 8 and 13
18 51.57 Wholesale trade in waste and scrap Questionnaire survey – sample survey. Waste factors for
dismantling of cars. See Appendices 7 and 8
Questionnaire survey – sample survey See Appendices 7 and 8 and 13
19 90 Sewage and refuse disposal, sanitation and
similar activities
Collection and treatment of sewage: assessments from previous surveys
Collection and treatment of waste: Questionnaire survey - total population survey of treatment facilities (other NACE 90 facilities are assumed to contribute minimal quantities of waste)
Waste from sanitation activities: pilot surveys - questions to a limited number of municipalities
See Appendices 9-11
Questionnaire survey – total population survey to all waste treatment facilities
See Appendices 9-11 and Appendix 13
20 - Waste generated by households Data from industry organisations (Swedish Association of
Waste Management), producer responsibility enterprises, etc. See Appendix 12
No waste treatment is considered to occur (home composting is considered to be internal recycling). See Appendix 12.
As can be seen in the table, the inventory has been divided up into different sub-surveys as follows:
Investigation regarding Agriculture, hunting and forestry (NACE A) and fishing (NACE B)
Sweden has been granted a derogation for the compilation of statistics on the generation of waste for these sectors. A separate investigation on the recovery and disposal of waste has been carried out within the sector. The conclusion from the investigation was that no treatment of waste, in the sense intended in the waste statistics regulation, occurs in the sector.
Survey regarding Mining and quarrying (NACE C) and Manufacturing (NACE D):
The sectors Mining and quarrying (NACE C) and Manufacturing (NACE D) cover a total of 11 different items in the reporting on the generation of waste. Recovery and disposal occurs in many of these industries/sub-industries. All industries within NACE C and D have been surveyed in a combined survey covering both genera-tion and recovery and disposal. The survey was based on a sample survey using paper questionnaires. A total of 2 000 enterprises were questioned, of which all had more than 100 employees. The questionnaire survey was supplemented with data from industry organisations. For smaller local units that were not included in the sample, an extrapolation was carried out based on the number of employees.
Survey regarding Electricity, gas and water supply (NACE E)
The sector Electricity, gas and water supply (NACE E) has been studied in a sepa-rate study including both the generation of waste and recovery and disposal of waste.
Enterprises producing energy from combustion were covered by a total popula-tion survey using paper quespopula-tionnaires. This survey included all enterprises that incinerate household and similar wastes. For other enterprises within the energy sector (NACE 40, i.e. nuclear power stations, manufacturers of gas, hydroelectric power stations, wind power stations, electricity network enterprises and electricity trade enterprises) data from telephone interviews, environmental reports and the enter-prises' websites were used.
For the sub-sector, water supply, waste factors were produced using question-naires to a smaller number of waterworks. The study was carried out in cooperation with the industry organisation Swedish Water and Waste Water Association.
Survey regarding Construction (NACE F)
A separate study based on expert assessments was carried out. These expert assessments were put together by representatives from the waste and construction industries.
Survey regarding Services (NACE G-Q excluding 51.57 and 90)
This reporting item does not include Wholesale of waste and scrap (NACE 51.57) and Sewage and refuse disposal, sanitation and similar activities (NACE 90) as these constitute their own reporting items, see below. Sweden received a deroga-tion for the reporting of generaderoga-tion of waste in the service sector (NACE G-Q excluding 51.57 and 90). A separate study was carried out on recovery and disposal within the sector. Data on treatment have been collected via telephone interviews to the relevant facilities where the treatment of waste is carried out.
Survey regarding Recycling (NACE 37)
The sector Recycling (NACE 37) has been studied in a survey covering both the generation of waste and the recovery and disposal of waste. The sector has been divided into two groups: dismantling of end-of-life vehicles and other recycling.
The group "other recycling” was covered by a questionnaire survey. The survey, in the form of paper questionnaires, covered all local units within the group. Extrapolation of data within the group "other recycling" to the total popula-tion was carried out using proporpopula-tional statistical extrapolapopula-tion.
When calculating quantities of waste from dismantling of end-of-life-vehicles, a common procedure for all local units within NACE 37 and NACE 51.57 was used, based on waste factors (see below).
The treatment of waste occurring in the industry is considered to be pre-treatment and has therefore not been included in the statistics on recovery and disposal.
Survey regarding Wholesale of waste and scrap (NACE 51.57)
Wholesale of waste and scrap (NACE 51.57) has been studied in a survey covering received waste, preparation for recovery and disposal of waste (sorting) and generation of waste. The treatment of waste occurring in the industry is considered to be pre-treatment and has not been included in the statistics on recovery and disposal.
The sector has been divided into two groups: dismantling of end-of-life vehicles and other.
Data for the group “other” have been collected using a sample survey with paper questionnaires. Extrapolation of data to the total population has been done using proportional statistical extrapolation.
When calculating quantities of waste from dismantling of end-of-life vehicles, a common procedure for all local units within NACE 37 and NACE 51.57 was used, based on waste factors (see below).
Survey regarding Dismantling of end-of-life-vehicles within NACE 37 and NACE 51.57
Calculations have been carried out using waste factors based on data on the number of scrapping certificates taken from industry organisation the Swedish Car Recy-clers Association (SBR). Total waste quantities have been obtained using SBR's annual questionnaire, which was used to estimate waste factors per scrapping certificate for each type of waste. The calculated waste factors and data from the Swedish Road Administration on the number of issued scrapping certificates were used to estimate the total quantities of waste within the car dismantling industry for 2004. The dismantling of cars has been classified as a form of pre-treatment and is not included in the statistics on recovered and disposed waste. The total quantity of waste is divided into facilities in NACE 37 and NACE 51.57 according to the proportionality principle.
Survey regarding Sewage and refuse disposal, sanitation and similar activities (NACE 90)
The sector has been covered in three different studies using different procedures: 1) Collection and treatment of sewage (NACE 90.01): For this sub-sector, only
data on sludge have been produced. Types of waste not reported include screenings and such like, which are considered only to generate relatively small quantities. Data are estimates/expert assessments taken from interna-tional reporting from Sweden on emissions from sewage facilities from the slightly over 400 facilities which have a licence to carry out the final treat-ment of sludge. This sludge originates to some extent also from smaller sew-age facilities and individual sewers. Data on sludge is entered as “Generated waste”. Liquid water-containing waste that is released into sewers has not been included as disposed waste.
2) Collection and treatment of other waste (NACE 90.02): A total population survey has been carried out of waste treatment facilities covering the genera-tion of waste, the recovery and disposal of waste as well as treatment capaci-ties. The survey method was a questionnaire survey with paper questionnaires as the measurement instrument.
3) Sanitation, remediation and similar activities (NACE 90.03): A very limited telephone survey on the generation of waste was carried out to a sample of the technical offices at Sweden's municipalities, or equivalent. The results were thereafter adjusted upwards to a national level using population data. Data collected were entered under “Generated waste”.
Survey regarding waste generated by households
Waste generated by households has been studied in a separate survey. The survey was based on data from the Swedish Association of Waste Management for "municipal" household waste and from the various producer responsibility enter-prises for waste covered by producer responsibility. For every waste flow, an expert assessment was carried out on how much of the waste originated from
households and how much from business activities. No waste treatment is consid-ered to occur (home composting is considconsid-ered as equal to internal recycling).
Changes since the previous reference year
These statistics, produced for the reporting according to the waste statistics regula-tion, differ considerably from previous waste statistics in Sweden. The scope and limitations are, in many respects, new.
Expected changes to the 2008 reporting on
2006
The planning in preparation for the 2008 publication and reporting of data was started during 2006. The starting point for this planning was to largely continue with the same methods and level of ambition as for the 2006 reporting. However, there are some necessary adjustments to be carried out with regards to the scope and level of ambition in order to manage the reporting within the cost limitations and statistical quality requirements. Certain changes can be carried out to reduce the costs to society of the statistics production and to raise the level of ambition regarding statistical quality for some sectors/types of waste. Compared to the 2006 reporting, the important waste flows according to the Key Aggregates and those for which there is considerable risk for environmental impact will be prioritised.
A more comprehensive rationalisation regarding inventory methodology is planned before the 2010 reporting.
Part II
Quality attributes
This report on quality attributes includes various different descriptions of the quality of the statistics. Important aspects of the description of quality are the rele-vance of the statistics, their reliability and accuracy, accessibility and clarity, com-parability, coherence and the burden on respondents.
The content of Part II describes the quality of the statistics primarily in relation to these aspects. The descriptions given are general. More detailed descriptions for each sub-survey are given in Appendices 1 – 13.
1 Relevance
Relevance refers here to how the statistics are used on a national level and how complete the produced statistics are (using the requirements in the waste statistics regulation as a starting point).
Statistics on waste generation and recovery and disposal of waste are needed in Sweden for the follow-up and development of environmental policies and action plans.
The work relating to the environment is structured into 16 environmental quality objectives30 that need to be achieved in order to solve the major environ-mental problems within one generation. Waste flows and waste management have an impact on developments within the objectives for a good built environment, reduced climate impact and a non-toxic environment. A national waste plan has been drawn up31 to help achieve these objectives, in which the different objectives and control instruments available within the field of waste are put into context. The impact of the measures that have been taken is discussed and the areas which need to be prioritised in the work in the field of waste over the coming years are high-lighted.
The existing waste statistics were considered to be useful for both the follow-up and the development of the action plan in this field, even if the measurement of follow-up and other used of the new statistics need to be developed.
There are many different users of waste statistics - citizens, politicians, munici-pal, regional and national authorities, central government offices, industry,
researchers, etc. This is because development for a sustainable environment is seen as every-one's responsibility. Authorities with responsibility for the follow-up and analysis of measures regarding the waste-related aspects of the environmental quality objectives, such as the National Board of Housing, Building and Planning, the Swedish Environmental Protection Agency, the National Chemicals
30
www.miljomal.nu
31
Strategy for sustainable waste management. Sweden's waste plan. Swedish Environmental Protec-tion Agency 2005
ate and county administrative boards and municipalities are considered to be more dependent on the statistics.
The datasets are complete. The value zero (0) has been reported in some cases, based on expert assessments that the quantity of waste of a certain category is practically zero. The European Commission's regulation on reporting formats32 states that member states may write "L" (logically impossible) instead of 0 for some waste types to indicate that a certain type of waste can absolutely not occur within a certain industry. Sweden has not classified data as "L" in this reporting as we consider that it has been difficult to truly identify when a type of waste is "logically impossible".
2 Accuracy
Table II.1 presents the key aggregates reported.
Table II.1.1 Key aggregates for generated and treated waste in 2004. Country: Sweden Reference year: 2004 Total hazardous waste (key aggregate) 000 tonnes Total non-hazardous waste (key aggregate) 000 tonnes Coefficient of variation hazardous waste % Coefficient of variation non-hazardous waste % Generation of waste 1 Households 372.617 4 458,730 10 15 2 Enterprises 981.127 113 482,302 6 4
Recovery and disposal of waste 1 Incineration: use principally as a fuel or other means to generate energy R1 310.802 10 771.750 14 13 2 Incineration: incin-eration on land D10 71.120 0,742 1 8 3 Recovery (exclud-ing energy recov-ery) R2-R11 291.560 17 544,391 13 13 4 Disposal operations Landfilling: D1, D3, D4, D5, D12. Land treatment and release to water D2, D6, D7
494,124 66 412,751 2 2
Appendix 14 shows how uncertainty estimates for these key aggregates have been done.
32
In the Key Aggregates, the amounts for each type of waste are included in their normal wet condition. This is also the case for the types of waste Industrial effluent sludges (03.2) and Common sludges (11).
In order to interpret the key aggregates correctly, the following information should be noted:
1) Waste generated in some sectors is not included as Sweden has received a derogation for these, as follows:
- Agriculture, hunting and forestry (NACE A) - Fishing (NACE B)
- Services (NACE G-Q, excl. NACE 37 Recycling and NACE 51.57 Wholesale trade in waste and scrap)
2) The largest items of generated waste (wet weight) are - mineral waste from mining
- wood waste from sawmills - leachate water from landfill sites.
These three types of waste together account for 70% of the total generated wet weight of waste.
3) The quantity of wood waste generated can be overestimated due to a model calculation of wood waste in small local units (less than 10 employees) in the Manufacture of wood and wood products (NACE DD). There are a large number of sawmills with less than 10 employees, and the quantity of gener-ated waste for these has been calculgener-ated using waste factors based on quantity of waste per employee in local units with less than 10 employees. However waste treatment data (use of wood waste as fuel) have not been adjusted up-wards for these local units. It is likely that a number of facilities have energy production facilities where wood waste is used as an energy source.
4) Households produce a relatively large quantity of hazardous waste. Of this quantity, 75% consists of end-of-life vehicles and more than 15% of electrical and electronic waste. Households are the reporting sector that generates the largest quantity of hazardous waste.
5) The quantity of incinerated waste includes the usage of wood waste in heating facilities and the use of bark and wood waste as fuel in the paper and pulp industry.
6) The quantity of landfilled waste is large because the depositing of mining waste is included. 58 million tonnes, corresponding to 87% of reported waste, is landfilled waste within the sector Mining and quarrying (NACE C), which is in turn completely dominated by mining.
7) The reported quantity of recovered and disposed waste is less than the quan-tity of waste generated. This could be for several reasons:
· Uncertainty in the estimations.
· Generated waste may include types of waste that have been counted twice. For example, a type of waste can occur within the mining and manufactur-ing industries (NACE C and NACE D) and then further processed in NACE 37, NACE 51.57 or NACE 90, giving rise to secondary waste, which is also counted as generated waste. The secondary waste is treated by recovery or disposal. Pre-treatment in NACE 37, NACE 51.57 and NACE 90 is not in cluded as waste treatment but can give rise to the gen-eration of secondary waste.
· The reporting of recovery and disposal of waste covers facilities which re-quire a permit or registration according to articles 9, 10 or 11 in Directive 75/442/EEC. In practice, not all recovery comes under this rule:
- Secondary raw materials are classified as waste according to the Mayer-Parry ruling from the European Court of Justice (C 444/00) but, before this ruling, were often considered as a commodity instead of waste. This means that it has been difficult to make an inventory of all recycling, as industrial facilities that used secondary raw materials do not normally have a permit nor are registered according to Directive 75/44/EEC. Fur-thermore, respondents at these facilities do not consider that they are managing waste and have often not noted that they recycle waste in the questionnaire surveys. This applies to waste such as wood waste, metal-lic waste, mineral waste, etc.
- Mineral waste, some combustion waste, treated contaminated soil, etc. is used to a large extent as construction materials in construction pro-jects. Much of this usage has been hard to identify.
- The use of sludge in agriculture has not been reported as a treatment method.
· Other types of waste treatment not included in the surveys. For example, we have identified the following cases where the inventories are not com-plete:
- Waste released into municipal sewers is often not reported. Examples of such waste are purified water from the treatment of oil waste, leachate water from landfills, sludge from the production of drinking water, and such like. Respondents consider this waste to be sewage water rather than actual waste.
- Leachate water from landfill sites that has been treated biologically or using physico-chemical methods has not always been reported by re-spondents (disposal D8 and D9). These should actually be reported as release to water but respondents have, in some cases, misunderstood how the treatment of leachate water should be filled in.
- Dismantling of end-of-life-vehicles has not been included as a treatment method. We have considered the dismantling to be pre-treatment.
- Capacities are in general “in balance” with the treated quantities. In NACE 90, the reported capacity for recovery is considerably higher than the recovered quantities within the sector. This is principally due to some capacity for pretreatment (sorting) being included in the reported capacities (but not in the reported treated quantities). Several facilities have not been able to separate the capacity for processes that are to be reported as recovery from the various sorting and pretreatment proc-esses that should not be reported.
The accuracy of the data on the generation of waste and recovery and disposal of waste is described in detail in the appendices for each sub-survey. The text is struc-tured on the basis of the headings dictated by Eurostat. This has occasionally led to difficulties as the headings are adapted for simple questionnaire surveys and are difficult to apply when several survey methods have been used. All the relevant information has however been included.
2.1 Sampling errors
Sampling errors occur when only a selection of the local units/facilities/enterprises that are included in the group in question is surveyed. Errors depend on how repre-sentative the selected population is for the group as a whole.
Different methods for sampling have been used in different sectors. Surveys for several sectors have also been based on total population surveys. Sampling errors occur primarily when extrapolations are carried out of inhomogeneous groups. If the sample group is small, it is easy for extreme values from one responding local unit to result in a considerable adjustment error. This is reflected at the same time in the coefficients of variation. Sample surveys have been carried out for the ques-tionnaire surveys within NACE C, NACE D and NACE 51.57. Sampling errors for generated and treated waste and treatment capacity are described in detail for each NACE group in the appendices.
2.2 Non-sampling errors
2.2.1 COVERAGE ERRORS
2.2.1.1 Coverage errors regarding the population
Coverage errors regarding the population occur when the survey method results in that waste quantities from some local units/facilities are missed in the survey or that these quantities are surveyed in several different sub-surveys. Coverage errors can lead to waste quantities being missed or counted twice.
Coverage errors are described in more detail in Appendices 1 - 13 for generated waste, the recovery and disposal of waste and the capacities for recovery and dis-posal for each sub-survey.
Different frames have been used in different surveys, i.e.:
• NACE C, NACE D, NACE 37 and NACE 51.57 were based on local units from Statistics Sweden's Business Register.
• NACE E (sector Energy production from incineration) is based on the register of energy enterprises used for the official energy statistics. • NACE 90 (sector NACE 90.02 Collection and treatment of other waste)
is based on the emissions database (EMIR) from the county administra-tive boards and the Swedish Environmental Protection Agency, which covers facilities with permits for environmentally harmful operations ac-cording to the Environmental Code. Facilities with permits for the treat-ment of waste were selected from this database.
Within many sub-sectors, supplementary sources, such as industry organisations, have also been used.
The use of different frames can, in theory, have resulted in both overcoverage (an object being counted twice in several surveys) and undercoverage (an object being missed by several frames). The different surveys have been checked against each other with the aim of detecting any objects that have appeared in several of the frames. Any cases identified where data have appeared twice have been corrected. We therefore assume that no data have been counted twice.
None of the questionnaire surveys cover the entire reporting sector in question. The questionnaire surveys are instead designed to capture data on the most impor-tant waste flows in the sector and then supplementary work has been done to achieve 100% coverage. An example of such supplementary work is as follows:
• Within NACE C and D, a model adjustment has been done for enter-prises with less than 10 employees that have not been included in the frame. A supplementary study has also been done in these sectors to collect data on recycling facilities as defined by the Mayer-Parry ruling. • Within NACE D, some sub-sectors with small quantities of waste have
been excluded from the questionnaire survey. For these, waste quantities from a waste survey from 2002 have been used as a basis for expert assessments.
• Within NACE E, separate studies (based on data from enterprises, industry organisations, environmental reports, etc.) have been carried out for the most significant operations that have not been covered by the questionnaire survey.
• Within NACE 90, a special telephone survey to a limited number of municipalities was carried out for Sanitation (NACE 90.03). In addition, data were used from previous international reporting (according to the sludge directive) for the Collection and treatment of sewage (NACE 90.01).
2.2.1.2 Coverage errors regarding waste quantities
In the surveys, we have studied the generation of waste from households and all sectors apart from Agriculture, hunting and forestry (NACE A), Fishing (NACE B) and NACE G-Q (excl. 90 and 5157) Services.
We have attempted to apply a broad interpretation of the definition of waste. Some difficulties affecting data collection have been due to the fact that respon-dents have in practice not fully applied the official definition. This concerns for example:
a. By-products. The line between a by-product and waste is sometimes hard to define. The ruling in the Saetti & Frediani case (C-235/02) states that a by-product does not need to be classified as waste if it occurs after a concrete process choice, see the discussion above in Part I, Scope and limitations. For example, the following "by-products" (occurring in large quantities) have been classified as waste:
- Wood waste from sawmills. This is sold to heating plants or the pulp industry.
- Metal waste (scrap) from the metal industry. This is sold to the scrap industry (normally in NACE 37 or 51.57) which then sells it on to metal-works (NACE 28).
- Excavated material. The majority of excavated material dug-up during construction or foundation projects is reused in other construction projects. Data on these types of waste are marred by uncertainty as many respondents have not noted these as waste. We have estimated these waste quantities using an extrapolation process, see Appendix 2 (for wood and metal waste) and Ap-pendix 4 (excavated material).
b. Liquid water-containing waste that is released into sewers. In practice, some liquid waste that is released into sewers is considered to be sewage water, not waste. Examples of such waste are:
- Leachate water from landfill sites
- Water-containing liquid waste from wet flue gas cleaning and other water-containing liquid combustion wastes
- Water-containing liquid waste from oil regeneration.
All these waste types are classified as 03.2 Industrial effluent sludges accord-ing to EWC-Stat. For leachate water, we have recontacted respondents to ob-tain supplementary data – however, not all responded despite several remind-ers. The two other waste types have been included when we have received data but incomplete data have been received from many respondents.
2.2.1.3 Coverage of recovery and disposal
We have applied the following interpretations and limitations regarding recovery and disposal:
1. Incineration: use principally as a fuel (R1)
The incineration of waste in Sweden is, in general, classified as a recovery opera-tion: R1 Use as fuel. Facilities carrying out waste incineration are integrated in the district heating system and, to a certain extent, also the electricity production sys-tem. Facilities are designed to produce district heating and electricity. In most ca-ses, the facilities are also run by private or municipal energy companies and not by waste management companies. This applies also to facilities that incinerate house-hold and similar wastes. In Sweden, these constitute base production units in the district heating network to which they provide heating.
Wood by-products and waste from the wood products industry (NACE 20) is a significant energy source of district heating production in Sweden. Wood by-products and waste from the wood by-products industry (NACE DD) and the pulp and paper industry (NACE DE) are also used for the production of energy for industrial use (i.e. steam and electricity). We have interpreted wood by-products as waste, and the usage of this for energy production constitutes waste incineration (classi-fied as R1). This has the consequence that Sweden reports a relatively large quan-tity of wood waste for incineration and a very high total incineration capacity.
2. Incineration: incineration on land (D10)
One facility in NACE 90 that incinerates hazardous waste has been classified as D10 Incineration on land. Even if this facility produces electricity and district heating, we have assumed that it was designed and is operated primarily with a view to disposing of waste and, only in second place, for producing energy (with the inter-pretation of R1 given in the new proposal for a framework directive, the facility will likely be classified in the future as R1 Use as fuel).
3. Recovery, excluding energy recovery (R2 – R11)
The Mayer-Parry ruling (European Court of Justice C-444/00) has led to some difficulties when carrying out the surveys. When the surveys were planned, we began with the assumption that the court's interpretation of "when waste ceases to be waste" and of "recycling" would not apply. We made this assumption partly due to the fact that these issues were being discussed in the Commission's work with a thematic strategy for the prevention and recycling of waste. The thematic strategy resulted, among other things, in a proposal for a new framework directive (COM (2005) 667 final), which deviates from the interpretation in the Mayer-Parry ruling. However, after a proposal for guidelines were produced by Eurostat, it was stated that the Mayer-Parry interpretation would apply to reporting according to the waste statistics regulation and we have adapted to this. This has meant that
• Material recycling occurs mainly in the manufacturing industry (NACE D).
• For waste treatment facilities within NACE 90 and industrial landfill sites within NACE C and D, the use of by-products for covering waste landfills and/or as construction material has been classified as recovery, because the waste in these cases replaces other material.
• Anaerobic digestion and composting primarily within NACE 90 and NACE D has been classified as recovery.
• Within other industries, different processes occur (sorting, grinding, other processing) that can lead to recycling, but these have been classi-fied as pre-treatment that is not covered by the reporting.
4. Landfilling (D1, D3, D4, D6, D12)
All landfill sites with permits are included in the survey. Landfilling also applies to intermediate storage before disposal for a period of more than one year or interme-diate storage before recovery for a period of more than three years. Waste from mining is covered in the survey on NACE C. Some of the waste from mining is used in various ways to restore the mining pits (terracing, landscaping and such like). We have classified this as Depositing D1.
5. Other disposal (D2, D6, D7)
Other disposal refers to Release to water (D6 and D7) and Land treatment (D2). According to the waste statistics regulation, disposal operations D8 (Biological treatments) and D9 (Physico-chemical treatments) are not reported as these are considered to be pre-treatment and, in the majority of cases, lead to disposal via Release to water (D6 or D7) or Land treatment (D2). In the questionnaire surveys, we have not asked about biological or physico-chemical treatments. Consequently, some respondents may have omitted to fill in data from release or land treatments. This applies to leachate water from landfill sites, for example, or water from the treatment of oil waste, sludge from purification of tap water, flue gas condensate from combustion and incineration, etc. In a few cases, we have detected that land-fill sites have reported generated leachate water but have not noted any treatment or release. We do not know therefore whether this leachate water has been released after purification or released into the municipal sewers. There is therefore a short-fall for leachate water in the reporting on release or treatment. Energy facilities have often not noted flue gas condensate either as generated waste or as disposed via release to water.
2.2.1.4 Household waste
Household and similar wastes (i.e. EWC-Stat code 10.1) can arise within all opera-tions. Household waste is included in the questionnaire surveys as a surveyed type of waste. In some of the surveys, the quantity of household waste has been esti-mated to 100 kg /employee and year, using measurements taken in other sectors. In practice, sorted household waste (from business operations) can also have been classified as EWC-Stat 10.2 Mixed and undifferentiated materials (such as pre-sorted combustible waste or pre-pre-sorted landfill residue). In the sub-project covering waste from households (see Appendix 12), it has been estimated how much of the household waste originates from business operations and how much from holds. The results have shown that, in total, close to 2.4 million tonnes of house-hold and similar wastes (EWC-Stat 10.1) are generated, of which 95% is generated by households. In practice, household waste is also generated by business