ACCIDENTS RISK AND ROAD SAFETY
AMONG IMMIGRANTS IN NORWAY
1Terje Assum,
Institute of Transport Economics – TØI
Gaustadalléen 21, NO 0349 Oslo, Norway E-mail: tas@toi.no; Phone +47 4894 4460
Susanne Nordbakke,
Institute of Transport Economics – TØI
Gaustadalléen 21, NO 0349 Oslo, Norway E-mail: sno@toi.no; Phone +47 4895 9418
ABSTRACT
Immigrants make up 13.1 % of the population of Norway in 2012. Immigrant drivers in Norway have considerably higher accident risk, measured as personal-injury accidents per 1000 license holders, than drivers born in Norway. Drivers from the Middle East and Africa have more than twice the accidents risk of drivers born in Norway or immigrant drivers from the western world. Accident risk is calculated using the national registers of road accidents, driver’s licenses and the Norwegian population. Factors which may explain these differences in accident risk were studied by focus group interviews and a questionnaire survey. Language problems, worries about family in the country of origin, attitudes to road traffic rules and driving behavior reflected in the number of road traffic violation fines may contribute to explaining the differences in road accident risk.
1 IMMIGRANTS FROM LOW-INCOME COUNTRIES INTO
HIGH-INCOME COUNTRIES
1.1 Immigrants and road accident risk
Immigration into Norway has increased considerably since the 1980’s, especially from overseas countries and from Eastern Europe. Studies in Sweden (Eriksson 1998; Yahya 2001; Gustafsson & Falkmer 2006) have shown that immigrants from non-western countries into Sweden have higher road accident risk than immigrants from western countries and people born in Sweden. Since Norway and Sweden are similar in many ways, there was reason to ask if similar differences in road accident risk exist also in Norway. The reasons to expect such differences can be economic and cultural differences between non-western countries and
1
Revised March4, 2013. This article is based upon Susanne Nordbakke & Terje Assum. Innvandreres ulykkesrisiko og forhold til trafikksikkerhet (Accident risk and traffic safety among immigrants). TOI report 988. Oslo, 2008. The authors want to acknowledge the contributions of Astrid Amundsen, TØI, Gunilla Sörensen and Mohammad-Reza Yahya, VTI, Sweden, Oscar Amundsen and Tor Arne Stubbe, NTNU, Norway, to this report.
Norway, as well as climatic differences and differences in road traffic behavior. The general hypothesis is that differences in road accident risk between immigrants and the remaining population would be more or less the same in Norway as in Sweden. Such differences would be important to know, as they make up a basis for special countermeasures targeted at immigrants in general or immigrants from special countries.
1.2 What is an immigrant?
Statistics Norway (2012) defines immigrants as people living in Norway and born abroad or people living and born in Norway with two foreign-born parents. In 2012 immigrants made up 13.1 per cent of the population of Norway. By 2008, when the data for this study were collected, immigrants made up 9.7 per cent of the population of Norway (Statistics Norway/innvbef 2008). However, only license holders born abroad were included in this study.
44 per cent of the immigrants in Norway come from Asia, Africa or Latin-America. 20 per cent of the immigrants have lived in Norway for more than 20 years, whereas 40 per cent have lived in Norway for four years or less. 53 per cent of the people born in Norway by immigrant parents, are of Asian origin, and 18 per cent of them are 20 years old or more.
1.3 Recent trends in immigration into Norway
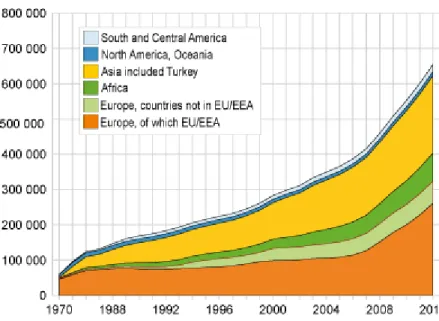
The number of immigrants in Norway, as in many other European countries, has increased considerably since the 1980’s. Primarily, immigrants from low-income countries outside Europe or from the former communist countries in Central and Eastern Europe, both member states in the EU and non-member states, make up the majority of the recent immigrant population of Norway. By 2012 immigrants make up 13.1 per cent of population.
Figure 1: Immigrants and Norwegian-born to immigrant parents by country. 1970-2012 (Statistics Norway 2012)
1.4 Immigrants and road safety - Literature and research
Norway
Thuen & Sam (1994) have shown that the children of immigrants were restrained in vehicles more rarely than the children of native Norwegians. Moreover, the longer time the immigrant parents had been living in Norway, the higher the restraint frequency. Sølvberg & Rismark (2005) and Rismark et al (2003) have discussed driver training, communication and cultural aspects of the interaction between immigrants and driver training instructors, whereas the road accidents were not studied. Nordbakke & Assum (2008), the report on which this article is based, was the first to publish accident risk rates of immigrants in Norway. Bjørnskau (2009) has later on calculated and published accident risk data for non-western immigrants in Norway as part of a report concerning high risk groups in road traffic.
Sweden
Eriksson (1998) has shown that during 1987 – 1996 4.6 per cent of immigrants holding driver’s licenses were involved in road accidents, compared to 3.4 per cent of license holders born in Sweden. Accident involvement was higher among license holders immigrating before July 1, 1991. Until this date immigrants registered as residents in Sweden could change their foreign license into a Swedish license, whereas after this date only immigrants from the European Union, Iceland, Norway, Switzerland and Japan could do so. All other immigrants had to pass a driver’s license test in Sweden to obtain a license valid in Sweden.
Yahya (2001) and Gustafsson & Falkmer (2006) have shown that immigrants from some countries are overrepresented in road accidents. Immigrants from non-Western countries have higher accident risk, defined as number of accidents per driver’s license, than immigrants from Western countries and native Swedes. The accident risk is higher for men born abroad
than for women born abroad. Men born in the Middle East/ North Africa and in Sub-Saharan Africa have especially high accident risk.
Forward et al (2009) have shown that foreign-born drivers in Sweden use seat belts and child restraints less frequently when driving in urban areas than drivers born in Sweden, and that road safety information reaches foreign-born license holders to a smaller degree. However, foreign-born drivers were more negative to driving over the speed limits than drives born in Sweden.
Wenäll (2001), Anund et al (1999 and 2003), and Gustafsson et al (2003) have shown incorrect use or no use of child restraint among foreign-born drivers than among drivers born in Sweden.
In-depth analyses of fatal road accidents in Southern Sweden have shown that fewer foreign-born killed car occupants were wearing seat belts than killed car occupants born in Sweden. However, foreign-born drivers had fewer alcohol related accidents than drivers born in Sweden. (Vägverket 2005).
The Swedish studies show that there are aspects of the driving behavior of immigrants which may both increase and reduce their road accident risk compared to native born drivers. Differences in material resources, such as having older and more poorly maintained vehicles, may also contribute to higher road accident risk. Being neighboring countries, Sweden and Norway are similar in many ways. Consequently, the road accident situation of immigrants in Norway can be expected to be rather similar to the situation in Sweden.
Research in other countries
Van Dyck (2006) has surveyed road safety initiatives towards immigrants in 16 countries in Europe, showing that there are few quantitative studies of immigrants and road accidents. This survey emphasized the need for further research in this field and for a more sophisticated understanding of immigrants as a most heterogeneous category of people.
Sinclair et al (2006) found that people born abroad had a somewhat higher risk of being involved in a transport accident than people born in the US.
Melinder (2006) found a higher average road accident risk in countries with high percentages of Roman Catholics than in countries with high percentages of Protestants. This difference in accident risk was, however, smaller than the differences that could be attributed to economic differences between these two categories of countries.
Barker et al (1998), Harper et al (2000), Campos-Outcalt et al (2003) and Romano et (2006) found that Latin-American men, Native Americans and African-Americans have somewhat higher road accident risk than Caucasians. The use of seat belts increased with the number of years living in the US, and so did the propensity to drink and drive (Harper et al 2000).
1.5 Immigrants and road accidents - hypotheses
Immigrants, especially from low-income countries, tend to have low social status in terms of education, income, access to material resources etc, and their culture is different from that of their new country. Consequently, their chances of success in their new country tend to be lower than that of the native population of high-income countries like Norway or Sweden. Road accidents per vehicle, driver’s license or km travelled are higher in low-income countries than in high-income countries in general (Kopits & Cropper, 2005).
Economic and educational status as well as more general cultural background and road traffic experience are likely to influence behavior in such a way that drivers born and bred in low-income countries are likely to have higher accident risk than drivers born, bred and trained in high-income countries.
The purpose of this project has been to increase the knowledge about accident risk of immigrants and their relation to traffic safety in terms of knowledge, attitudes and behavior. The project has been limited to concern:
• Car drivers
• First generation immigrants, that is persons born abroad by two foreign parents (both born abroad)
• Immigrants from non-western countries, defined as Asia including Turkey, Africa, South- and Central America and Eastern Europe.
The general hypothesis based upon the literature and research referenced above, is that immigrant drivers will have higher accident risk than drivers born in Norway. Moreover, immigrants from low-income countries will have higher accident risk than immigrants from high-income countries.
2 METHODS
2.1 Three different methods
The project was based on three different studies that are built upon each other:
1. Analysis of accident statistics where the purpose was to gain knowledge about accidents risk among car drivers born abroad,
2. A focus group interview study with car drivers born in Non-Western countries, holding Norwegian driver’s licenses,
3. A survey among car drivers, both Norwegians and immigrants from Non-Western countries.
The purpose of the two latter studies was to gain knowledge about both driver behavior related to traffic safety and knowledge and attitudes towards traffic safety issues in order to explain potential differences in accidents risk among immigrants and Norwegians.
2.2 Road accident risk based on national register data
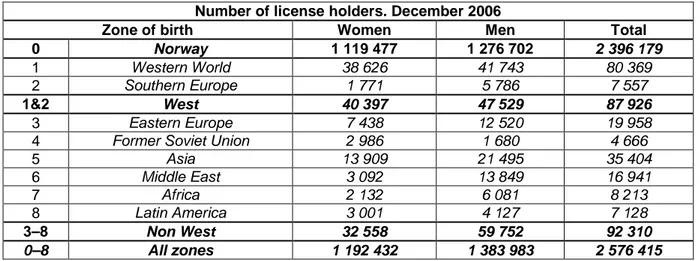
Table 1 Driver’s license holders in Norway by global zone of birth. 2006. Number of license holders. December 2006
Zone of birth Women Men Total
0 Norway 1 119 477 1 276 702 2 396 179
1 Western World 38 626 41 743 80 369
2 Southern Europe 1 771 5 786 7 557
1&2 West 40 397 47 529 87 926
3 Eastern Europe 7 438 12 520 19 958
4 Former Soviet Union 2 986 1 680 4 666
5 Asia 13 909 21 495 35 404 6 Middle East 3 092 13 849 16 941 7 Africa 2 132 6 081 8 213 8 Latin America 3 001 4 127 7 128 3–8 Non West 32 558 59 752 92 310 0–8 All zones 1 192 432 1 383 983 2 576 415
The study of accident risk is based on Norwegian accidents statistics, the Norwegian driver’s license register and the national register of the Norwegian population. Data from these three registers were combined, using to the national individual identification number of each person. After the combination of the necessary information, i.e. accident involvement, driver’s license and country of birth, the individual identification was deleted so that no single individual could be identified. This procedure was approved by the Norwegian Personal Protection Agency.
This use of register data for accidents, license holders and the population in general means that the risk calculations are based on the total populations of license holder and accident involvement rather than samples. As can be seen from Table 1, the numbers of license holders from the eight zones of the world, used in the risk calculations, are rather large. The smallest number is 4666 license holders from the former Soviet Union countries. When divided by gender the numbers are 2986 male license holders and 1680 female license holders.
The accidents from the official road accident data base include all personal-injury road accidents registered by the police in Norway during the five years 2002 – 2006, a total of 41445. A total of 52068 car drivers were involved in these road accidents. Of those country of birth was missing for 11 per cent. A total of 24264 car drivers were killed or injured in road accidents in Norway during the years 2002 – 2008. For some 3 per cent of those country of birth was missing.
To avoid too detailed information concerning country of birth, the world was divided into eight zones for the statistical analysis of accident risk,
1 Western world (except Norway), 2 Southern Europe
1 & 2 West
3 Eastern Europe except the Former Soviet Union 4 The former Soviet Union
6 The Middle East 7 Africa
8 Latin America 3 – 8 Non West 0 Norway
Road accident risk was calculated as the number of drivers involved in road accidents divided by the number of license holders, and the number of drivers killed or injured divided by the number of license holders for each geographical zone.
2.3 Focus group interviews
The focus group interviews comprised eight interviews with a total of 29 men between 19 and 62 years of age from Iran, Iraq, Poland, Pakistan, Somalia, and Vietnam. Their years of residence in Norway ranged from 1 to 36, and their experience of driving in Norway varied from some months to 29 years. The interviews were carried out according to a topic guide in Norwegian, except one case in Polish with an interpreter.
2.4 Questionnaire survey
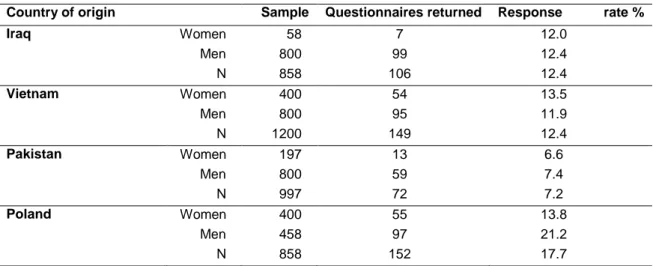
The questionnaire survey included license holders from Iraq, Norway, Pakistan and Poland. The questionnaires were administered by mail. The immigrants received the questionnaire both in Norwegian and in their own language. A total of 5133 persons, statistically random samples from each nationality in the Norwegian driver’s license register, received the questionnaire, and a total of 1150 questionnaires were returned, i.e. at response rate of 22.4 per cent. As can be seen from Table 2 below, the response rate varied between the nationalities. Moreover, a special survey among Somalis resulted in only four questionnaires filled in and returned. These questionnaires are not included in the statistical data.
Table 2: Samples of license holders, questionnaires returned and response rates by nationality and gender.
Country of origin Sample Questionnaires returned Response rate %
Iraq Women 58 7 12.0 Men 800 99 12.4 N 858 106 12.4 Vietnam Women 400 54 13.5 Men 800 95 11.9 N 1200 149 12.4 Pakistan Women 197 13 6.6 Men 800 59 7.4 N 997 72 7.2 Poland Women 400 55 13.8 Men 458 97 21.2 N 858 152 17.7
Country of origin Sample Questionnaires returned Response rate %
Unknown* Women 86
Men 100
Total – immigrants Women 1055 215 20.4 Men 2858 450 15.8 N 3913 665 17.0
Total – born in Norway Women 600 265 44.2 Men 600 220 36.6 N 1200 485 40.4 Total N 5133 1150 22.4 *Questionnaires in Norwegian – nationality not stated – most likely returned by Pakistanis
3 RESULTS
3.1 Accident risk
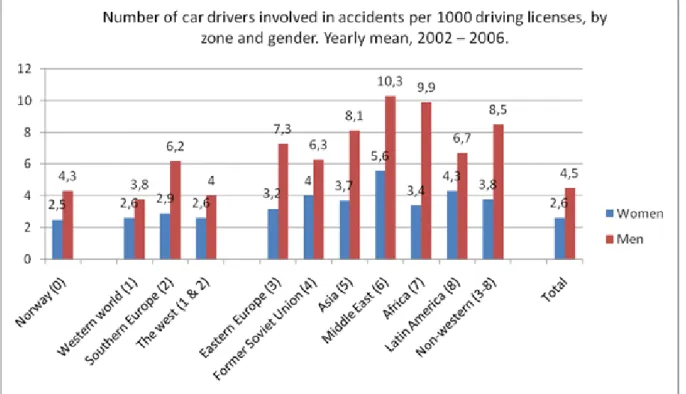
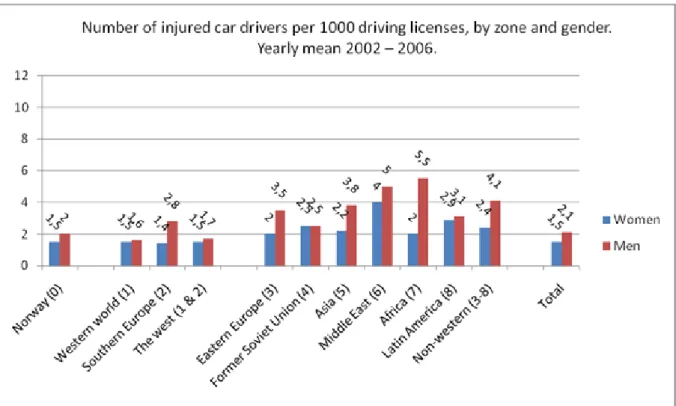
Figure 2 shows that male license holders immigrated from the Western World have slightly lower accident risk than male license holders born in Norway, whereas male license holders born in all other zones have considerably higher accident risk than male license holders born in Norway. For female drivers the differences are similar, but not as large. The difference between men and women in Figure 2 is most likely due to the fact that men drive about twice as much as women (Bjørnskau 2009, Tables 6.2 and 6.3). Information concerning number of km driven cannot be used here, because data for km driven cannot be divided into the drivers’ country of birth. Some of the difference between the license holders’ zone of birth may also be explained by km driven, because many immigrants for the Middle East and Asia are employed as taxi drivers, driving an extremely high number of km annually compared to other license holders. However, hardly any women from these zones are employed as drivers. The fact that the differences between Norwegian drivers and drivers from other global zones are more or less the same for men and women, indicate that other factors than employment as drivers influence the differences in accident risk.
Figure 2: Accident risk (number of license holders involved in injury accidents per 1 000 license holders) by zones and gender. Annual average for 2002–2006. (The number of accident involved license holders is quite small for some of the zones.)
Figure 3: Number of killed or injured drivers per 1000 license holders by zone and gender. Annual average for 2002–2006. (The number of killed or injured drivers is small for some zones.)
Figure 3 shows drivers killed or injured, and more or less the same differences appear as in Figure 2. The risk of being injured or killed is much higher for male license holders born in the Middle East or in Africa than for male drivers born in Norway or in the Western World. The differences are not as clear for female license holders.
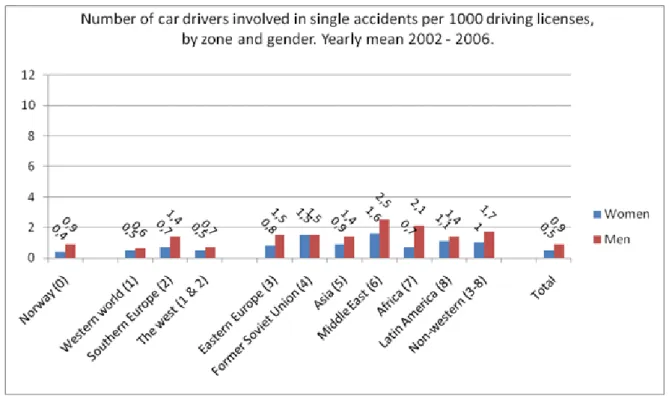
Figure 4: Number of drivers involved in single injury accidents per 1000 licenses in the zone-and-gender group, by zone and gender. Annual mean for 2002 – 2006.
Single-vehicle accidents include only drivers who are responsible for the accidents. Figure 4 shows single-vehicle accidents by drivers’ geographical zone and gender. Female drivers born in Norway have the lowest rate, 0.4 single injury-accidents per 1000 female drivers, whereas male drivers born in Norway have more than twice that rate. Male drivers from the Middle East have the highest rate of 2.5 single-vehicle injury accidents, i.e. 2.7 times higher than male drivers born in Norway. Of the female drivers those from the former Soviet Union and the Middle East have the highest rates, 1.5 and 1.6, i.e. some 3.5 times higher than female drivers born in Norway.
As mentioned, the results in Figures 2 – 4 show accidents per 1000 licenses. Thus, the differences in accident rates may be due to possible differences in the number of km driven. Bjørnskau (2009) has collected data on km driven by license holders born in different countries and computed accident rates per license holders and per million km driven. Table 3 below shows the relative accident risk of drivers in Norway by gender and country of birth.
Table 3 shows that relative accident risk varies in a similar way between countries when km driven is taken into account, as in Figures 2 – 4. However, the number of observations for km driven is small and maybe biased because of low response rates. Nevertheless, these results support the previously shown results to the effect that there are considerable differences in accident risk between car drivers in Norway born in different parts of the world.
Table 3: Accident risk of foreign-born license holders in Norway relative to that of license holders born in Norway, i.e. involved in personal-injury accidents per million km driving. 2006 - 2008*
Country of birth Male license holders Female license holders Relative risk Accidents per million km N** Relative risk Accidents per million km N** Pakistan 1.9 0.47 96 2.3 0.55 46 Iraq 3.3 0.82 167 5.3 1.28 33 Poland 1.2 0.29 224 1.1 0.26 164 Vietnam 1.6 0.39 172 1.3 0.32 99 Somalia 3.1 0.78 49 2.3 0.55 1 Norway 1.0 0.25 5067 1.0 0.24 5061
*Data for accidents and licenses are for 2002 – 2006. ** Data for km driven are from 2008. Bjørnskau (2009; based on Table 6.4). The number of license holders replying to the questionnaire concerning km driven is small for some countries, and the response rate among the immigrant license holders varied from 35 % to 0.2 %.
The main results from the figures and table above are that the accident risk is higher among immigrants from non-western countries than for Norwegians and for immigrants from Western countries. Accidents risk is highest among drivers from the Middle East and Africa. Male drivers from the Middle East and Africa have an accident risk twice as high as that of Norwegian male drivers. The accidents risk for female drivers from the Middle East is twice as high as that of Norwegian female drivers. Why do such differences exist?
3.2 Focus group interviews
The focus group interview study indicates that there may be several factors which can explain the differences in accident risk described above. Such factors are understanding of the Norwegian language, stress and problems of concentration because of worry for family members in the country of origin, cultural difference such as belief in fate, the use of psycho-active substances such as khat, differences in perceived responsibility of drivers versus pedestrians, adaptation to a new culture, the use of seat belts and the protection of children in cars, as well as motivation for complying to the highway traffic code. However, focus group interviews can only indicate possible explanations of differences in accident risk.
3.3 Questionnaire survey
The objective of the survey was to show road-safety knowledge, attitudes and behavior among immigrant car drivers and car drivers born in Norway, i.e. to answer these questions:
1. Are immigrants and native Norwegians different in terms of knowledge, attitudes and behavior related to road safety?
2. If so, which factors can explain such differences?
The methods and the sample are described in paragraph 2.4. The questionnaire used in the survey contained more than 100 questions concerning road-safety knowledge, attitudes, behavior and possible explanation factors. Because of the limited number of pages allowed for the RS4C paper, only the most important results will be presented here. No or only marginal differences between immigrant drivers and drivers born in Norway were found for topics such as the use of seat belts and child restraints, driving after drinking alcohol, and interaction with other road users. Of the drivers from Vietnam, Iraq and Pakistan 72 % reported always complying with speed limits within urban areas, whereas 36 % of the Norwegian drivers did. In rural areas the figures were 43 % and 9 % respectively.
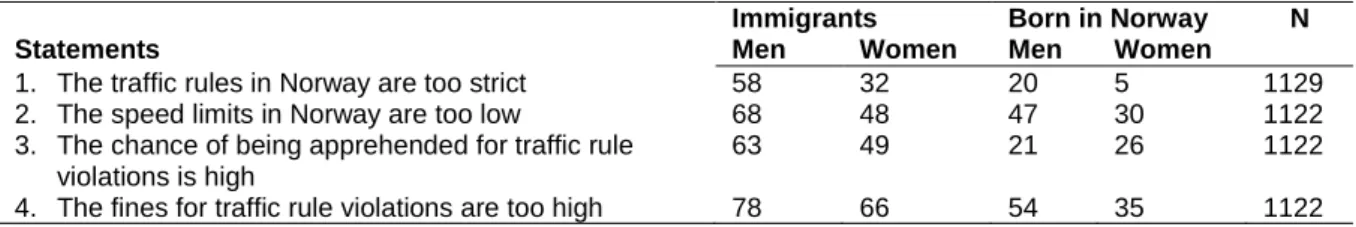
Tables 4 and 5 show significant differences between immigrants and drivers born in Norway. Immigrants – both men and women – tend to consider traffic rules too strict, speed limits too low, fines too high and the chances of being apprehended as high to a greater degree than native Norwegians. More than twice as many immigrant men than men born in Norway have been fined for road traffic violations during the last year, but there is no difference between immigrant and Norwegian-born women.
Table 4: Immigrants and native Norwegians who agree to the following statements. Per cent
Statements
Immigrants Born in Norway N Men Women Men Women
1. The traffic rules in Norway are too strict 58 32 20 5 1129 2. The speed limits in Norway are too low 68 48 47 30 1122 3. The chance of being apprehended for traffic rule
violations is high
63 49 21 26 1122
4. The fines for traffic rule violations are too high 78 66 54 35 1122 T-test: p < 0.1for all differences between immigrant and Norwegian born men. T-test: p<0.1 for all differences between immigrant and Norwegian born women, except for statement 4, where p<0.5
Table 5: Immigrants and native Norwegians being fined for traffic violations during latest 12 months. Per cent.
Immigrants Born in Norway
Men 21 10
Women 8 8
N = 1144.Chi square test p<0.005
In general the differences in knowledge, attitudes and behavior were smaller than expected between immigrant drivers and drivers born in Norway even though there are differences in attitudes to traffic rules in general, speed limits in particular, the chance of being apprehended for violations of traffic rules and the fines for such violations as well as in the percentages who have been fined for traffic violations last year.
Immigrants who have lived a long time in Norway and immigrants who have answered the questionnaire in Norwegian, appear to be more similar to the Norwegian drivers, than immigrant drivers who have lived in Norway for a shorter period and who have answered the questionnaire in their first language. 86 % of the drivers who have replied in their first language consider it difficult to pass the license test in Norway, whereas only 67 % of those who have replied in Norwegian think so.
4 DISCUSSION AND CONCLUSIONS
The general hypotheses of the study were that immigrant drivers have a higher accident risk than drivers born in Norway and immigrants from low-income countries have higher accident risk than immigrants from high-income countries. Both hypotheses were confirmed by the findings from the risk calculations based on the national registers, i.e. drivers born in non-western countries, especially in the Middle East and Africa, have higher accident risk than drivers born in Norway and other western countries.
The focus group interviews and the questionnaire survey can only partly explain these differences, but factors such as language problems, more worries among immigrants, attitudes to the traffic rules and driving behavior as reflected in the number of traffic violation fines, may contribute to differences in accident risk. The number of years lived in Norway and the ability to speak the Norwegian language may to a certain extent explain differences in attitudes and driving behavior.
The accident risk study includes holders of Norwegian driver’s licenses only. Immigrants in Norway who drive, legally or illegally, with foreign licenses, may have different accident risks. The response rates in the questionnaire survey were 17 % for immigrants and 40 % for native Norwegians. Consequently, there may be bias in the questionnaire results.
More research is needed concerning immigrants and road accidents. What is the accident risk of immigrant drivers without a Norwegian license and of immigrants walking, riding bicycles and travelling by public transport?
What can be done to reduce the accident risk of the immigrants from Africa and the Middle East? Targeted information campaigns may contribute to solving problems due to poor understanding of general information, but the road-accident reducing effects of information campaigns vary a lot. Consequently, such campaigns as well as other accident counter-measures targeted to immigrants should be assessed to make sure that they work. The immigrant population of Norway is increasing year by year, making the accident risk of immigrants an increasingly important question.
REFERENCES
Anund, A, Sörensen, G. og Yahya, M-R. (1999). Barns säkerhet i bil. En enkätundersökning i västra Sverige. VTI Notat 20-1999. Linköping, Statens väg- och
transportforskningsinstitut.
Anund, A., Forsman, Å., Gustafsson, S. og Sörensen, G. (2003). Barn i bil – Socio-ekonomiska faktorer. VTI rapport 496. Linköping, Statens väg- og
transportforskningsinstitut.
Barker, S.P., Braver, E.R., Chen, L., Pantula, J., Massie, D. (1998). Motor vehicle occupant death among Hispanic and Black teenagers. Archives of Pediatric and Adolescent Medicine, vol 152, pp 1209-1212.
Bjørnskau, T. (2009). Høyrisikogruppers eksponering og risiko i trafikk. (Road traffic exposure and risk among high risk groups in Norway. TOI-report 1042/2009. Oslo. Campos-Outcalt, D. Bay, C. Dellapena, A. And Cota, M. K. 2003. Motor vehicle crash
fatalities by race/etnicity in Arizona 1990-96. Injury Prevention, vol 9, pp 251-256. Eriksson, M. (1998) Invandrares trafiksäkerhet, en studie av utlandsfödda svenskars
trafikolycksrisker 1987-96. Internrapport, Vägverket, Borlänge.
Forward, S., Gustafsson, S., Loukopoulos, P., Nyberg, J. & Sörensen, G. (2009).
Utlandsföddas trafiksäkerhet (Traffic safety among immigrants in Sweden). Linköping. Statens väg- och transportforskningsinstitut. Report 640
Gustafsson, S., Anund, A., Sörensen, G. Og Vogel, K. 2003. Samband mellan
socio-ekonomisk bakgrund och användning av skyddsnordningar för barns säkerhet i bil. VTI notat 17-2003.
Gustafsson, S. & T. Falkmer 2006. The traffic safety situation among foreing born in Sweden. Based on eight road user population zones. VTI rapport 547A/2006. Sverige, Statens Väg- och transportforskningsinstitut.
Harper, J. S. Marine, W.M. Garret, C. J. Lezotte, D. And Lowenstein, S. R. 2000. Motor vehicle crash fatalities: A comparison of Hispanic and Non-Hispanic motorists in Colorado. Annals of Emergency Medicine, vol 36, issue 6, pp 589-596.
Kopits, E., Cropper, M. (2005) Traffic fatalities and economic growth. Accident Analysis and Prevention 37, pp. 169 - 178
Melinder, K. 2006. Socio-cultural charachteristics of high versus low risk societies regarding road traffic safety. Safety Science vol 45, issue 3, pp 397-414.
Nordbakke, S. & Assum, T (2008). Innvandreres ulykkesrisiko og forhold til trafikksikkerhet (Accident risk and traffic safety among immigrants). Oslo, Transportøkonomisk institutt. Report 988.
Norwegian Public Roads Administration. www.vegvesen.no/cs/Satellite?c=Page&cid=
1162823410532&pagename=forerkort%2FPage%2FSVVsubSideInnholdMal. Nov.1, 2008
Rismark, M., Folstad Nordberg, P., Stenøien, J. M. og S. Sitter 2003. Kulturkollisjoner bak rattet. Trondheim, VOX.
Romano, E. Tippetts, S. Blackman, K. and Voas, R. 2006. Acculturation, income, education, safety belt use, and fatal motor vehicle crashes in California. Prevention Science. Vol 6, issue 2, pp 139-148.
Romano, E. Voas, R. V. And Tippetts, S. 2006. Stop sign violations: The role of race and ethnicity on fatal crashes, Journal of Safety Research, vol 37, issue 1, pp 1-7.
Sinclair, S. A. Smith, G. A. and Xiang, H. Y. 2006. A comparison of non-fatal unintentional injuries in the United States among US-born and foreign-born persons. Journal of
Community Health. Vol 31, issue 4, pp 303-325.
Sølvberg, A.M. & Rismark, M. (2005), Kommunikasjon på flerfelts veg – innvandreres møte med norsk trafikkultur, NTNU ViLL, Trondheim.
Statistics Norway. www.ssb.no/english/subjects/02/01/10/innvbef_en/. Dec 3, 2012. Statistics Norway. www.ssb.no/innvbef. Nov 2008
Thuen, F.,Sam, D. L (1994) Bruk av sikkerhetsutstyr blant innvandrerbarn i Norge. En sammenlikning med norske barn. (Use of protective devices among immigrant children in Norway compared to Norwegian children). Tidsskrift for Norsk Lægeforening, vol. 114, pp. 195 - 198
Van Dyck, S. (2006), Immigrants in traffic – Survey Report from the Swedish Road Administration carried out by Mobiel 21 vzw,
Vägverket, Sweden. http://www.mobiel-21.be/index_eng.aspx?SGREF=1130&CREF=2173;
http://www.vv.se/templates/page3____124.aspx
Vägverket Regionerna Skåne, Sydöst och Väst 2005. Bilbältesanvändning och förekomst av alkohol och droger i dödsolyckor – Fördjupad analys av dödsolyckor i södra Sverige åren 1997-2003. Publikation 2005:69. Vägverket. Sverige.
Yahya, M-R. 2001. Invandrare och trafiksäkerhet (förstudie). En analys av tillgängeliga data i Sverige.(Immigrants and road safety – pilot study of existing data) VTI meddelande 907. Linköping, Statens väg- og transportforskningsinstitut, Sweden.
Wenäll 2001. Barn i bil. En studie av dödsolyckor under åren 1992-1997.(Children in Vehicles – fatal accidents 1992-1997). VTI-notat 46-2001. Linköping, Statens väg- og transportforskningsinstitut, Sweden.