Working Paper 2010:18
Department of Economics
Piracy, Music, and Movies:
A Natural Experiment
Department of Economics Working paper 2010:18
Uppsala University October 2010
P.O. Box 513 ISSN 1653-6975
SE-751 20 Uppsala Sweden
Fax: +46 18 471 14 78
P
iracy, M
usic,
andM
ovies: a n
aturale
xPeriMentadrian aderMonand che-yuan liang
Papers in the Working Paper Series are published on internet in PDF formats.
PIRACY, MUSIC, AND MOVIES:
A NATURAL EXPERIMENT
*
Adrian Adermon§ and Che-Yuan Liang# October 28, 2010
Abstract: This paper investigates the effects of illegal file sharing (piracy) on music and movie sales. The Swedish implementation of the European Union directive IPRED on April 1, 2009 suddenly increased the risk of being caught and prosecuted for file sharing. We investi-gate the subsequent drop in piracy as approximated by the drop in Swedish Internet traffic and the effects on music and movie sales in Sweden. We find that the reform decreased Internet traffic by 18 percent during the subsequent six months. It also increased sales of physical mu-sic by 27 percent and digital mumu-sic by 48 percent. Furthermore, it had no significant effects on the sales of theater tickets or DVD movies. The results indicate that pirated music is a strong substitute for legal music whereas the substitutability is less for movies.
Keywords: copyright protection, piracy, file sharing, music, movies, IPRED, natural experi-ment
JEL classification: D04, D12, K11, K42, M48
* We thank Mikael Elinder, Jon Gemus, John Ham, Henrik Jordahl, Tatsiana Ksionda, Mikael Lindahl, Erik
Lindqvist, Johan Lyhagen, Håkan Selin, and seminar participants at Uppsala University, the Research Institute of Industrial Economics, the Stockholm-Uppsala Doctoral Students Workshop in Economics, the Institute for Labor Market Policy Evaluation Workshop in Public and Labor Economics at Öregrund, and the National Conference of Swedish Economists for valuable comments and suggestions. We also thank Martin Warberg, Peter Lindqvist, and Tatsiana Ksionda at Growth from Knowledge (GfK) Sweden, Christian Unsgaard at GfK Norway, NetNod, the European Internet Exchange Association (Euro-IX), the Norwegian Internet Exchange (NIX), the Finnish Communication and Internet Exchange (FICIX), IFPI, IFPI Sweden, IFPI Norway, IFPI Finland, The Swedish Film Institute, Film and Kino, GfK Sweden, and GfK Norway for providing the data used in the paper; we thank Serge Radovcic at Euro-IX, Jorma Mellin at FICIX, Calle Zachrisson at Sveriges Videodistributörers Förening (SVF), and Ditte Rie Agerskov at Foreningen af Danske Videogramdistributører for help with finding the right data. The Jan Wallander and Tom Hedelius Foundation and the Uppsala Center for Fiscal Studies are acknowl-edged for financial support.
§ Uppsala Center for Labor Studies, Department of Economics, Uppsala University, P.O. Box 513, SE-75120,
Uppsala, Sweden; Phone: +46-(0)18-4717638; Fax: +46-(0)18-4711478; E-mail: adrian.adermon@nek.uu.se.
# Uppsala Center for Fiscal Studies, Department of Economics, Uppsala University, P.O. Box 513, SE-75120,
Uppsala, Sweden; Research Institute of Industrial Economics, P.O. Box 55665, SE-10215, Stockholm, Sweden; Phone: +46-(0)18-4711633; Fax: +46-(0)18-4711478; E-mail: che-yuan.liang@nek.uu.se (corresponding au-thor).
2
INTRODUCTION
Copyright protection of information goods is a topic that has been debated at least since the invention of the printing press in the 15th century. The non-rival nature of information goods means that there is a tradeoff between proper incentives to creators and public benefits from the wider distribution of works (e.g., Plant 1934; Hurt & Schuchman 1966; Boldrin & Levine 2002; Varian 2005). The level of intellectual property protection has important welfare implications. Inventions such as the photocopier, CD burners, and the Internet have made the copying of books, music, and movies inexpensive and easy and the enforcement of copyright more difficult.1
During the last decade, the debate has focused on the recorded music and movie indus-tries. Global sales of recorded music amounted to over USD 25 billion in 1999 at the trade level after a steady and continuous rise in the 1990s. The pattern was similar for movie sales. In June 1999, however, the online music file sharing service Napster popularized file sharing to a wide audience. Since then, the music and movie markets have evolved differently. Global sales of recorded music fell by 30 percent between 1999 and 2009 whereas global movie theater ticket sales grew by 75 percent. Interest groups for both industries claim that illegal file sharing of copyright-protected material, commonly referred to as “piracy”, damages the economy. Several file sharing services including Napster have also been forced to shut down by court order due to legal actions taken by the Recording Industry Association of America (RIAA) and the Motion Picture Association of America (MPAA).
It could be argued that music and movies in practice have become public goods. In view of these developments, guidelines for and evaluation of intellectual property rights policies are more important than ever. Knowledge about the effects of illegal copying on legal sales and the effectiveness of copyright protection policies is fundamental for welfare analyses of these issues.
2
In this paper, we empirically investigate the effects of copyright protection reform on Internet piracy and on sales of music and movies, and we then use these results to estimate the effect of piracy on music and movie sales.
A key requirement of an empirical investigation to identify causal effects is to isolate a random variation in piracy. Otherwise, any observed correlations between piracy and sales may stem from variations in sources such as Internet activity unrelated to piracy, cultural trends, demographics, or macroeconomics. Experimental-like variation in piracy is, however, difficult to find, and serious doubts can be raised about causal interpretations of the estimates from most existing studies.
We use the implementation of a law in Sweden on April 1, 2009, which made illegal file sharing costlier in terms of the risk of being prosecuted, as a natural experiment. The reform attracted wide media coverage by all major news media in Sweden and internationally around the time of implementation. Overnight, the reform diminished Internet traffic in Sweden by 40 percent. Because the law did not concern any Internet activities unrelated to piracy, the drop
1
In the near future, it is likely that the emergence of cheap 3D printing will make copying of physical objects available to individual consumers (“The disruptive future of printing”, Bill Thompson, BBC News, April 20 2010. Available online: http://news.bbc.co.uk/2/hi/technology/10089419.stm).
2 All statistics in this and the preceding paragraph are from the International Federation of the Phonographic
3 provides an estimate of the reform’s effect on piracy alone. Internet traffic did not recover to pre-reform levels until the end of 2009. Hence, the reform provides a large and unprecedented experimental-like variation in piracy both in terms of size and length of time.
We use a difference-in-differences strategy with Norway and Finland as control groups to estimate the reform effect on piracy and music and movie sales. We then use an instru-mental variables strategy to estimate the effect of piracy on sales. The analysis mainly focuses on the first six months following the reform.
Our results show that for each percent of decrease in piracy caused by the reform, there were statistically significant sales increases of 0.72 percent for physical music and 1.31 per-cent for digital music. In contrast, the effects are much smaller and are not statistically signifi-cant for sales of movie theater tickets and DVD movies. Assuming that the marginal effects are constant, these estimates imply that physical music sales would be 72 percent larger in the absence of piracy, which would account for 43 percent of the drop between 2000 and 2008. Pirated music appears to be a strong substitute to legal music. These results are corroborated by survey-based evidence on individual file sharing and music consumption behavior in Swe-den prior to and after the reform.
We also find that the reform effects more or less disappeared after six months except for digital music sales. This raises some doubts regarding the effectiveness of such law reforms in the long run, but it also points towards better legal alternatives to piracy as a possible way forward for the music industry.
By now, there are a considerable number of studies devoted to investigating and under-standing the economic effects of piracy. Dejean (2009) provides a review of the existing literature. To the extent that duplicated material available though file sharing is a substitute to legal purchases, economic theory predicts a negative effect of piracy on music and movie sales. Theoretical research, however, shows that there are potential mechanisms that may in-duce an opposite effect, i.e., the sampling effect, where piracy may provide a sampling op-portunity for consumers and raise the willingness to pay for goods that they know match their preferences better (Takeyama 1994; Duchêne and Waelbroeck 2006). The sign of the relation-ship is therefore an open empirical issue.
For music sales, most empirical studies find an overall negative effect3, while one study (Oberholzer-Gee and Strumpf 2007) finds no effects, and some studies that allow for heterogeneous effects find positive effects for some groups4. For movie sales, the results are more ambiguous. Some studies find negative effects5 that are smaller than what is usually found for music sales, and others find positive or no effects6
Most previous empirical studies use individual-level survey data. .
7
3 E.g., Peitz and Waelbroeck 2004; Blackburn 2006; Bounie, Bourreau, and Waelbroeck 2006; Michel 2006;
Rob and Waldfogel 2006; Zentner 2006; Bhattacharjee et al. 2007; Liebowitz 2008.
However, piracy by some individuals affects music sales to other individuals, e.g., because friends play music to each other, and such individual cross effects are difficult to account for properly. Other diffi-culties include measurement errors on infrequent purchases and reliability issues for survey responses about illegal behavior. Other studies use city- or country-level Internet penetration
4 E.g., Boorstin 2004; Bounie et al. 2005.
5 E.g., Bounie et al. 2006; De Vany and Walls 2007; Rob and Waldfogel 2007. 6 E.g., Smith & Telang 2009a; 2009b.
7
4 measures as proxies for piracy in combination with aggregate sales.8
Three studies have used a natural experiment approach and data on estimated down-loads at the album level from a P2P network to measure piracy in combination with album-level sales. Oberholzer-Gee and Strumpf (2007) used German school holidays in 2002 as an instrument for file sharing among Americans, arguing that German kids spending more time on their computers enhances the speed and availability of music files for American download-ers. They found no effects of piracy on sales. Blackburn (2006) and Bhattacharjee et al. (2007) studied the decrease in piracy among Americans that was induced by RIAA announce-ments of a lawsuit strategy against illegal file sharers in 2003, and the subsequent increase induced by a later announcement that only major offenders were in danger. In contrast to Oberholzer-Gee and Strumpf, these papers allow for heterogeneous effects depending on popularity. Blackburn finds a negative effect for popular albums and a positive effect for less popular albums while Bhattacharjee et al. find that only less popular albums are hurt in terms of survival time on sales charts.
However, Internet penetration does not fully capture Internet traffic intensity (e.g., Internet penetration did not vary after the reform whereas Internet traffic did).
A single file sharing network, however, may not be representative because different networks specialize in different kinds of activities. It is also impossible to identify complete downloads for technical reasons and because illegal file sharers want to hide their activities. Furthermore, piracy of specific albums affects sales of other albums, e.g., because listening to an album in a certain genre may affect a user’s tastes regarding other albums in that genre, and such album cross-effects are difficult to account for. Finally, all albums cannot be cov-ered.
Our data and methodology are an improvement over the existing literature in several ways. We are the first to use a measure of aggregate Internet traffic in a country to capture aggregate piracy. Combining this with aggregate sales allows a better estimation of the full effect, which accounts for any cross effects. Our natural experiment approach is also the first to incorporate control groups (i.e., neighboring countries). These controls account for trends and seasonal factors; they also enable placebo tests.
We also contribute to existing literature by providing an up-to-date study that uses re-cent data representative of modern piracy and the entertainment industry. Previous studies almost exclusively investigate the early 2000s, which is an interesting period when piracy emerged and music sales began falling. But Internet capacity has expanded fast, and piracy has evolved towards using newer technologies. In particular, no previous studies pay attention to the BitTorrent-based piracy that dominates today or the legal digital alternatives to piracy that have gained important market share.
The paper proceeds as follows. The next section provides a background on file sharing and the reform. Section three describes the data and graphically investigates the development of Internet traffic and music and movie sales. That section also provides an informal and nontechnical analysis that discloses the main results in an intuitive way. Section four outlines in detail the identification strategy and presents the regression specifications. Section five re-ports the regression estimates. The last section concludes.
8
5
BACKGROUND
File sharing
Although people have been copying music illegally since the 1960s using analog tapes, digital piracy (which allows easy reproduction without a loss of quality) became feasible in the mid- to late 1990s through the availability of affordable CD burners and the Internet in conjunction with the mp3 file format for compressing digital music. Piracy exploded when Napster was introduced in June 1999 and allowed individuals to easily search for and download music files indexed on a central server. Although Napster was shut down in 2001 after a legal battle with the recording industry, it was followed by many similar services, e.g., Gnutella, Kazaa, and Grokster. These modern services use peer-to-peer (P2P) technology in which users download files directly from each other and not from a central server.
Although initially mainly music was shared on the P2P networks, the general increase in Internet speed during the 2000s together with the development of more efficient video en-coding techniques made it feasible to also share movies and TV shows. In 2001, the BitTor-rent protocol was released. With previous P2P protocols, popular files were sometimes hard to get because users queued up to download from the suppliers. With BitTorrent, all users downloading a file both upload and download pieces of the file simultaneously in a decentra-lized fashion so that the more popular a file is, the faster the download becomes. In 2002, the first major BitTorrent tracker, Supernova, was started, and the Sweden-based site The Pirate Bay followed in 2003, becoming the largest BitTorrent site in terms of traffic in 2008 (Alexa) when it reached 25 million unique peers (The Pirate Bay). The speed and availability provided by the BitTorrent protocol has made it the most popular protocol used by P2P networks today (Schultze & Mochalski 2007; 2009).
During the last decade, the recorded music and movie industries ramped up their legal battle against file-sharing networks by shutting down several large tracker sites from 2004 onwards. The piracy issue has received great attention over the last five years starting with the police raid against The Pirate Bay on March 31, 2006 wherein servers were confiscated. Law suits and trials followed with hearings starting on February 16, 2009. Four site operators were found guilty on April 17, 2009, less than a month after the law reform that we use, but the site continues to operate.
Sweden is one of the most developed countries in the world in terms of Internet pene-tration. It is among the top ten with respect to density of broadband subscribers, percentage fiber among broadband connections, and broadband access density among households. Swe-den is therefore of interest for other countries because it is on the IT frontlines and provides a forecast for countries less developed in this respect.
The IPRED law
The Intellectual Property Rights Enforcement Directive 2004/48/EC (IPRED) is a European Union directive that was passed on April 29, 2004 under article 95 of the Treaty of Rome. The directive regulates the enforcement of intellectual property rights, especially concerning evi-dence, and was set to be implemented before April 29, 2006. However, by October 2006 only 12 of the 25 member states had implemented the directive (Ipeg 2006). The Swedish
govern-6 ment declared its intention to implement the IPRED directive as Swedish law9
IPRED
in March 2008. The law was passed on February 25, 2009, and it was implemented on April 1 of the same year.
10
In mid- to late-April, several large Swedish ISPs
allows an intellectual property rights holder to demand information about the person behind a specific Internet Protocol (IP) address from an Internet Service Provider (ISP) if there is a reasonable suspicion that this person infringed on the intellectual property in question. The copyright holder must present evidence tying the infringement to a specific IP address in court, which may then order the ISP to provide the information necessary to iden-tify and prosecute the infringing individual. The court will only take this step if the individual has uploaded copyright protected material or has downloaded large volumes of copyright protected material. With BitTorrent technology, however, all users simultaneously upload and download data. Thus, most file sharers were affected by IPRED.
11
declared that they would start destroying their IP logs so that their customers would not have to be concerned about IPRED. The largest ISPs12
Although IPRED is not the first legal reform concerning file sharing, incidental evi-dence and public perceptions suggest that this reform is likely to have had a strong deterring effect on piracy and is much more forceful than any previous reforms in Sweden due to the relatively strong formulation of the Swedish law together with the highly publicized trial of The Pirate Bay, which was conducted during the weeks around the implementation of the law. There was strong public opinion against the law, which culminated in the Swedish elections to the European parliament on June 7, 2009 where the single-issue Pirate Party received 7 per-cent of the total vote and a seat in the European parliament.
have, however, not followed suit. So far, there have only been a few legal cases pleading the new law. On the day the new law was implemented, five audiobook pub-lishers requested the identity of a person behind an IP address associated with piracy. In late July, four movie companies filed a motion for details about the operators of a BitTorrent tracker, and in early December the Swedish section of the International Federation of the Phonographic Industry (IFPI) filed to get information on an IP address that has been used for music piracy. None of these court cases have so far led to any information actually being handed over as all have been appealed to higher courts.
The institutional development, however, suggests some need for carefulness in the em-pirical analysis and in the interpretation of the results. Because the law was passed more than a month before the implementation, it is plausible that there might have been anticipatory ef-fects. File sharers may have tried to stock up on downloadable music and movies when ticipating the implementation. We have examined this hypothesis and find no support for an-ticipatory behavior. Because the legal processes have been slow and nobody has yet been convicted, it is plausible that people came to reevaluate the risk of getting caught, reconsi-dered their initial fears, and started to share files again a few months later. The reform effect may hence have been heterogeneous over time, and we allow for this in the analysis.
9 Adelsohn Liljeroth, Lena, “Kulturarbetare får stöd av domstol”, Svenska Dagbladet, March 14, 2008. 10 Henceforth IPRED will refer to the Swedish implementation of the directive unless otherwise stated. 11 Bahnhof, Alltele, and Tele2.
12
7
DATA AND GRAPHICAL ANALYSIS
Internet traffic
We use data on aggregate Internet traffic through Internet Exchange Points (IXPs). We cap-ture changes in piracy by assuming that changes in Internet traffic after the reform (after ac-counting for time effects) can be attributed to changes in piracy alone. Because the reform provides variation at the country level, we use data at this level to avoid complications in the estimation due to correlation between local units.
The Internet is, loosely speaking, a network of networks. An IXP connects the smaller networks. For a more detailed description of how the Internet and IXPs work, see Appendix A. Traffic between two users on the same network does not, however, pass through IXPs. For the results to be representative for all traffic, it is necessary that the relative reform effect on piracy is the same for between- and within-network piracy. This is most likely to hold because BitTorrent, the most popular P2P protocol by far, does not allow users to select where to download from. All downloads usually involve within- and between-network traffic, and us-ers cannot select the share of each kind of traffic to use. Furthermore, the law does not discri-minate between different kinds of traffic. It is possible that different shares of within- and between-network traffic is piracy. This is, however, not a problem as long as the relative re-sponse in piracy due to the reform is the same.
We have a weekly Internet traffic panel for Sweden, Norway, and Finland for 2009. The data are in weekly averages and are measured in gigabits per second (Gbps). The data come from the largest IXPs in Sweden, Norway, and Finland. The Swedish data are provided by Netnod, the Norwegian data by Norwegian Internet Exchange (NIX), and the Finnish data by Finnish Communication and Internet Exchange (FICIX). These IXPs provide the vast major-ity of between-network connections in their respective countries.
The development of Internet traffic is plotted in Figure 1. A solid line is used for Swe-den, a dashed line for Norway, and a short-dashed line for Finland. A vertical line marks the last time point before the reform. A gray line is used to indicate a prediction of the develop-ment of the Swedish Internet traffic without any reform effect for the post-reform period from April to December 2009 using the estimates reported in the results section. Data series plots follow this structure throughout this section.
8 Figure 1. Internet traffic
Average Internet traffic in 2009 was 90.83 Gbps in Sweden, 12.29 Gbps in Norway, and 22.81 Gbps in Finland. We see that Swedish Internet traffic decreased sharply in the first week of April at the time of the reform.13 Neither Norway nor Finland shows such a drop at this date. In fact, there are no other changes of this magnitude between adjacent points in time in our data. Swedish Internet traffic recovers toward the end of the year. Some of this increase seems to be common for all countries. There are some time effects such as trends and seasonal effects when disregarding the post-reform period in Sweden. The trends look reasonably pa-rallel for all three countries in the pre-reform period and between Norway and Finland in the post-treatment period. There are no signs of an anticipation effect near the end of February when the law was passed. A comparison to the no-reform graph indicates that there was a strong immediate reform effect and a subsequent recovery that was completed by the end of the year.
Music sales
For aggregate music sales, we use quarterly data from 2004 to 2009 for physical recorded music sales and from 2007 to 2009 for digital recorded music sales. Before 2007, digital sales were negligible. All sales numbers are at the trade level, and they are adjusted for inflation and converted to 2009 SEK.14
Figure 2
The music data are provided by local branches of the IFPI. IFPI members have a 95 percent market share in Sweden, 90 to 95 percent in Norway, and 86 per-cent in Finland. The development of sales is plotted in .
13 The drop was 40 percent on the reform day. Since the whole drop can be attributed to piracy, this share can be
used as an estimate of the lower bound on piracy’s share of pre-reform Internet traffic.
14
The average USD/SEK exchange rate was 7.6 in 2009.
0 5 10 15 20 25 0 20 40 60 80 1 00 1 20 G bp s
01jan2009 01apr2009 01jul2009 01oct2009 01jan2010
Sweden
No reform (predicted)
Norway Finland
9 Figure 2. Music sales
Physical sales were SEK 719 million in Sweden, SEK 578 million in Norway, and SEK 389 million in Finland in 2009. We see that the sales trends were negative. The seasonal patterns of second quarter troughs and last quarter peaks are also clear. Furthermore, the trend and seasonal patterns may be, to some degree, country specific. In each of the first two quarters after the reform, sales increased compared to the same quarters in the previous year in Swe-den, which is a pattern that cannot be found for any two consecutive quarters in the countries without a reform or in Sweden prior to the reform.
Digital sales were SEK 140 million in Sweden, SEK 103 million in Norway, and SEK 39 million in Finland in 2009. We see that sales trends were positive and not unlikely country-specific. The sales increase in Sweden after the reform is, however, a clear trend break. The increase in the three post-reform quarters does not have a counterpart elsewhere in the data.
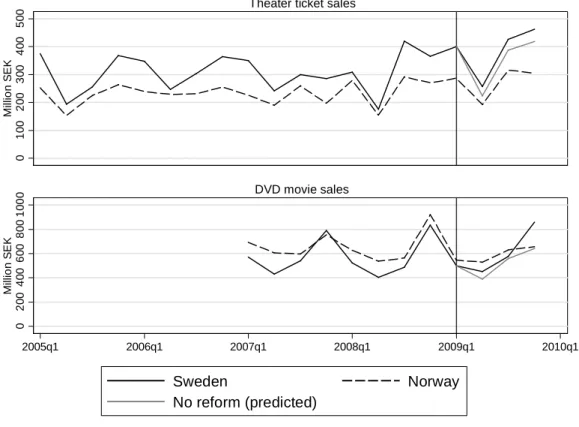
Movie sales
For aggregate movie sales, we use quarterly data from 2005 to 2009 for movie theater ticket sales and from 2007 to 2009 for DVD movie sales. DVD sales accounted for 87 percent of total video sales in Sweden in 2009, so other formats are relatively unimportant (GfK Swe-den). The third large market for the movie industry, video rentals, is left out of the analysis due to the lack of reliable data. However, video rentals are the smallest of these three markets; total sales were only 25 percent of the size of the theater ticket market and 16 percent of the size of the video sales market in Sweden in 2009 (Swedish Film Institute; Sveriges Videodi-stributörers Förening). 0 100 200 300 400 M illio n S E K
Physical music sales
0 10 20 30 40 50 M illio n S E K 2004q1 2005q1 2006q1 2007q1 2008q1 2009q1
Digital music sales
Sweden Norway
10 The Swedish ticket data were provided by the Swedish Film Institute and cover all Swedish movie theaters that provide public screenings.15 The Norwegian ticket data were pro-vided by Film & Kino and cover the 46 largest movie theaters in Norway, which account for around 90 percent of visits nationwide. The DVD data were provided by the Swedish and Norwegian branches of the market research company GfK. The DVD data are estimates based on individual consumer survey panels consisting of around 5,000 random households in Swe-den and around 3,000 random individuals in Norway. The ticket numbers are given at the consumer level16, and the DVD numbers are given at the trade level. The development of sales is plotted in Figure 3.
Figure 3. Movie sales
Ticket sales were SEK 1,545 million in Sweden and SEK 1,144 million in Norway in 2009, and they have been almost constant between 2005 and 2008. We see that there are strong sea-sonal patterns. In each of the quarters after the reform, sales increased compared to the same quarters in the previous year in Sweden. Such a pattern can, however, be found elsewhere such as in Norway in 2009 and in Sweden in 2006.
DVD sales were SEK 2,405 million in Sweden and SEK 2,436 million in Norway in 2009. Again, we see that there are strong seasonal patterns. In each of the quarters after the reform, sales increased compared to the same quarters in the previous year. In the results sec-tion, we estimate small, positive effects on both ticket and DVD sales that are not statistically significant.
15 Screenings to which the general public can buy tickets. 16
These include VAT and thus are not directly comparable to the music and DVD numbers.
0 1 00 2 00 3 00 4 00 5 00 M illio n S E K
Theater ticket sales
0 2 00 4 00 6 00 8 00 10 00 M illio n S E K 2005q1 2006q1 2007q1 2008q1 2009q1 2010q1 DVD movie sales Sweden Norway No reform (predicted)
11
IDENTIFICATION STRATEGY AND SPECIFICATIONS
We now turn our attention to quantifying the reform effects and estimating the effects of pi-racy on music and movie sales. To identify the effect of pipi-racy on music and movie sales, it is not enough to observe a correlation as this could arise from variations in other sources. For example, a large interest in music in a country at a certain point in time could cause high le-vels of piracy and music sales at the same time even absent any relationship between piracy and music sales. Alternatively, an economic recession could cause an increased level of piracy and a decreased level of music sales. To overcome these problems requires the isolation of exogenous variation in piracy that is as good as experimental, i.e., a ceteris paribus variation in piracy where every other source that may affect the outcome is held constant.
We use the IPRED reform to obtain such a variation in piracy. First, we estimate the impact of the reform on Internet traffic. Because the reform did not concern any Internet ac-tivities unrelated to piracy, the drop provides an estimate of the reform effect on piracy alone. If the timing of the implementation was based on factors related to piracy, such factors may confound the reform estimates. We solve this by using Norway and Finland, two countries similar to Sweden in geographical, cultural, and technological aspects but without any reform at this time, as control groups to control for common trends and seasonal factors. Thus, we identify the reform effect on Internet traffic using a difference-in-differences approach.
We estimate the reform effect on piracy using the following regression:
ln 𝑇𝑟𝑎𝑓𝑓𝑖𝑐𝑖𝑡 = 𝜶𝑹𝒆𝒇𝒐𝒓𝒎𝑖𝑡+ 𝜎𝑡+ 𝜂𝑖+ 𝜀𝑖𝑡 (1)
where 𝑖 is a country index and 𝑡 is a time period index. 𝑹𝒆𝒇𝒐𝒓𝒎𝑖𝑡 is the post-reform vector
of dummy variables for April to December 2009 in Sweden, which allows the effect to vary over time. Although we have weekly data, we use reform dummies at the quarterly level since there is substantial noise in the week-to-week variation. The variable 𝜎𝑡 is a quarterly time-fixed effect, the variable 𝜈𝑖 is a country fixed effect, and 𝜀𝑖𝑡 is an idiosyncratic error term. We take logs of the outcome levels to account for level differences between countries.
The reform effect estimates of Internet traffic in 𝜶 provide a lower bound of the reform effect on piracy. To get estimates of the reform effect on piracy 𝜶𝑃, we need to scale 𝜶 by piracy’s share of all Internet traffic prior to the reform, 𝛿. We know of no estimates of this number for Sweden, but a report from German Internet traffic analysis firm Ipoque (Schultze & Mochalski 2009) provides estimates of the proportion of Internet traffic that consists of file sharing in several European countries. Estimates for the Nordic countries are not provided, but the share is 53 percent in Germany, 70 percent in Eastern Europe, 55 percent in Southern Europe, and 54 percent in Southwestern Europe. Although there are legal uses for P2P technology, the vast majority of all file sharing consists of piracy. Assuming that Sweden is close to Germany in this respect, we set 𝛿 = 0.5. This is a reasonable lower bound on piracy’s share of Internet traffic and also produces a lower bound on the effect of piracy on sales, but it produces an upper bound on the reform effect on piracy. The results can easily be rescaled by a constant for the reader that finds this assumption implausible or wants to have reversed
12 bounds instead.17
In the second step, we estimate the impact of the reform on music and movie sales using the regression
As we do not have standard errors for the rescaling factor, we simply treat 𝛿 as a constant.
ln 𝑆𝑎𝑙𝑒𝑠𝑖𝑡 = 𝜷𝑹𝒆𝒇𝒐𝒓𝒎𝑖𝑡+𝜇𝑖𝑠+ 𝜆𝑖 ⋅ 𝑡 + 𝜎𝑡+ 𝜂𝑖 + 𝜀𝑖𝑡, (2) which is similar to equation (1) with the addition of the country-specific seasonal quarter dummies 𝜇𝑖𝑠 and the country-specific linear time trends 𝜆𝑖 ⋅ 𝑡. Country-specific time effects were not included for Internet traffic because that data are only available from one year and because inspection of the Internet traffic data did not reveal any such effects in Figure 1.
To the extent that there may be spillover effects of the Swedish reform on its neighbors, the reform effect estimates would be downward biased in the difference-in-differences esti-mation. It is unlikely that the reform would directly influence file sharers in neighbor coun-tries. However, the availability of files in a country may affect piracy in other countries be-cause file sharing is a cross-national activity. Less piracy in Sweden can thus decrease the supply of pirated material for, e.g., Norway. This is, however, to some degree offset by traffic between Sweden and Norway being replaced by heavier traffic within Norway and between Norway and other countries. Any important spillover effects would result in a discontinuous drop in Internet traffic in Norway and Finland at the reform date. The absence of such drops in Figure 1 indicates that we need not worry about spillovers. For sales, there is no reason to expect any spillover effects.
Serial correlation in the error term within units might be a concern. Clustering, as sug-gested by Bertrand et al. (2004), does not produce consistent standard errors when there are only at most three units. Collapsing data across time into a pre- and post-reform period would leave too few observations to construct standard errors in our case. An option is to use the Newey-West standard error correction (Newey and West 1987), which requires specifying the length of the correlation over time. We have performed this correction allowing for correla-tions up to six months, and it turns out that those standard errors are very close to and usually smaller than the conventional ordinary least squares standard errors. Consequently, we report the more conservative uncorrected standard errors.18
To obtain an average reform effect during more than one period, we take a weighted av-erage of the elements in 𝜶 and 𝜷, respectively. The estimate for each time period is weighted by the counterfactual Internet traffic (predicted using Equation 1) and sales (predicted using Equation 2) for that period without any reform.19
We now shift focus to the estimation of the effect of piracy on music and movie sales. The quotients between the elements of 𝜷 and the scaled estimates 𝜶𝑃 provide estimates of the effect of piracy on sales 𝜸, i.e., 𝛾𝑡 = 𝛽𝑡⁄𝛼𝑃,𝑡. Since both are estimates of proportional
17 A hard lower bound would be 𝛿 = 0.4, i.e., all piracy ceased after the reform. Conversely, a hard upper bound
would be 𝛿 = 1, i.e., all internet traffic is piracy. We believe that these assumptions are both unreasonable and focus on a number that has at least indirect empirical support.
18 Angrist & Pischke (2008) recommend reporting the largest of the conventional and robust standard errors. 19 It is possible to estimate effects for several time periods by imposing homogeneous effects instead. If effects
are heterogeneous over time, the variation in effects between time periods would, however, contribute to the estimation of time effects and lead to a bias.
13 changes, the quotients are the sales elasticities of piracy, i.e., the percentage reaction of sales to a percentage change in piracy for small changes in piracy. To get a single estimate, we use the weighted average for the whole reform period.
The two-step strategy can be seen as an instrumental variables strategy where the reform is the instrument for piracy. Equations (1) and (2) are the reduced-form equations. Eq-uation (1) is also the first-stage eqEq-uation. The second stage structural eqEq-uation is then
ln 𝑆𝑎𝑙𝑒𝑠𝑖𝑡 = 𝛽𝛼ln 𝑇𝑟𝑎𝑓𝑓𝑖𝑐𝑖𝑡+𝜇𝑖𝑠+ 𝜆𝑖⋅ 𝑡 + 𝜎𝑡+ 𝜂𝑖 + 𝜀𝑖𝑡. (3)
To get the sales elasticity of piracy 𝛾, the sales elasticity of Internet traffic 𝛽 𝛼⁄ needs to be rescaled using piracy’s share of all Internet traffic prior to the reform, 𝛿. Because of the need to rescale the first-stage coefficient and the fact that we use different samples and partially different control variables for Equations (1) and (2), we cannot use the standard two-stage least squares estimator. Instead we use the two-sample instrumental variables procedure de-veloped in Angrist (1990) and Angrist & Krueger (1992; 1995).
The two underlying assumptions of instrumental variables are instrument exogeneity and relevance. Instrument exogeneity requires the reform to be uncorrelated with 𝜀𝑖,𝑡 condi-tional on the other covariates, i.e., �𝜀𝑖,𝑡�𝑹𝒆𝒇𝒐𝒓𝒎𝑖,𝑡, 𝜇𝑖𝑠, 𝜆𝑖 ⋅ 𝑡, 𝜎𝑡, 𝜂𝑖� = 𝐸�𝜀𝑖,𝑡�𝜇𝑖𝑠, 𝜆𝑖 ⋅ 𝑡, 𝜎𝑡, 𝜂𝑖�. This is an exclusion restriction requiring that the reform did not
af-fect sales other than through its efaf-fect on piracy. Since the only direct efaf-fect of the reform is the effect on piracy by making piracy seemingly riskier, this assumption is reasonably ful-filled. Instrument relevance requires the reform to be strongly correlated with Internet traffic and can be gauged by looking at the precision of the instrument in the first-stage equation. This assumption can be tested, and Table 1 confirms that it is fulfilled as the reform effect on Internet traffic is strongly statistically significant.
The reduced-form coefficients in the log-linear model, which assumes constant expo-nential effects, have a proportional interpretation at the margin. For discrete variables, the coefficients can be transformed by an exponential to provide a non-marginal relative reform effect with an implicit constant marginal effect assumption (Halvorsen & Palmquist 1980). Predictions of sales for different piracy levels can be made in two ways: by using the elastic-ity estimate or by using the non-marginal transformed estimate. When making sales predic-tions in the absence of piracy, we use the latter because the constant elasticity assumption is not reasonable for extrapolations.
Whenever transformations of estimates are made, we construct the standard errors using the delta method. Following Dee & Evans (2003), we also construct instrumental variables standard errors using the delta method under the assumption of zero covariance between the reduced-form estimates.20
20 We have also estimated both equations jointly using collapsed data. The covariance between the reduced-form
estimates is negative, which would produce smaller standard errors than the zero covariance assumption. This indicates that our standard error estimates are upward biased and conservative.
14
RESULTS
Reduced-form estimates
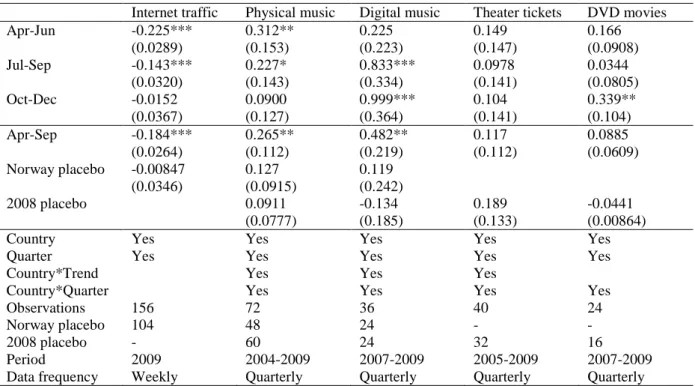
The reform effect estimates, estimated using ordinary least squares, are reported in Table 1. Internet traffic estimates from Equation (1) are reported in the Internet traffic column. Esti-mates of Equation (2) for sales of physical and digital recorded music, movie theater tickets, and DVD movies are reported in the following columns. For each outcome variable, the quarterly relative reform effects are first reported followed by the weighted average for the first six months after the reform in the Apr-Sep row. These provide a summary measure of the reform effect. Below this, we report the corresponding placebo estimates where Norway
pla-cebo is estimated by placing the reform in Norway and omitting Sweden21, and the 2008
pla-cebo is estimated by placing the reform in April 2008 and omitting 2009 for all countries.22
Since there are fewer degrees of freedom in the placebo regressions, coefficient and standard error estimates come with higher variability and are not completely comparable to the main estimates. Not all time controls are included and not all placebos are estimated due to data restrictions.
Table 1. Reduced-form estimates
Internet traffic Physical music Digital music Theater tickets DVD movies
Apr-Jun -0.225*** 0.312** 0.225 0.149 0.166 (0.0289) (0.153) (0.223) (0.147) (0.0908) Jul-Sep -0.143*** 0.227* 0.833*** 0.0978 0.0344 (0.0320) (0.143) (0.334) (0.141) (0.0805) Oct-Dec -0.0152 0.0900 0.999*** 0.104 0.339** (0.0367) (0.127) (0.364) (0.141) (0.104) Apr-Sep -0.184*** 0.265** 0.482** 0.117 0.0885 (0.0264) (0.112) (0.219) (0.112) (0.0609) Norway placebo -0.00847 0.127 0.119 (0.0346) (0.0915) (0.242) 2008 placebo 0.0911 -0.134 0.189 -0.0441 (0.0777) (0.185) (0.133) (0.00864)
Country Yes Yes Yes Yes Yes
Quarter Yes Yes Yes Yes Yes
Country*Trend Yes Yes Yes
Country*Quarter Yes Yes Yes Yes
Observations 156 72 36 40 24
Norway placebo 104 48 24 - -
2008 placebo - 60 24 32 16
Period 2009 2004-2009 2007-2009 2005-2009 2007-2009
Data frequency Weekly Quarterly Quarterly Quarterly Quarterly
Dependent variables are log transformed. Relative reform effect estimates 𝑒𝛼𝑡− 1 are reported. Apr-Sep reports
the weighted average for the first six months after the reform ∑ [(𝑒𝑡 𝛼𝑡− 1)𝑒𝑙𝑛 𝑦𝑖𝑡−𝛼𝑡]⁄∑ [𝑒𝑡 𝑙𝑛 𝑦𝑖𝑡−𝛼𝑡] where the
weight is the outcome without the reform. Country and Quarter refer to country and quarter dummies, respec-tively. Country*Quarter and Country*Trend refer to country-specific seasonal quarter dummies and linear trends, respectively.Norway placebo reports the first six months effect when implementing a placebo reform in
Norway and excluding Sweden while 2008 placebo reports the corresponding estimate when implementing a placebo reform in 2008 and excluding 2009. Standard errors are constructed using the delta method and are re-ported in parentheses. * p<0.10, ** p<0.05, *** p<0.01.
21 Placing the placebo reform in Finland would produce an exact mirror image of the Norway placebo.
22 The purpose of the placebo tests is to examine whether statistical significance in the regressions is the result of
15 The Internet traffic estimates are negative and statistically significant in each of the first two quarters. The immediate effect in the first quarter is -22.5 percent, and falls to -14.3 percent in the second quarter after which the effect is small and statistically insignificant. According to these estimates, Internet traffic recovered six months after the reform. The whole effect for the first six months prior to recovery is -18.4 percent, and statistically significant at the one percent level. The Norway placebo estimate is much smaller and not statistically significant. We have tried allowing anticipatory effects in March. This produces insignificant reform es-timates in March, and the post-reform eses-timates are largely unchanged.
Although we can be very confident in interpreting the initial drop as a drop in piracy, interpretation of the later estimates as true reform effects requires us to assume that the com-position of Internet traffic other than piracy has not changed differentially between the coun-tries. Although Internet traffic returned to its previous trajectory in late 2009, this could be due to people migrating to legal Internet streaming services such as Spotify for music and Voddler for movies to a greater extent in Sweden than in its neighbors. This would produce a downward bias in the reform estimates for later periods. We focus on the first six months after the reform as piracy either recovered thereafter or our Internet traffic estimates measure pi-racy with a bias.
The music sales estimates are positive and statistically significant in each of the first two quarters for physical music and in each of the last two quarters for digital music. We also see that the effect on physical music is large initially and then tapers off towards the end of the year. This is consistent with the pattern for Internet traffic. For digital music, the effect instead increases over time. The effect for the first six months is 26.5 percent for physical music and 48.2 percent for digital music. The effect on digital music is hence almost twice that on physical music. The placebo estimates are smaller and not statistically significant.
The very strong upturn in digital sales is likely due to a migration from piracy to legal streaming services such as Spotify. The delayed response in digital sales could be due to ca-pacity constraints in the streaming services immediately after the reform.23
The movie sales estimates are positive but not statistically significant except in the last quarter for DVD sales. The effects for the first six months are much smaller than for music sales. These estimates are not statistically significant although the precision is too low to re-ject a small positive effect. The placebo estimates are similar in size to the reform estimates and are also not statistically significant.
The sudden in-crease in demand could have triggered a technological expansion in those services that caused further growth in sales even as Internet traffic (as well as piracy, although not to the same degree) recovered. Another explanation to the persistency in digital sales in the last quarter could be that once people start to use streaming services regularly, it becomes a habit that they continue. In a wider perspective, the reform may have marked a milestone where the digital market seriously started to compete with the physical market.
Our reduced-form results are complemented with individual survey data evidence, which is presented in Appendix B. A sample of individuals in Sweden has been asked about their file sharing and music consumption behavior prior to and after the reform. Questions on
23 During this period, user accounts for both the music streaming service Spotify and the video streaming service
Voddler were distributed by invite only (except for the paid premium version of Spotify), which thereby main-tained tight control on the growth of their user bases.
16 file sharing include how often the respondents used file sharing sites to download music and whether IPRED has changed their use of those sites. Questions on music consumption include whether consumption behavior changed after IPRED and questions about knowledge and use of digital streaming services. The answers corroborate our results that piracy decreased and that music sales increased after the reform. They also indicate that the reform really is the cause of the decrease in piracy and that music consumption increased to compensate for the decrease in piracy.
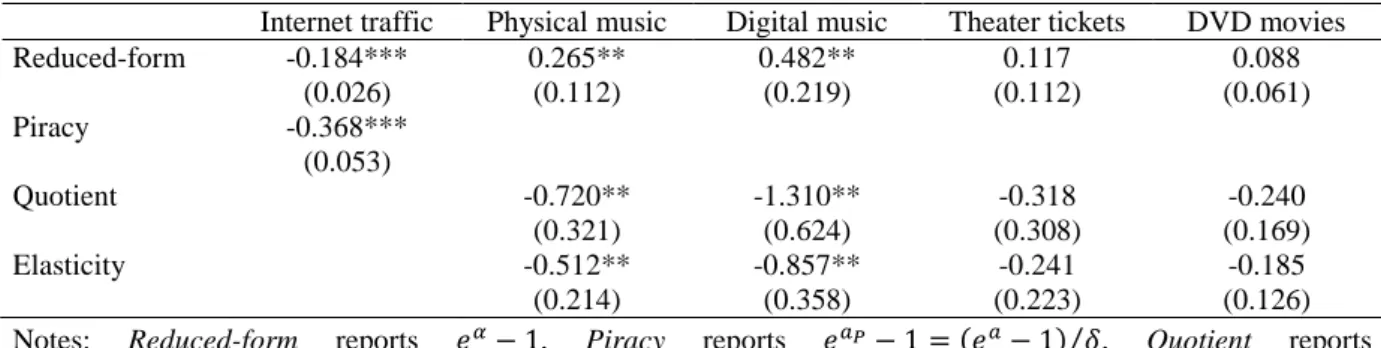
Two-sample instrumental variables estimates
The estimates of the effect of piracy on sales estimated using the two-sample instrumental variables procedure are reported in Table 2. The reduced-form estimates of the relative reform effect in the first six months after the reform are reproduced in the Reduced form row. The first-stage Internet traffic estimate is then inflated by the inverse of piracy’s share of Internet traffic to obtain the relative reform effect on piracy in the Piracy row. The structural two-sample instrumental variable estimates are then reported in the last two rows. Non-marginal relative reform effects on sales of the relative reform effect on piracy are reported in the
Quo-tient row, and the sales elasticities of piracy are reported in the Elasticity row.
Table 2. Two-sample instrumental variables estimates
Internet traffic Physical music Digital music Theater tickets DVD movies
Reduced-form -0.184*** 0.265** 0.482** 0.117 0.088 (0.026) (0.112) (0.219) (0.112) (0.061) Piracy -0.368*** (0.053) Quotient -0.720** -1.310** -0.318 -0.240 (0.321) (0.624) (0.308) (0.169) Elasticity -0.512** -0.857** -0.241 -0.185 (0.214) (0.358) (0.223) (0.126)
Notes: Reduced-form reports 𝑒𝛼− 1, Piracy reports 𝑒𝑎𝑃− 1 = (𝑒𝑎− 1) 𝛿⁄ , Quotient reports
�𝑒𝛽− 1� (𝑒⁄ 𝑎𝑃− 1), and Elasticity reports 𝛽 𝛼⁄ . 𝛿 = 0.5. Standard errors are constructed using the delta me-𝑃
thod and are reported in parentheses. * p<0.10, ** p<0.05, *** p<0.01.
All instrumental variables estimates are negative as expected, but only the estimates on music sales are statistically significant. The estimated effects are -0.720 percent for physical music sales and -1.310 percent for digital music sales for each percent of piracy decrease caused by the reform. Under the assumption that the marginal effects are constant, this implies that physical music sales would have been 72 percent larger and digital music sales 131 percent larger if piracy did not exist. Our estimates imply that around 43 percent of the drop in physi-cal music sales between 2000 and 2008 can be attributed to piracy. This would support the music industry’s claim that piracy is the main cause of the decline. The elasticities are -0.512 between piracy and physical music sales and -0.857 between piracy and digital music sales. For countries with similar per capita sales and piracy as Sweden, these figures provide useful guidelines for the impact of piracy in those countries.
It is difficult to compare estimates between studies for several reasons. Comparing elas-ticities between samples is not meaningful since elaselas-ticities are not constant at the different levels of piracy between the samples. For example, it is not likely that doubling the amount of
17 piracy has larger proportional effects when piracy is high than when it is close to zero. Com-paring marginal effects is more reasonable. However, without knowing the piracy levels in different countries and only having information on relative marginal effects, the comparison is problematic. The same relative effect of piracy on sales translates into different absolute ef-fects of piracy on sales. In the following, relative marginal efef-fects are compared with this complication in mind.
Most studies find that music sales would have been 0 to 40 percent higher in the ab-sence of piracy in the U.S. at some point in time during the period 1998 to 2006 (the estimates in Oberholzer and Gee (2006) are on the lower end, and the estimates in Blackburn (2006) are on the higher end). In comparison, our estimates are on the higher end. However, Internet traf-fic has also increased tremendously over time (It has sextupled in Finland between 2003 and 2009 for the kind of Internet traffic data that we use (FICIX)). Our estimates are therefore not inconsistent with previous results in terms of relative marginal effects. This also implies that the estimates in the literature translate into larger numbers in terms of the size of the indus-tries without piracy today than for the periods investigated.
18
CONCLUSIONS
This paper empirically investigates the effects of piracy on music and movie sales. The Swe-dish implementation of the IPRED law on April 1, 2009 suddenly increased the risks of pi-racy. We investigate the subsequent drop in piracy, approximated by the drop in Swedish In-ternet traffic, and the effects on music and movie sales in Sweden.
We find that the reform decreased Internet traffic by 18 percent during the subsequent six months. It also increased sales of physical music by 27 percent and sales of digital music by 48 percent. Furthermore, it had no significant effects on the sales of theater tickets or DVD movies although we cannot rule out small positive effects. Assuming that the marginal effects are constant, these estimates imply that physical music sales would be 72 percent larger in the absence of piracy; this would account for 43 percent of the drop between 2000 and 2008, which would support the music industry’s claims that piracy was the main cause of the de-cline. The elasticities are -0.51 between piracy and physical music sales and -0.86 between piracy and digital music sales.
Our results indicate that pirated music is a strong substitute to legal music, whereas the substitutability is less for movies. It is clear that copyright protection is important from the music industry’s point of view. The sizeable effects also suggest that there may be important welfare implications of file sharing, but a complete analysis requires estimates of the con-sumer surplus from piracy and of the sales effects on incentives for creators.
From a dynamic perspective, the immediate decrease in piracy following IPRED caused an increase in the demand for legal music. Probably due to capacity constraints in the digital music market, the immediate increase was largest for physical sales. As the supply of digital music responded to the increased demand, digital sales increased whereas physical sales de-creased, which indicates a substitution from physical to digital music. After six months, pi-racy recovered to a large extent, which resulted in a decrease in the demand for legal music and decreased physical as well as total sales. However, digital sales continued to grow, which indicates that there were further increases in the supply of digital music and that the previous migration to this market was permanent.
From a policy evaluation perspective, IPRED was effective in preventing piracy and in increasing music sales for the first six months. Some of these effects must be attributed to a combination of the law and widespread public interest. The deterrent effect decreased quickly. As no court cases are settled, it is possible that convictions would restore an effect that is more long-lasting. IPRED may also have enhanced the technological developments of the digital music market, which lead to a migration to this market. These effects seem to be long-lasting as indicated by persistent digital sales increases even as piracy recovered.
19
APPENDIX A – HOW INTERNET TRAFFIC WORKS
Each device (server, personal computer, etc.) connected to the Internet has a unique IP ad-dress. A collection of adjacent IP addresses is referred to as an IP prefix. In order for data packets to reach their destination, the Internet Routing Table contains a list of possible paths by which a packet can reach a specific IP address.
On a more aggregated level, the Internet can be said to consist of Autonomous Systems (AS). An AS is usually a network operated by a single administration such as an Internet ser-vice provider (ISP), a government, or a large corporation. Examples of Autonomous Systems include AT&T, TeliaSonera, Microsoft, Google, and the Swedish University Computer Net-work (SUNET). Formally, an AS is defined as a group of one or more IP prefixes that have a single and clearly defined routing policy (Hawkinson & Bates 1996). There are over 30,000 Autonomous Systems in the Internet Routing Table.24
In order for an Internet user to be able to reach any location on the Internet, Autonom-ous Systems have to interconnect. This is done through commercial agreements, which are classified as either peering or transit. A peering agreement allows two networks to exchange traffic between each other. In contrast, in a transit agreement one AS pays another AS to carry its traffic to and from the rest of the Internet. Transit agreements are usually used when a small AS needs to connect to the Internet. Traditionally, the Internet is divided into tiers with Tier 1 networks loosely defined as those large networks that tie together the Internet through-out the world. Tier 2 networks are smaller, often regional networks. The Tier 1 networks peer with one another, and the Tier 2 networks buy transit from the Tier 1 networks. Tier 2 net-works often can also peer with one another.
Both peering and transit can physically be set up separately between each pair of con-nected networks, but most of these connections are made at Internet Exchange Points (IXPs). An IXP is a physical network infrastructure operated by a single entity with the purpose of facilitating the exchange of Internet traffic between Autonomous Systems (Radovcic 2009). The number of Autonomous Systems connected should be at least three, and there must be a clear and open policy for others to join.
Many IXPs operate sites in several geographic locations. IXPs are usually run as not-for-profit organizations. Euro-IX lists 121 known IXPs in Europe (Radovcic 2009) while Packet Clearing House list 512 IXPs worldwide.25 Netnod operates facilities in Stockholm, Gothenburg, Malmoe, Sundsvall, and Lulea, and it connects 56 networks. NIX operates facil-ities in Oslo, Bergen, Trondheim, Stavanger, and Tromsoe, and it connects 69 networks. FI-CIX operates facilities in Helsinki, Espoo, and Oulu, and it connects 28 networks. In 2009, Sweden had the second highest per capita peak IXP traffic in Europe with only the Nether-lands having higher per capita traffic (Radovcic 2009).26
24 CIDR Report, http://www.cidr-report.org/as2.0/.
Finland was ranked 8th and Norway 9th.
25 PCH Internet Exchange Directory: https://prefix.pch.net/applications/ixpdir/.
26 Netnod members are listed on http://www.netnod.se/connected.shtml; NIX members are listed on
20
APPENDIX B – INDIVIDUAL SURVEY DATA EVIDENCE
To provide additional corroborative evidence to our results, we present some survey-based evidence in this Appendix. The survey questions cover file sharing and music behavior prior to and after the IPRED reform in Sweden as well as the reasons for altered behavior. In June 2009, two months after the reform, GfK conducted an investigation of music consumption habits in Sweden. One year later, a follow-up was made. The objective of the surveys was to provide a picture of the music market with respect to consumption behavior and attitudes. The target group was the Swedish population in the age span from 15 to 74 years old. An indepen-dent random sample from their Global Online Panel was used for each of the years. 1,006 responses were received in 2009 and 1,060 responses in 2010. The response rate was 66 per-cent in 2009 and 56 perper-cent in 2010.
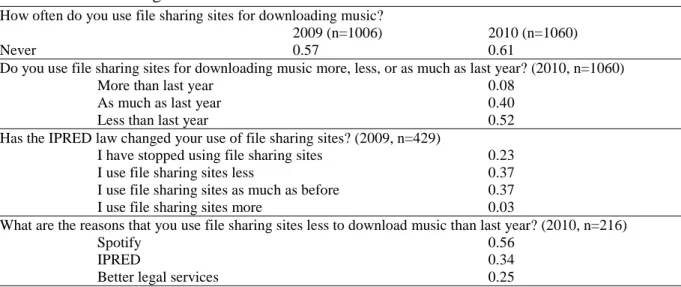
Questions and responses on file sharing behavior and the reasons for this behavior are reported in Table A1. Respondents were asked about their file sharing behavior. Although the 2009 survey was conducted after the reform, the responses on this question mainly reflect pre-reform behavior as the response alternatives referred to behavior up to a year ago. The 2010 responses reflect the post-reform behavior. The share of those that never file share increased from 57 to 61 percent after the reform, a difference that is statistically significant at the ten percent level. When asked in 2010 about the extent of file sharing compared to the previous year, a statistically significant 52 percent responded that they file share less than last year (it is not totally clear whether the respondents had pre-reform or post-reform behavior in mind when thinking of the last year here).
Table A1. File sharing behavior and reasons
How often do you use file sharing sites for downloading music?
2009 (n=1006) 2010 (n=1060)
Never 0.57 0.61
Do you use file sharing sites for downloading music more, less, or as much as last year? (2010, n=1060)
More than last year 0.08
As much as last year 0.40
Less than last year 0.52
Has the IPRED law changed your use of file sharing sites? (2009, n=429)
I have stopped using file sharing sites 0.23
I use file sharing sites less 0.37
I use file sharing sites as much as before 0.37
I use file sharing sites more 0.03
What are the reasons that you use file sharing sites less to download music than last year? (2010, n=216)
Spotify 0.56
IPRED 0.34
Better legal services 0.25
Notes: All response options are not reported for the first and last questions. Multiple response options were possible in the last question.
The group that responded that they did file share in 2009 was also asked whether the reform has changed their file sharing behavior. Of this group, 60 percent responded that they have either stopped or decreased their file sharing activities, which is a statistically significant share. The group that responded that they file share less in 2010 than last year was also asked about the reasons for this behavior. The digital streaming music service Spotify, the IPRED
21 reform, and better legal services were the three main reasons, all having statistically signifi-cant shares. Of course, Spotify also existed before the reform, and the increased use of it as well as better legal services can be seen as outcomes driven by the reform.
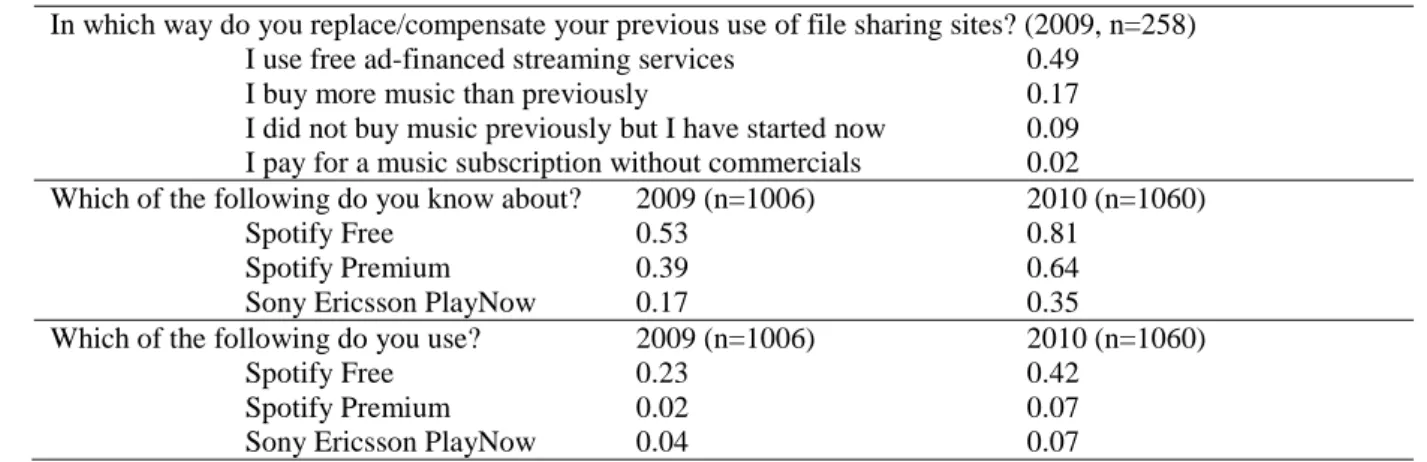
Questions and responses on how music downloads through file sharing have been re-placed are reported in Table A2. The respondents that answered that they file shared less or stopped file sharing due to the reform in 2009 were asked about how they replaced or com-pensated the music downloaded through file sharing. Almost half of them started to use free ad-financed digital streaming services. However, a statistically significant share did buy more music than previously. To explore their knowledge of different digital music providers, res-pondents were asked about their knowledge and use of different digital music services in 2009 and 2010. The three largest changes during the year after the reform occurred for digital mu-sic streaming services Spotify Free (ad-financed), Spotify Premium, and Sony Ericsson Play-Now. The changes are all statistically significant.
Table A2. How music downloads from file sharing have been replaced
In which way do you replace/compensate your previous use of file sharing sites? (2009, n=258) I use free ad-financed streaming services 0.49
I buy more music than previously 0.17
I did not buy music previously but I have started now 0.09 I pay for a music subscription without commercials 0.02
Which of the following do you know about? 2009 (n=1006) 2010 (n=1060)
Spotify Free 0.53 0.81
Spotify Premium 0.39 0.64
Sony Ericsson PlayNow 0.17 0.35
Which of the following do you use? 2009 (n=1006) 2010 (n=1060)
Spotify Free 0.23 0.42
Spotify Premium 0.02 0.07
Sony Ericsson PlayNow 0.04 0.07
Notes: All response options are not reported. Multiple response options were possible.
This survey evidence alone should, however, not be given too much weight. It provides a before-and-after analysis without accounting for other time effects. A survey data analysis also encounters the problems discussed in the introduction. However, the survey evidence provides corroborative consumption side support to the conclusion in this paper that piracy decreased and music sales increased after the reform.
22
REFERENCES
Angrist, J.D., 1990. Lifetime Earnings and the Vietnam Era Draft Lottery: Evidence from Social Security Administrative Records. American Economic Review, 80(3), 313-336. Angrist, J.D. & Krueger, A.B., 1995. Split-Sample Instrumental Variables Estimates of the
Return to Schooling. Journal of Business & Economic Statistics, 13(2), 225-235. Angrist, J.D. & Krueger, A.B., 1992. The Effect of Age at School Entry on Educational
At-tainment: An Application of Instrumental Variables with Moments from Two Sam-ples. Journal of the American Statistical Association, 87(418), 328-336.
Angrist, J.D. & Pischke, J., 2008. Mostly Harmless Econometrics: An Empiricist's
Compa-nion, Princeton: Princeton University Press.
Bertrand, M., Duflo, E. & Mullainathan, S., 2004. How Much Should We Trust Differences-in-Differences Estimates? Quarterly Journal of Economics, 119(1), 249-275.
Bhattacharjee, S. et al., 2007. The Effect of Digital Sharing Technologies on Music Markets: A Survival Analysis of Albums on Ranking Charts. Management Science, 53(9), 1359-1374.
Blackburn, D., 2006. The Heterogenous Effects of Copying: The Case of Recorded Music. Job Market Paper (Harvard Ph.D. Programme).
Boldrin, M. & Levine, D., 2002. The Case against Intellectual Property. American Economic
Review, 92(2), 209-212.
Boorstin, E.S., 2004. Music Sales in the Age of File Sharing. Senior thesis, Princeton Univer-sity.
Bounie, D., Bourreau, M. & Waelbroeck, P., 2006. Piracy and the Demand for Films: Analy-sis of Piracy Behavior in French Universities. Review of Economic Research on
Copy-right Issues, 3(2), 15-27.
Bounie, D., Bourreau, M. & Waelbroeck, P., 2005. Pirates or Explorers? Analysis of Music Consumption in French Graduate Schools. Telecom Paris Economics Working Paper No. EC-05-01.
De Vany, A.S. & Walls, W.D., 2007. Estimating the Effects of Movie Piracy on Box-office Revenue. Review of Industrial Organization, 30(4), 291-301.
Dee, T.S. & Evans, W.N., 2003. Teen Drinking and Educational Attainment: Evidence from Two-Sample Instrumental Variables Estimates. Journal of Labor Economics, 21(1), 178-209.
Dejean, S., 2009. What Can We Learn from Empirical Studies About Piracy? CESifo
Eco-nomic Studies, 55(2), 326-352.
Duchêne, A. & Waelbroeck, P., 2006. The Legal and Technological Battle in the Music In-dustry: Information-Push versus Information-Pull Technologies. International Review
of Law and Economics, 26(4), 565-580.
Halvorsen, R. & Palmquist, R., 1980. The Interpretation of Dummy Variables in Semiloga-rithmic Equations. American Economic Review, 70(3), 474-475.
Hawkinson, J. & Bates, T., 1996. Guidelines for Creation, Selection and Registration of an
23 Hurt, R.M. & Schuchman, R.M., 1966. The Economic Rationale of Copyright. American
Economic Review, 56(1/2), 421-432.
Ipeg, 2006. Summary of the Implementation of the Directive 2004/48 on the Enforcement of
Intellectual Property Rights (the "Directive") in EU Member States as per October 2006, The Hague: Intellectual Property Expert Group.
Liebowitz, S.J., 2008. Research Note - Testing File Sharing's Impact on Music Album Sales in Cities. Management Science, 54(4), 852-859.
Michel, N.J., 2006. The Impact of Digital File Sharing on the Music Industry: An Empirical Analysis. B.E. Journal of Economic Analysis & Policy, 6(1).
Newey, W.K. & West, K.D., 1987. A Simple, Positive Semi-Definite, Heteroskedasticity and Autocorrelation Consistent Covariance Matrix. Econometrica, 55(3), 703-708.
Oberholzer-Gee, F. & Strumpf, K., 2007. The Effect of File Sharing on Record Sales: An Empirical Analysis. Journal of Political Economy, 115(1), 1-42.
Peitz, M. & Waelbroeck, P., 2004. The Effect of Internet Piracy on Music Sales: Cross-Section Evidence. Review of Economic Research on Copyright Issues, 1(2), 71-79. Plant, A., 1934. The Economic Aspects of Copyright in Books. Economica, 1(2), 167-195. Radovcic, S., 2009. European Internet Exchange Association 2009 Report on European IXPs,
Euro-IX.
Rob, R. & Waldfogel, J., 2006. Piracy on the High C’s: Music Downloading, Sales Displace-ment, and Social Welfare in a Sample of College Students. Journal of Law and
Eco-nomics, 49(1), 29-62.
Rob, R. & Waldfogel, J., 2007. Piracy on the Silver Screen. Journal of Industrial Economics, 55(3), 379-395.
Schultze, H. & Mochalski, K., 2007. Internet Study 2007, Leipzig: ipoque. Schultze, H. & Mochalski, K., 2009. Internet Study 2008/2009, Leipzig: ipoque.
Smith, M.D. & Telang, R., 2009a. Competing with Free: The Impact of Movie Broadcasts on DVD Sales and Internet Piracy. MIS Quarterly, 33(2), 321-338.
Smith, M.D. & Telang, R., 2009. Piracy or Promotion? The Impact of Broadband Internet Penetration on Dvd Sales. Working Paper.
Takeyama, L.N., 1994. The Welfare Implications of Unauthorized Reproduction of Intellec-tual Property in the Presence of Demand Network Externalities. Journal of Industrial
Economics, 42(2), 155-166.
Varian, H.R., 2005. Copying and Copyright. Journal of Economic Perspectives, 19(2), 121-138.
Zentner, A., 2006. Measuring the Effect of File Sharing on Music Purchases. Journal of Law
WORKING PAPERS* Editor: Nils Gottfries
2009:8 Che-Yuan Liang, Nonparametric Structural Estimation of Labor Supply in the Presence of Censoring. 48pp.
2009:9 Bertil Holmlund, Incentives in Business and Academia. 12pp.
2009:10 Jakob Winstrand, The Effects of a Refinery on Property Values – The Case of Sweden. 27pp.
2009:11 Ranjula Bali Swain and Adel Varghese, The Impact of Skill Development and Human Capital Training on Self Help Groups. 28pp.
2009:12 Mikael Elinder. Correcting Mistakes: Cognitive Dissonance and Political Attitudes in Sweden and the United States. 25 pp.
2009:13 Sören Blomquist, Vidar Christiansen and Luca Micheletto: Public Provision of Private Goods and Nondistortionary Marginal Tax Rates: Some further Results. 41pp.
2009:14 Mattias Nordin, The effect of information on voting behavior. 34pp. 2009:15 Anders Klevmarken, Olle Grünewald and Henrik Allansson, A new
consumer price index that incorporates housing. 27 pp.
2009:16 Heléne L. Nilsson, How Local are Local Governments? Heterogeneous Effects of Intergovernmental Grants. 41pp.
2009:17 Olof Åslund, Per-Anders Edin, Peter Fredriksson and Hans Grönqvist, Peers, neighborhoods and immigrant student achievement – evidence from a
placement policy. 27 pp.
2009:18 Yunus Aksoy, Henrique S. Basso and Javier Coto-Martinez, Lending Relationships and Monetary Policy. 42 pp.
2009:19 Johan Söderberg, Non-uniform staggered prices and output persistence. 38 pp.
2010:1 Jonathan Gemus, College Achievement and Earnings. 43 pp.
2010:2 Susanne Ek and Bertil Holmlund, Family Job Search, Wage Bargaining, and Optimal Unemployment Insurance. 30 pp.
2010:3 Sören Blomquist and Laurent Simula, Marginal Deadweight Loss when the Income Tax is Nonlinear. 21 pp.
2010:4 Niklas Bengtsson, The marginal propensity to earn, consume and save out of unearned income in South Africa. 34 pp.