Reports
Reports on food waste statistics financed by the Swedish EPA
• Stare Malin, Johansson Malin, Dunsö Olof, Stenmarck Åsa, Sörme Louise, Jensen Carl, (2013),
Förbättrade matavfallsfaktorer för verksamheter [Better food waste factors for businesses and organizations], SMED Report no. 117
• Jensen Carl, Stenmarck Åsa, Sörme Louise, Dunsö Olof (2011), Matavfall från jord till bord
[Food waste from field to fork], SMED Report no. 99
• Stenmarck Åsa, Jensen Carl, Sundqvist Jan-Olov, Sörme Louise, Szudy Mikael (2011), Förslag på
metodik för förbättrade matavfallsdata från tjänstesektorn och hushåll [Proposal for methodology to improve food waste data from the services sector and households], SMED Report no. 48
• Stenmarck Åsa, Gottberg Annika (2009), Utredning: Animaliskt och vegetabiliskt avfall
[Investigation: Animal and vegetable waste], SMED Report no. 29
• Stenmarck Åsa (2007), Biologiskt avfall från livsmedelsbutiker – faktorer för returer från butiker
till grossist [Biological waste from supermarkets – factors for returned goods from stores to wholesaler], SMED Report no. 13
Our production, distribution and consumption of food have a significant impact on our environment. Considerable focus has recently been put on the need to improve resource-efficiency in our society. Reducing the large volumes of food waste will be a key part of this challenge. It is also important to separate and make biogas from the food waste that nevertheless is generated. The Swedish Environ-mental Protection Agency (Swedish EPA) has been working for a number of years to produce data and calculate food waste volumes – it is important to know how large these volumes are and where they are generated in order to monitor objectives and implement appropriate measures and instruments.
This report summarizes food waste volumes for 2012 and presents recalculated figures for 2010. The volumes for each sector are given in Table 1 below. Each chapter contains a description of how the volumes have been calculated.
As can be seen in the above table, households are responsible for the largest volumes of food waste. About 35 percent of their food waste is unnecessary food waste, i.e. food that could have been eaten if it had been handled differently (SMED 2011). There is currently no comprehensive data for agriculture and fishing (primary production). Only unnecessary food waste is presented for industry. If we were to include what is called “unavoidable” food waste, the total volume from industry would amount to 642,000 tonnes.
The differences between the 2010 data presented here and the data previously reported for 2010 (Jensen et al. 2010) are due to the fact that all waste factors have now been updated and the data is therefore more comprehensive than previously – the increase for 2010 is not therefore due to greater waste volumes but to an improvement in the calculation method.
Summary
TABLE 1. GENERATED FOOD WASTE VOLUMES IN 2010 AND 2012
Generated food waste in 2010 Generated food waste in 2012
Of which
Sector Tonnes Kg/person Tonnes Kg/person unnecessary %
Agriculture and fishing – – – – –
Industry 171,000 18 171,000 1 18 – Supermarkets 67,000 7 70,000 7 91 Restaurants 127,000 14 142,000 15 62 Catering facilities 58,000 6 58,000 6 52 Households 680,000 72 771,000 81 35 Total 1,104,0002 117 1,211,0002 127 –
1 The data for 2012 have not been updated using the same method, which is why the data for 2010 is presented.
Food production causes significant environmental impact. It affects environmental aspects such as the climate, acidification, ecotoxicity, eutrophication and biodiversity. For example, it is responsible for about 50 percent of all eutrophication. Food production also contributes to the spread of environmental toxins, including pesticides. In addition, it is one of the most water-demanding sectors.
Most food waste is thrown away by households, although it occurs at all stages in the food supply chain; during manufacture, at the wholesaler’s, during distribution, at the retailer’s, at restaurants and in catering facilities as well as in households. Production of the amount of food thrown away every year corresponds to around two million tonnes of carbon dioxide emissions, which is about three percent of total greenhouse gas emissions in Sweden.
If we were to eat the food we throw away (known as “unnecessary” food waste or “food wastage”), we wouldn’t need to produce as much. This would in turn reduce the environmental impact from the food supply chain. From an environmental point of view, less food waste would reduce energy use, raw material consumption and emissions from the production, transport and handling of food. In a wider perspective, the food produced could feed more people without increasing the environmental impact. This is important if we are to achieve Sweden’s environmental objectives. Sustainable food
production is also crucial if we are to solve several of the global problems linked to natural resources and the environment, such as climate change, water scarcity, deforestation and overfishing.
There are many ongoing initiatives in the European Union aimed at reducing food waste and this is reflected in various documents and objectives. The food waste issue has been highlighted as an impor-tant one for the Member States to work on.
The Swedish EPA cooperates with a large number of actors in order to reduce food waste, including those in the SaMMa group (food waste reduction action group). Reducing food waste and improving resource efficiency in the food supply chain is a priority area in Sweden’s National Waste Plan.1 The
Swedish EPA also highlights the issue in its Waste Prevention Programme.2 In December 2013, the
Agency presented a proposal to the Swedish Govern-ment for a milestone target for reduced food waste. The Agency is also working together in 2013–2015 with the National Food Administration and the Swedish Board of Agriculture on a government assignment aimed at reducing food waste.
It is approximately ten times as efficient to stop the occurrence of food waste rather than utilizing it for biological treatment (Hansen, 2011). From a resource efficiency point of view, however, it is important to separate the food waste that is nevertheless gener-ated and treat it biologically. In 2012, the Swedish
Background
1 http://www.naturvardsverket.se/Om-Naturvardsverket/Publikationer/ISBN/6500/978-91-620-6502-7/ 2 http://www.naturvardsverket.se/Miljoarbete-i-samhallet/Miljoarbete-i-Sverige/Uppdelat-efter-omrade/Avfall/
Government adopted a milestone target for increased resource efficiency in the food supply chain:
It is important to know how much food waste there is and where it occurs in order to monitor objectives and implement appropriate measures and instruments. The Swedish EPA has tasked SMED (Swedish Environmental Emissions Data)3 to analyse
food waste volumes in Sweden in 2010 and 2012. This report summarizes the results for both years. It presents both how much waste has been generated and how the volumes have been calculated. When data is available, the various categories of food
included in the food waste are presented (e.g. dairy products, bread, meat, etc.).
Liquid food waste is currently not included in the volumes reported here since there are no data for it, the exception being the food industry where liquid food waste is included in the volumes. SMED is currently implementing a project commissioned by the Swedish EPA and the National Food Adminis-tration to develop a method that can measure the volumes of liquid food waste from households. The project is expected to be finalized in the spring of 2014.
3 SMED – Svenska Miljö Emissions Data |Swedish Environmental Emissions Data], a consortium consisting of Swedish University
of Agricultural Sciences (SLU), Swedish Meteorological and Hydrological Institute (SMHI), Statistics Sweden and IVL (Swedish Environmental Institute). IVL and Statistics Sweden are responsible for compiling data on waste. The SMED consortium was formed in 2001 with the aim of bringing together and improving skills in Sweden in the field of emissions statistics linked to the measures being implemented in the areas of air and water pollution, waste and hazardous substances.
THE SWEDISH GOVERNMENT’S MILESTONE TARGET FOR INCREASED RESOURCE EFFICIENCY IN THE FOOD SUPPLY CHAIN:
“Measures are to be implemented to increase
resource efficiency in the food supply chain by
ensuring that at least 50 percent of the food waste
from households, catering facilities, shops and
restaurants is separated and treated biologically
so that plant nutrients are utilized, and where at
least 40 percent is treated to recover the energy
no later than 2018.”
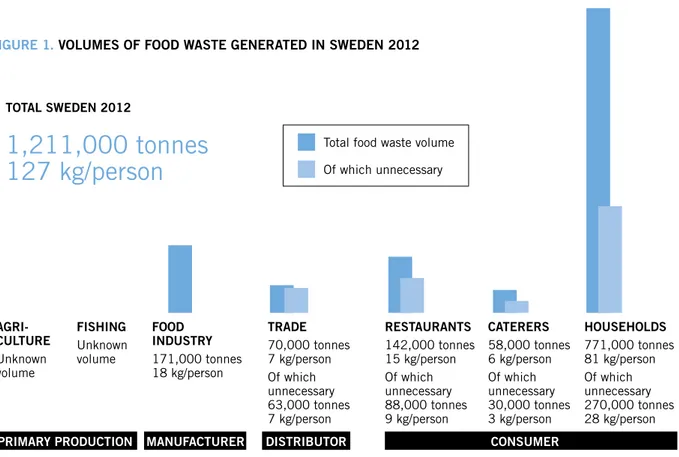
Excluding agriculture and fishing (due to a lack of comprehensive data), a total of approximately 1,210,000 tonnes of food waste was generated in Sweden in 2012. This is the equivalent of 127 kg per person. The total volume of food waste is made up of waste from producers, distributors and consumers. The producers are divided into primary production, which includes agriculture and fishing, and manu-facturers referring to the food industry. Distributors are supermarkets including wholesalers (wholesalers
have been surveyed but were shown to generate very small volumes of food waste). Consumers include restaurants, catering facilities and households. DATA COMPARABILITY
The differences in the volumes reported earlier for 2010 (Jensen et al, 2010) and the revised figures reported here are due to the fact that the waste factors (volume of food waste per employee or portion) for supermarkets, restaurants and catering
Total waste volumes in Sweden
FOOD INDUSTRY 171,000 tonnes 18 kg/person FISHING Unknown volume AGRI-CULTURE Unknown volume TRADE 70,000 tonnes 7 kg/person Of which unnecessary 63,000 tonnes 7 kg/person RESTAURANTS 142,000 tonnes 15 kg/person Of which unnecessary 88,000 tonnes 9 kg/person CATERERS 58,000 tonnes 6 kg/person Of which unnecessary 30,000 tonnes 3 kg/person HOUSEHOLDS 771,000 tonnes 81 kg/person Of which unnecessary 270,000 tonnes 28 kg/person
PRIMARY PRODUCTION MANUFACTURER DISTRIBUTOR CONSUMER
TOTAL SWEDEN 2012
1,211,000 tonnes
127 kg/person
Total food waste volume Of which unnecessary
facilities were previously too low. They were based on how much separated food waste a supermarket, restaurant or catering facility threw away. Despite the existence of separation facilities for food waste, it emerged that a great deal was nonetheless thrown as mixed waste.4 The new factors for supermarkets,
restaurants and catering facilities also include the volumes of food waste thrown as mixed waste. The data for 2012 and the recalculated figures for 2010 are hence of a better quality. As the same waste factors are used for both years, the differences in the volumes between the years now depend on changes in the number of employees or served portions (which are the factors used to extrapolate the volumes to the national level). Food waste volumes have also increased for households. This is because the total volume of waste thrown as mixed waste is greater and since the food waste volumes are partly calcu-lated as a percentage of the mixed waste, they also
increase. The percentage of food waste in the mixed waste has also increased, leading to greater volumes in 2012 as well. In addition, home-composting of food waste has also been included in the updated volumes for households, for both 2010 and 2012.
For all the sectors described above, the uncertain-ties are greater than the differences. We can also see that the percentage of separated food waste volumes from households that is treated biologically has increased from 194,000 tonnes in 2010 to 251,000 tonnes in 2012, which is of course a positive develop-ment and in line with set environdevelop-mental objectives.
As regards the food industry, it is clear that the definition of food waste has a crucial bearing on the size of the volumes reported. In 2010, a stricter definition was used, in which generated volumes had to have been fit for human consumption in order to be classified as food waste. In 2012, on the other hand, the definition has been brought more into line with the definitions being developed on the EU level and the boundary for what is classified as food waste has therefore been changed. This means that it is not possible for the food industry to compare food waste data from 2010 with 2012. When statistics are compiled from corporate environmental reports, it is also difficult to distinguish “unnecessary” from “un-avoidable” food waste, as the waste is not reported in these categories. The food industry also generates by-products (e.g. peel/shell residue and abattoir waste that are made into animal feed) which has not been classified as food waste in this survey but which could in certain cases have been made into food.
When compiling data, the results obtained always depend on the methods, definitions and delimita-tions used. Different methods of compiling data invariably produce different results. It is there-fore unreasonable to expect data that has been compiled in different ways to be fully comparable. It can still be useful, however, to compare and analyse any differences there are in the data in order to establish whether the magnitude is cor-rect, whether anything has been overlooked, etc. Problems arise because data is often presented without a proper description of the methodology.
Unnecessary food waste – food that could have been eaten provided that it has been handled correctly and eaten by its use-by date. Examples of unnecessary food waste are bread, food left-overs, fruit and vegetables. Unnecessary food waste is sometimes referred to as food wastage.
Unavoidable food waste – generated during food preparation or production and difficult to reduce. Examples of unavoidable food waste are coffee dregs, various types of peel, abattoir waste, etc. The total volume of food waste is unnecessary food waste and unavoidable food waste added together. What is unnecessary food waste may vary from one person to the next. Some families eat pigs’ trotters, for example, while others do not. Some people peel their potatoes, others do not. It is therefore inappropriate to use the definition unnecessary food waste in a national objective as it is difficult to devise a common definition and there is a considerable risk of subjec-tivity when following up such an objective. It also demands much more thorough analyses each time a measurement is to be made since we would then need to separate the food waste into unnecessary and unavoidable fractions. The cost of follow-up would be noticeable greater if only unnecessary food waste were to be followed up. Reduced food waste is a reliable indicator for reduced unnecessary food waste.
A great deal of work is ongoing not only in Sweden but also in other countries, regarding which definitions are to be used for food waste and wastage. A recently
completed OECD study has compared the organiza-tion’s member countries regarding the issue of food waste. Available data on wastage in OECD countries shows that there are considerable differences in the measurement methods and definitions, making it very difficult to draw international comparisons.
Discussions are also ongoing within the EU project FUSIONS5 and within FAO6 regarding common
definitions of food waste and food wastage. By-products/waste – Industrial processes generate by-products. By-products are products that can be put to some form of use other than the intended use of the main product. An example from the food industry is residual products from abattoirs and dairies that are used to make animal feed. In those cases where we have been able to surmise this from the environmental reports, we have elected not to classify it as waste. This is particularly difficult in the food industry as it is also a cultural issue and a question of what we eat and don’t eat. Some of the residual products that go to making animal feed might be deemed fit for human consumption in other countries or may previously have been eaten to a greater degree in Sweden. One such example is pigs’ trotters, which we don’t eat too much nowadays, but which are perfectly edible. This means that some of the material that has been classified as by-product should perhaps have been classified as food waste if we adhere rigidly to the definition that everything that is edible is to be counted as food waste.
Definition of food waste
5 FUSIONS – Food Use for Social Innovation by Optimising Waste Prevention Strategies – EU project to reduce food waste 6 FAO – Food and Agricultural Organisation (UN)
It is very difficult to find comprehensive data from agriculture and fishing. The Swedish Board of Agriculture has completed a project (financed by the Nordic Council of Ministers) to devise waste factors for five different categories – carrots, potatoes, pork, milk and onions (Franke et al, 2013). The results of this project do not provide a comprehensive picture of the volumes of food waste generated in agricul-ture. The report also ascertains that the definition of food waste is difficult to apply in agriculture and fishing - what counts as food waste and what is necessary production waste? Different actors inter-pret this in different ways nowadays, so a project to develop a common definition or approach is neces-sary. The report makes it clear however that large volumes of food that could be eaten are currently being thrown away. The funding for a follow-on project is in place and the project will be finalized in 2014. Hopefully, the results of the project can pro-vide more input and perhaps enable us to calculate how much food waste is generated in the sector.
Farmers and farming organizations were contacted in 2010 to find out how much waste was being generated in different types of agriculture. Those interviewed pointed out that in the agricultural sec-tor it was mostly a question of quality and price; it’s nearly always possible to sell a lower quality, but at a lower price and perhaps for something other than food production. Lower-quality fruit and vegetables are often made into animal feed, for example. One farmer expressed it thus: “In Sweden, things like
mineral fertilizer and labour are so expensive that we can’t afford not to sell”. Since such large volumes of food are produced in Sweden, even the very small proportion of food waste that is generated can give rise to relatively large amounts of waste. The fact that these volumes are indeed large is confirmed in Franke et al, 2013, where it is calculated that the waste from the product groups examined in their study amounts, on its own, to about 45,000 tonnes of food that is either used for animal feed or thrown away.
In agriculture, the weather combined with low or fluctuating consumer demand (including supermar-kets) make a major contribution to the generation of food waste.
Neither is there comprehensive data for the fishing industry, where they often talk about by-catches and fish processing waste. By-catch is fish caught un- intentionally and then thrown back into the water. There are no data for by-catches. It is however possible to calculate the amount of fish processing waste generated based on other statistics. However, this does not provide a comprehensive picture of how much food waste is generated from the sector.
In conclusion, we can ascertain that there are large gaps in our knowledge when it comes to food waste data from agriculture and fishing, although studies are currently ongoing. Uncertainties about the defini-tions of food waste partly explain the missing data. For this reason, no food waste from agriculture and fishing is presented in this report.
Sweden has approximately 3,700 food producers. About 40 percent are sole proprietorships while a few are very large businesses with hundreds of em-ployees. These larger companies include e.g. dairies, abattoirs, bakeries, grain companies (producers of e.g. breakfast cereals, flour, muesli), sugar producers, cider presses, juice producers and breweries (wine, beer and spirit).
Animal waste normally includes abattoir waste, such as visceral contents, blood, feathers and offal. Vegetable waste includes large volumes of sludge from breweries and testae and seed coating from
cereal-growers. There are other residual products, known as by-products, that are not counted here as waste since they can be used for animal feed, etc. A common by-product generated when dairy machinery is being started up and pipelines are being cleaned is feed milk. Feed milk, as the name sug-gests, is often used as an ingredient in animal feed. Another by-product from dairies is whey. Whey is an ingredient in protein powder which is popular among athletes. Common by-products from vegetable waste are leftover vegetables that are made into animal feed.
It is often difficult to define what is unnecessary and what is unavoidable food waste. This in turn makes it difficult to accurately specify the volume of food waste generated in the food industry. The vol-ume for 2012 varies between 171,000 and 642,000 tonnes depending on where we put the boundary between food waste, by-product and other waste. The figure of 171,000 tonnes only includes directly edible food waste, whereas a broader definition is used in the 642,000 ton figure based on upcoming international definitions. The fact that abattoir waste (e.g. skin, offal, blood) and peel/shell residue (e.g. seed coating and potato peel) are included in the new definition gives rise to the greatest difference in volume. Culture and eating habits have an influence here; people have different opinions on what is con-sidered to be food and what is not. It is also impor-tant to mention that different industries use different terminology; for example the Swedish word “svinn” (wastage) is common in the Swedish food industry – this can be considered comparable to unnecessary food waste and is then relatively close to the defini-tion used in the lower figure given above.
Even some of what goes to make animal feed (classified as by-product) could perhaps be eaten more by humans if our eating habits were different, e.g. gashed potatoes, shrivelled apples and pigs’ trotters. The water content also affects the volume of e.g. feed milk.
HOW THE DATA IS PRODUCED
The data on food waste from the food industry is based on environmental reports from 135 compa-nies. They have specified themselves how much
vegetable and animal waste has been generated in their operations. The food waste generated by companies that have no waste data in their environ-mental reports, and smaller companies who don’t publish such reports has been estimated using the data compiled from those who have reported data in their environmental reports. We have assumed for example that a dairy that does not publish an envi-ronmental report generates the same type of waste as one that does and that the waste is in proportion to the number of employees.
As mentioned above, it is often difficult to deter-mine what is food waste and not based on what is written in the environmental reports. In some cases, it is an obvious by-product, i.e. not classified as waste. This is true for example of residual products that have been used as animal feed, feed milk from the milk industry, fish and shellfish waste for mink feed from the fish processing industry. In other cases it can be obvious waste but not food waste, such as fertilizer from abattoirs or fish brine. Abattoir waste can be classified both as food waste and by-product depending on what it is used for. The vast majority of by-products from the food industry are used as animal feed. The volumes of by-products are much larger than the volumes of waste, which in itself is positive. This means that residual products are being put to good use, as e.g. animal feed. Even though there is international guidance on the issue, different countries and actors within Sweden can interpret it differently, which is the most likely explanation for why the volumes can differ among the different sources.
About 70,000 tonnes of food waste were generated by supermarkets in 2012. This is the equivalent of about 7 kg per person.
Of the food waste generated, about 91 percent (63,000 tonnes) was made up of unnecessary waste and the rest (about 9 percent or 7,000 tonnes) was unavoidable food waste. As regards the different categories of food, it was fruit and vegetables that were responsible for the largest food waste volumes and that were thrown as mixed waste (40 percent) followed by meat and bread (29 and 27 percent respectively). Dairy products amounted to about 1 percent of the generated food waste volumes from mixed waste (Stare et al, 2013). This low figure for dairy products may be explained by the fact that they are not often thrown as mixed waste but are either returned to the producer or poured down the sink. The data is based on compositional analyses of mixed waste and not of separated food waste.
Wholesale outlets are also included in super- markets. A survey performed in 2013 (Stare et al) shows that wholesalers do not generate much food waste.
HOW THE DATA IS PRODUCED
The generated food waste volumes are calculated using a waste factor (kg of food waste per employee and year). The waste factor is based on data from a number of supermarkets that have food waste separation facilities and who weigh both the
sepa-rated food waste and the mixed waste. Since mixed waste is not only made up of food waste, the volume of food waste in it is estimated using compositional analyses7. The food waste that has been separated
and the food waste in the mixed waste are added together and then combined with data from Statistics Sweden on the number of employees in each super-market to make a waste factor, which amounts to 700–1,300 kg per employee and year depending on the size of the supermarket.
By multiplying the waste factor by the total number of employees in the food retail industry in Sweden according to the Statistics Sweden Business Register 2012, we obtain the total generated food waste volumes from supermarkets in Sweden. The method is described in detail in Stare et al, 2013.
The breakdown into unnecessary and unavoidable food waste and into different food categories is based on compositional analyses of mixed waste. The method is described in detail in Stare et al, 2013. COMPARISONS WITH PREVIOUS YEARS
AND OTHER DATA
For 2010, the Swedish EPA has previously reported a figure of about 39 000 tonnes of food waste gener-ated from supermarkets. The large discrepancy is due to the fact that the food waste thrown as mixed waste was not included in the waste factors. It has been shown that stores with food waste separation facilities nevertheless throw a substantial amount
Supermarkets
7 A compositional analysis is when waste is separated into different categories – in this case unnecessary and unavoidable food
as mixed waste. This may depend on many things, one reason is that the food is packaged and may not therefore be thrown away as food waste as it is too time-consuming for the supermarket to separate the packaging from the food waste. Using the new waste factor, the volume will be about 67,000 for 2010.
A study performed by the Swedish University of Agricultural Sciences (SLU) has estimated the food waste from supermarkets to be about 125,000 tonnes per year in Sweden (Strid, 2013), including liquid food waste. This estimate is based on what six stores belonging to the same supermarket chain have scanned as “svinn (wastage)”. Using a calcu-lated mean value per store, this figure has then been scaled up to all the stores in the chain and then up to
the national level using the chain’s estimated market share as a basis. The Swedish EPA’s study (Jensen et al, 2011) makes it clear that the size of the super- market plays a major role. We can also see consid-erable variations between individual supermarkets despite them being approximately the same size. It is therefore unreliable to estimate the volume based on just six similar stores.
As regards the analysis of which types of food categories generate the most waste from super- markets, it tallies well with the findings of other studies from e.g. Norway, Denmark and Finland (Stenmarck et al, 2011). This is not so surprising since it is mostly fresh food that becomes food waste.
In 2012, about 142,000 tonnes of food waste was generated from restaurants in Sweden, which is about 15 kg per person.
Of the food waste thrown away, about 62 percent (88,000 tonnes) was made up of unnecessary food waste and about 38 percent (54,000 tonnes) was unavoidable food waste. The single largest food cat-egory was meat (40 percent) followed by 37 percent mostly comprising pasta, rice and potatoes and then fruit and vegetables with 12 percent. Bread and dairy products constituted 5 and 3 percent respectively of the food waste volumes in the mixed waste (Stare et al, 2013).
HOW THE DATA IS PRODUCED
The generated food waste volumes are based on the same methodology as the calculations for super- markets, i.e. a food waste factor in the form of kg of food waste per employee (1,400 kg per employee and year). The total food waste volumes are calculated by multiplying the factor by the total number of em-ployees in the Swedish restaurant business according
to the Statistics Sweden Business Register. There are differences in the food waste volumes depending the type of restaurant (fast food, á la carte, etc.). We use a mean value for all the restaurants in the survey since the number of establishments for each restau-rant type in the survey is not that large. Factors for different types of restaurants are presented in Jensen et al, 2011.
The breakdown into unnecessary and unavoidable food waste and into different food categories is based on compositional analyses of the mixed waste. The method is described in detail in Stare et al, 2013. COMPARISONS WITH PREVIOUS YEARS
The Swedish EPA has previously reported a total of 99,000 tonnes from restaurants in 2010. The dis-crepancy between that data-set and the revised data for 2010 reported here is due to the fact that the pre-vious waste factor did not include food waste thrown as mixed waste. The differences between 2012 and 2010 after the correction has been made depend on differences in the number of employees.
About 58,000 tonnes of food waste (6 kg per person) were generated from catering facilities in 2012, of which school canteens were responsible for the largest volumes (43,000 tonnes). Catering facilities include school canteens, kitchens in remand centres, prisons, elderly care homes and health service institu-tions. The figure for school canteens also includes preschools.
Of the food waste thrown away, about 52 percent (30,000 tonnes) was made up of unnecessary food waste and about 48 percent (28,000 tonnes) was unavoidable food waste. The proportion of fruit and vegetables was 72 percent of the generated food waste volumes followed by pasta, rice and potatoes (11 percent) and then meat (9 percent). The propor-tions of bread and dairy products amounted to 5 and 2 percent respectively (Stare et al, 2013).
HOW THE DATA IS PRODUCED
The generated food waste volumes are based on the same methodology as for supermarkets and for restaurants. The computed food waste factor is not, however, based on the number of employees but on the number of pupils where school canteens, which are the most common type of institutional kitchen, provided the basis for the factor (21 kg per pupil and year, or approximately 120 g per portion).
This factor is also used to estimate generated volumes from other catering facilities such as those in remand centres, prisons, elderly care homes and health service institutions. Based on public data on the number of inmates, residents at elderly care homes and patients in 2012, the total generated food waste volumes are estimated for other catering facilities.
The breakdown into unnecessary and unavoidable food waste and into different food categories is based on compositional analyses of the mixed waste. The method is described in detail in Stare et al, 2013. COMPARISONS WITH PREVIOUS YEARS
The Swedish EPA has previously reported 26,000 tonnes of food waste for school canteens in 2010 – based on a waste factor that did not include food waste thrown as mixed waste. Other catering facil-ities (in hospitals, prisons, etc.) were not included either. The current figure for 2010 of 58,000 tonnes is more accurate. Since the difference in the number of served portions between 2010 and 2012 is only small, there is no difference in the volumes of food waste between the years.
About 771,000 tonnes of food waste were generated in households in 2012, which is the equivalent of just under 81 kg per person. Around 35 percent of these volumes (270,000 tonnes) was unnecessary food waste.
HOW THE DATA IS PRODUCED
Generated food waste volumes are based on the volumes that are separated and sent for biological re-cycling (anaerobic digestion and composting) and the food waste that ends up in the mixed waste and is sent for combustion. Both the separated food waste volumes and the volume of food waste that is not separated and ends up in the mixed waste are based on data compiled annually by Avfall Sverige (Swedish Waste Management and Recycling Association).
The volume of food waste in the mixed waste has been estimated by compositional analysis. The percentage of food waste in the mixed waste varies depending on whether the household has access to a food waste separation facility and on the type of housing (Avfall Sverige, 2011b). Based on a national breakdown of housing types (data from Statistics Sweden) and on data from Avfall Sverige on which municipalities have food waste separation facilities, an average percentage of food waste in the mixed waste is calculated. This percentage is multiplied by the volume of mixed waste to estimate the total vol-ume of food waste that is thrown away in the mixed waste.
The separated food waste sent for biological treat-ment contains not only food waste but also other biological waste such as plants and planting soil as well as other, incorrectly separated waste. Based
on compositional analyses, the proportion that is actually food waste has been estimated at about 78 percent (Jensen et al, 2011). This proportion has been multiplied by national data on separated volumes to obtain the total volume of separated food waste from households.
The volume of separated food waste (including home composting) added to the volume of food waste thrown away as mixed waste make up the total volume of generated food waste. These volumes also include volumes from business activities for which the municipalities are nowadays responsible. To calculate the food waste volumes from house-holds, the above volumes have been multiplied by 0.80, i.e. 80 percent of the waste volumes are estimated to come from households and 20 percent from business activities. This breakdown is approximate and an estimate from Avfall Sverige.
The separated food waste volumes from households sent to biological treatment, including home compost-ing, is estimated at approximately 251,000 tonnes from 2012. This is based on data compiled by Avfall Sverige on volumes of food waste received at digestion and composting facilities and the fact that 80 percent of these volumes are estimated to come from house-holds (Jensen et al, 2011). This corresponds to a separation rate of just under 33 percent. The e quivalent separated volumes of food waste for 2010 amounted to about 194,000 tonnes which corresponds to a separation rate of just under 29 percent. Even though food waste separation from households is on the increase, they are still a long way off achieving the set milestone target for food waste, which states that at least 50 percent of the generated food waste is to be
Households
treated biologically.8 On the plus side, however, the
figures do show that there is an upward trend. COMPARISONS WITH OTHER DATA
The Swedish EPA has previously reported a total of 674,000 tonnes from 2010. This figure has been adjusted to 680,000 tonnes since the volume of food waste thrown away as mixed waste was over- estimated and home composting was not included. The differences between the new data for 2010 and the data for 2012 (680,000 compared to 771,000 tonnes) depend on an increase in the volume of waste thrown away as mixed waste. For 2012, the fact that the average proportion of food waste in the mixed waste has been adjusted from 31 to 33 percent (based on new data from Avfall Sverige, extracted from their website) has also been considered.
According to Avfall Sverige, 860,000 tonnes of food waste were generated in 2010, which corre-sponds to 91 kg per person (Avfall Sverige, 2011a). These volumes are slightly more than 10 percent higher compared to the data reported by the Swedish EPA. Both the method presented above and Avfall Sverige’s method are based on Avfall Sverige 2011b – a report that compiles the results from composi-tional analyses performed in Sweden in recent years. Instead of starting from the proportion of food waste as in the method presented above, Avfall Sverige
starts from the proportion of food waste generated in mixed combustible waste per household (for houses and apartments respectively) and year. The total volumes are calculated based on data from Statistics Sweden on how many people live in different forms of housing and the number of inhabitants in Sweden.
WRAP9 has recently published a new report on
food waste in the United Kingdom in 2012 (WRAP 2013), in which it is reported that 260 kg of food waste is generated per household (5 kg a week), of which 160 kg is unnecessary food waste. This corresponds to about 19 percent of the food pur-chased. Calculated per inhabitant, this is 110 kg for 2012, which is higher than Sweden’s 81 kg per person. The data is of the same magnitude if we consider the fact that the WRAP study also includes data on food waste that is poured down the drain.
The proportion of unnecessary food waste from households can be seen as low in Sweden (35 per-cent). The data is based on 15 compositional analyses (Jensen et al, 2011). The samples indicate a considerable spread in the proportions of un- necessary food waste, from down to 20 percent to as much as 80 percent. It could feasibly be the case that just these 15 compositional analyses contained an unusual number of households who did not throw away unnecessary food waste and this would then affect the mean value.
8 The milestone target also includes businesses such as restaurants, supermarkets and catering facilities as well as households.
Apart from the fact that 50 percent of generated food waste volumes are to be treated biologically, it is also stated that plant nutrient is to be recovered and at least 40 percent is to be treated so that even the energy can be utilized. This to be achieved no later than 2018.
Between 2010 and 2012, the Swedish EPA has financed the production of new, more accurate waste factors for supermarkets, restaurants and catering facilities. Precisely as is indicated in Jensen et al, 2011, these show that the previous factors were too low on account of the fact that supermar-kets, restaurants and catering facilities throw a rel-atively large amount of food waste as mixed waste despite the fact that they have separation facilities. The new calculations are of better quality since they take this into account. A project is currently ongoing to improve the data from households even further to include solid and liquid food waste that is poured down the drain.
Disregarding the lack of complete data from agriculture and fishing, we can see that food waste volumes increase the further up the value-added chain we come (see Figure 1). This is typical for developed countries where storage and distribu-tion are seldom a problem and we are instead so well-off that we can spend money on food that we can then choose not to eat. Furthermore, we can choose to over-produce in order to meet the customer’s hypothetical needs. The longer up the chain the food passes, the greater its environmen-tal impact, so it is naturally important to reduce food waste. Large volumes are unnecessarily thrown away.
We need to work continuously to improve food waste statistics. This is important not only so that we can monitor the goals that have been set in this area but also for individual businesses or private citizens in order to highlight the problem and to be able to change people’s behaviour.
THE SWEDISH EPA
The Swedish EPA is working to increase awareness among different actors of the importance of food waste for the environment and public finances and thereby reduce the volumes of food thrown away. We cooperate with many actors in the SaMMa group (food waste reduction action group). The EPA is re-sponsible for compiling statistics and monitoring waste objectives and targets. Its remit includes international reporting of waste data to the EU, OECD and EEA and the monitoring of national waste targets incorpo-rated in the Swedish Environmental Objectives System, in the National Waste Plan and in the National Waste Prevention Programme. In recent years, the EPA has put resources into compiling statistics to improve monitoring of the national environmental objectives; food waste statistics being one such area.
AVFALL SVERIGE
Avfall Sverige is the Swedish Waste Management and Recycling Association. The association works with all issues concerning the collection, transport and treatment of waste, which also includes food waste. It also produces statistics on household waste. THE NATIONAL FOOD ADMINISTRATION
The National Food Administration has been com-missioned by the Swedish Government to implement various measures to reduce food wastage at all stages in the food supply chain. The aim is also to devise ways of using food waste, for example as an energy resource. This work is being performed jointly with the Swedish Board of Agriculture and the Swedish EPA. The projects being performed within the gov-ernment commission include examining the volumes
What are the Swedish EPA and others doing regarding food waste statistics?
and causes of food wastage in primary productionand devising ways of measuring the volumes of liquid food waste generated from households.
SWEDISH BOARD OF AGRICULTURE
Agencies and researchers in Sweden, Denmark, Nor-way and Finland have worked together in a project financed by the Nordic Council of Ministers to ana-lyse food wastage in primary production. The project was managed by the Swedish Board of Agriculture and was finalized at the beginning of 2013. The aim was to devise concrete measures to reduce food waste by 20 percent all along the food supply chain by 2015. An important component in the project was to identify how much food waste was being generated in the following product groups: fruit and vegetables, cereals, milk, meat, fish, eggs, and what the causes were. Another important task was to examine how agencies in the agricultural sector affect food waste volumes as a result of regulations, quality require-ments and the like. A follow-on project financed by the Nordic Council of Ministers is now underway and will be concluded in 2014.
THE SaMMa NETWORK
The SaMMa group (food waste reduction action group) was established in 2010 to coordinate the many initiatives under way in the area of food waste. The group is open to all actors in the area and the network has about 50 members from all stages of the food supply chain, including research and interest groups. The Swedish EPA, Swedish Board of Agricul-ture and National Food Administration convene the network and take turns at hosting meetings that are held a few times a year.
FUSIONS (FOOD USE FOR SOCIAL INNOVATION BY OPTIMIZING WASTE PREVENTION STRATEGIES) FUSIONS is an ongoing EU project working for a more resource-efficient Europe by significantly reducing food waste. The project is running for four years, from August 2012 to July 2016, and is being financed by the European Commission’s Framework Programme 7. Swedish partners in FUSIONS are SIK (Swedish Institute for Food and Biotechnology) and IVL (Swedish Environmental Research Institute). For more information, go to www.eu-fusions.org.
FAO (FOOD AND AGRICULTURE ORGANIZATION OF THE UNITED NATIONS)
FAO works to improve food and diet, increase pro-ductivity in agriculture, raise standards of living in rural populations and contribute to global economic growth.
SMED
SMED (Sweden Environmental Emissions Data) has been commissioned by the Swedish EPA to produce waste statistics, including data on food waste. SMED, in consultation with the Swedish EPA, has developed Swedish statistics in the area. The majority of reports on the subject are published at www.smed.se.
NORDIC COUNCIL OF MINISTERS
The Nordic Council of Ministers has initiated three projects on food wastage, one of which is aimed at developing common definitions for the Nordic coun-tries. The project is due to be completed in 2014. The Nordic Council of Ministers has also previously financed studies in the area for supermarkets and for catering facilities.
• Avfall Sverige (2011a), Svensk Avfallshantering 2011 [Swedish waste management 2011]
• Avfall Sverige (2011b), Rapport U2011:04, Nationell kartläggning av plockanalyser av hushållens
kärl- och säckavfall – Aktuella resultat och metodik [National survey of random samples of unseparated household waste – Up-to-date results and methodology], ISSN 1103-4092
• Franke Ulrika, Einarson Elin, Andrésen Niels, Svanes Erik, Hartikainen Hanna, Mogensen Lisbeth, (2013), Kartläggning av matsvinnet i primärproduktionen [Analysis of food wastage in primary
production], Tema Nord 2013:581
• Jensen Carl, Stenmarck Åsa, Sörme Louise, Dunsö Olof (2011), Matavfall från jord till bord [Food waste
from field to fork], SMED Report no. 99
• Hanssen Ole-Jörgen (2011), Food waste in Norway in a value chain perspective, Östfoldforskning • Stare Malin, Johansson Malin, Dunsö Olof, Stenmarck Åsa, Sörme Louise, Jensen Carl, (2013),
Förbättrade matavfalls-faktorer för verksamheter verksamheter [Better food waste factors for businesses and organizations], SMED Report no. 117
• Statistiskt meddelande Vattenbruk 2012 [Statistical bulletin: Aquaculture] (JO60SM1301) http://www.jordbruksverket.se/webdav/files/SJV/Amnesomraden/Statistik,%20fakta/Vattenbruk/ JO601301/JO60SM1301/JO60SM1301_ikortadrag.htm
• Stenmarck Å, Hanssen OJ, Silvennoinen K, Katajauuri J-M, Werge M. Initiatives on prevention
of food waste in the retail and wholesale trades. Nordic Council of Ministers; 2011.
• Strid Ingrid (2013), Sveriges Lantbruksuniversitet, Minskat matsvinn från livsmedelsbutiker
– sammanfattning från ett forskningsprojekt kring matsvinn [Less food wastage from supermarkets – summary of a research project on food wastage],
http://www.slu.se/Documents/externwebben/nl-fak/energi-och-teknik/Matsvinn/ SvinnProjektet_SLU_130428_WEBB.pdf
• WRAP (2013), Household food and drink waste in United Kingdom 2012, http://www.wrap.org.uk/sites/files/wrap/hhfdw-2012-main.pdf