J
Ö N K Ö P I N GI
N T E R N A T I O N A LB
U S I N E S SS
C H O O LJÖNK ÖPING UNIV E RS IT Y
A Study on the Impact of the Structural Fund Policy on Sweden’s Regional
Growth.
D e c r e a s i n g t h e R e g i o n a l D i s p a r i t i e s
t h r o u g h t h e E U ’s S t r u c t u r a l F u n d P o l i c y
Bachelor thesis within Economics
Authors: Elin Berlin Carin Johansson
Supervisors: Professor Charlie Karlsson PhD Candidate Lina Bjerke Jönköping June 2010
Acknowledgements
We want to thank the county administrative boards in Gävleborgs län, Norrbottens län, Jämtlands län, Örebro län and Jönköpings län as well as the Swedish ESF-council for
providing data on the payments from the Structural Funds.
We also want to express our gratefulness to our tutors Charlie Karlsson and Lina Bjerke for giving us support and guidance throughout the thesis.
Jönköping, June 2010
Kandidatuppsats inom Nationalekonomi
Titel: Minskade Regionala Skillnader genom EU:s Strukturfondspolitik. En Studie om Strukturfondspolitikens påverkan på Sveriges Regionala Ekonomiska Utveckling.
Författare: Carin Johansson (860514) Elin Berlin (850715)
Handledare: Professor Charlie Karlsson PhD Candidate Lina Bjerke
Datum: 2010-06-08
Nyckelord: EU:s Sammanhållningspolitik, Strukturfonderna, Regional ekonomisk tillväxt, Regional konvergens.
Sammanfattning
Syftet med denna uppsats är att analysera EU:s Strukturfondspolitiks inverkan på regional ekonomisk tillväxt i Sverige mellan 2000-2007. En regional konvergensanalys utförs för att undersöka om Strukturfondspolitikens övergripande konvergens mål uppnås. Vidare undersöker studien viktiga Strukturfondmålindikatorers tillväxt, såsom sysselsättning, utbildning och nyföretagande, i Mål 1, 2 och 3 områdena. De viktigaste tillväxt- och konvergensteorierna och deras koppling till regional politik, såsom Strukturfondspolitiken används som den teoretiska bakgrunden och formar studiens hypotes.
Resultaten visar att absolut β-konvergens existerar mellan de svenska kommunerna. Resultaten för målindikatorernas tillväxt visar att Mål 1 och 2-områdena som har mottagit största delen av Strukturfondsstödet har uppnått sina mål att öka sysselsättningen och starta nya företag. Dessutom har Mål 2-områdena haft en högre ökning av andelen av befolkningen med högre utbildning jämfört med områdena som inte mottog något Mål 1 eller 2-stöd. Mål 3- områdena som har mottagit den minsta delen av Strukturfondsstödet hade en lägre tillväxt av sysselsättning jämfört med de områden som inte mottog något direkt Mål 3-stöd. De områden som enbart mottog Mål 3-stöd hade dessutom en lägre tillväxt av befolkning med högre utbildning. Utifrån resultaten kan vi dra den övergripande slutsatsen att den positiva påverkan av Strukturfondspolitiken på målindikatorerna verkar vara störst i de områden som har mottagit största delen av Strukturfondsstödet. De n slutgiltiga slutsatsen är att Strukturfondspolitiken sannolikt främjar den ekonomiska tillväxten i insatsområdena.
Bachelor thesis within Economics
Title: Decreasing the Regional Disparities through the EU’s Structural Fund Policy. A Study of the impact of the Structural Fund Policy on Sweden’s Regional Growth.
Authors: Carin Johansson (860514) Elin Berlin (850715)
Tutors: Professor Charlie Karlsson PhD Candidate Lina Bjerke
Date: 2010-06-08
Keywords: EU’s Cohesion Policy, Structural Funds, Regional economic growth, Regional convergence.
Abstract
The purpose of this thesis is to analyze the impact of the EU’s Structural Fund (SF) policy between 2000-2007 on regional economic growth in Sweden. A regional convergence analysis is performed in order to examine if the SF policy’s overall aim of convergence is reached. Furthermore the study examines the growth of important Structural Fund goal indicators as employment, education and new firm formation in the Objective 1, 2 and 3 areas. The main growth- and convergence theories and their connection to regional policies such as the SF policy is used as the theoretical framework and form the study’s hypothesis. The results show that absolute β-convergence exists between the Swedish urban areas. The growth of the goal indicators show that the Objective 1 and 2 areas, which received most part of the SF support have achieved their aims in increasing employment and new firm creation. In addition the Objective 2 areas have increased their share of population with higher education compared to the areas that did not receive either Objective 1 or 2 support. T he Objective 3 areas, which received the least part of the SF support had a lower mean growth in employment than the areas that received no direct Objective 3 support. In addition the urban areas that only received Objective 3 support had a lower growth in share of population with higher education. From the results we can reach the overall conclusion that the positive impact of the SF policy on the goal indicators seem to be the largest in the areas that received most part of the funding. The final conclusion is that the SF are effective in enhancing economic growth in the areas of intervention.
Contents
1 Introduction ... 1
1.1 Previous Studies ... 2
1.2 Outline ... 3
2 Background... 4
2.1 Regional Disparities in Sweden ... 4
2.2 Structural Fund Policy, 2000-2006 ... 5
3 A Theoretical Frame work of Regional Economic Growth... 8
3.1 Neoclassical (exogenous) Growth Theory ... 8
3.2 Endogenous Growth Theory... 9
3.3 New Economic Geography ...10
3.4 Convergence and Divergence ...10
3.5 Impact of the EU-integration and SF-policy on Convergence ...11
4 Empirical Analysis ... 13
4.1 Data and Method ...13
4.2 Model of β-convergence and σ-convergence ...14
4.3 Model of Goal Indicator Analysis ...17
5 Conclusions and suggestions for future research ... 22
6 References ... 24
Diagram, Figure, Table and Equation Index Diagrams
Diagram 1: GRP/capita 2000-2007 in six LA-region...………...………...….4
Diagram 2 : Wages/capita 2000-2007 in six LA-regions, SEK current price…..…………...…5
Diagram 3: Final payments from the SF, Objective 1 and 2, 2000-2006 per program area…...7
Diagram 4: Final payments from the SF (Social Fund), Objective 3, 2000-2006…...………...7
Diagram 5: Growth rate vs. initial GRP/capita in LA regions………….……….……15
Diagram 6: Growth rate vs. initial GRP/capita in urban areas……..…….………….………..15
Diagram 7: Dispersion of per capita GRP in LA regions……….16
Diagram 8: Dispersion of per capita GRP in urban areas………...………...16
Diagram A1 The Solow-Swan model of economic growth………..………... 27
Figures Figure 1: Geographical allocation of the SF-support, Objective 1, 2 and 3, 2000-2006, SEK...6
Figure A1: Determination of labor productivity………..……….27
Figure A2: Interregional flows of production factors in the one-sector model………..…...…28
Figure A3: NUTS 1, 2 and 3 division since 2008………...………..……29
Tables Table 1: Previous studies of the impact of SF-policy on economic growth………..………….3
Table 2: Variable description of Equation 1…..…………...………..…………. 14
Table 3: Regression result from OLS estimation of absolute convergence…………..……... 15
Table 4: Descriptive statistics of per capita GRP, for σ-convergence………..………... 16
Table 5: Variable description of Equation 2……….………..…………. 17
Table 6: Regression results for goal indicators, 2000-2007, Objective 1 and 2………..….... 18
Table 7: Variable description of Equation 3……….……..…………...……….. 19
Table 8: Regression results for goal indicators, 2000-2007, Objective 3…..……….. 20
Table 9: Variable description of Equation 4….………..………..20
Table 10: Regression results for goal indicators, 2000-2007, only Objective 3………...21
Equations Equation 1: absolute convergence………..…..…… 14
Equation 2: growth in goal indicators Objective 1 and 2……….……… 17
Equation 3: growth in goal indicators Objective 3……….…... 19
1
1 Introduction
In 2007 Inner London had a Regional GDP per inhabitant 6 times larger than the Dytiki Ellada region in Portugal 1(Eurostat, 2010a). This difference exists even though Portugal has been a member of the EU since 1986 and has received funding from the EU’s Cohesion Policy to reduce the regional disparities for several periods (Eurostat, 2010b). If we turn to the accession countries the disparities in the EU becomes even clearer. Severozapaden in Bulgaria has a GDP per inhabitant 13 times smaller than Inner London. This illustrates the large regional economic disparities within the Community which the EU seeks to reduce through its Cohesion Policy (Eurostat, 2010a). The question is if the persistent, although re latively smaller disparities between, for instance Inner London and Dytiki Ellada indicate a success or a failure of the EU’s Cohesion Policy.
The long-term goal of the Cohesion Policy is set out in article 158 in the Amsterdam Treaty:
“In order to promote its overall harmonious development, the Community shall develop and pursue its actions leading to the strengthening of its economic and social cohesion. In particular, the Community shall aim at reducing disparities between the levels of development of the various regions and the backwardness of the least favored regions or islands, including rural areas.”(European Commission Directorate-Generate Regional Policy 2008, p. 6).
Regional disparities exist in Sweden too. In 2007 Stockholm had a Gross Regional Product (GRP)2 per capita almost two and a half times larger than the poorest region, Sorsele. At the national level Sweden formulates its goals of the regional policy in a similar way as the EU:
“The goal for the new regional growth policy is efficient development in all parts of the country with strengthened local and regional competitiveness and creation of better conditions for entrepreneurship, innovations and investments” (Budgetpropositionen för
2008: Regional Tillväxtpolitik, 2007, p.1).
This study analyzes the impact of the most important instrument of the EU’s Cohesion Policy, the Structural Funds (SF) on regional economic growth in Sweden for the program period 2000-2006. The purpose is to analyze the effects of the Objective 1, 2 and 3 SF-interventions on regional economic growth. The analysis is performed in two steps, firstly by examining if there has been any sign of regional convergence between the Swedish LA regions3 or urban areas4. Secondly by examining if the SF-policy has achieved its aims in increasing employment, education participation and new firm formation in the Objective 1, 2 and 3 areas. The results of the study show that the aim of regional convergence is reached at the urban area level and that the Objective 1 and 2 areas have achieved their aims in increasing employment and creating new firms. These results indicate that there are reasons to believe that the SF-policy is effective in enhancing economic growth and convergence.
Why are some regions richer than others and what factors identify economic growth at the regional level? According to Capello (2007) regional economic development can be defined
1
By NUTS 2 regions 2
GRP is a regional breakdown of GDP from the side of production measured in current prices. 3
A LA region is a functional region based on the population’s commuting patterns. 4
2 as the ability of a region to produce, with a (comparative or absolute) advantage, the goods and services demanded by the national and international economic system to which it belongs. A regions ability to export is of high importance for its regional growth. According to North (1955) export success can take place through improvement of the regions existing export position relative to competing areas or through development of new exports. Furthermore, Capello (2007) identifies several factors that generates a region’s growth process. Among them is increased demand for locally produced goods, greater local production capacity, a more abundant endowment of local resources and production factors, and a larger amount of savings available for investments in infrastructures and technologies intended to increase the efficiency of production processes.
There are two primary means to achieve these factors that may generate a growth process. One might rely on those theories of regional growth that predict that the automatic market forces will make the poorer regions catch up with the richer ones. These market forces which produce the growth and decline of regions are however acting very slowly, if they are acting towards convergence at all (Borts & Stein, 1964). Therefore the government can intervene by using regional policy to improve the productive capacity of a region, and eventually promote its growth. According to Karlsson, Johansson and Stough (2001) policy matters and its support is an important component in the creative process that develops the competitive advantages of regions. Emphasized policy areas are: Communication and transport networks, household milieu, housing environment, higher education and training services, support to technology development, local regulation and taxes, inter-business interaction, cluster formation and conditions for the supply of venture capital.
The EU sets high importance to its regional policy by allocating approximately one third of its budget for the SF, to be distributed among the Community’s regions. According to the planned budget for the program period 2000-2006 Sweden received approximately 20 billion SEK from the SF, intended to promote growth in disadvantaged regions. Additionally approximately 40 billion SEK from the private and public sector was planned to co-finance these 20 billion SEK (EU, Cohesion Policy, 2007). Even though this amount might seem large it only represents about 2% of the total investments in Sweden for the same period (Statistics Sweden, 2010). Therefore it is unsure if such a relatively small amount of regional policy funding has any possibility to affect regional growth. Ma ny empirical studies have dealt with this issue, questioning whether the SF-policy actually is effective in promoting growth in lagging behind regions. Some studies have even raised the question whether there are reasons for reconsideration of the EU’s Cohesion Policy due to results of negative impacts of the SF-policy.
1.1 Previous Studies
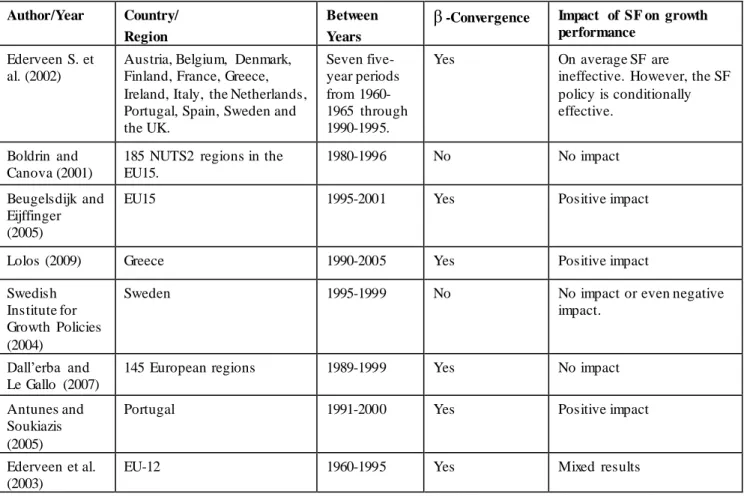
Several studies have been performed on the issue whether the EU’s SF-policy have a positive or negative impact on economic growth at the regional and/or the country level. The main findings of eight selected empirical studies, performed between or within different countries or regions and for different time periods are presented in Table 1. It is obvious that the findings differ when it comes to positive or negative results. While some studies, such as Beugelsdijk and Eijffinger (2005) find a clear positive impact of the SF, others such as
3 Boldrin and Canova (2001) find that the SF have little relationship with fostering economic growth. Furthermore some find that the impact is conditionally effective, for instance, Ederveen, De Groot and Nahuis (2002) find that the SF are effective for countries with ‘good’ institutions. In other cases the results are unclear, mixed or modest, as in the case of Ederveen, Gorter, De Mooij and Nahuis (2003). The results are however clearly positive for the studies performed within the southern EU countries, such as Portugal and Greece. A few studies have highlighted the spillover effects, one of them is Dall’erba and Le Gallo (2007) who found that SF allocated to peripheral regions never spill over to their neighbor regions. As for the study performed in Sweden, it presents results of neither convergence nor positive impact of the SF-policy. It should be noted that this is the only empirical study on the SF impact in Sweden that we have been able to find which makes this study interesting to carry out. In addition few studies have been performed for the time period 2000-2006.
Table 1 Previ ous studies of the impact of the SF-policy on economic growth Author/Year Country/
Region
Between Years
β -Convergence Impact of SF on growth performance
Ederveen S. et al. (2002)
Austria, Belgium, Denmark, Finland, France, Greece, Ireland, Italy, the Netherlands, Portugal, Spain, Sweden and the UK. Seven five-year periods from 1960-1965 through 1990-1995.
Yes On average SF are
ineffective. However, the SF policy is conditionally effective.
Boldrin and Canova (2001)
185 NUTS2 regions in the EU15.
1980-1996 No No impact
Beugelsdijk and Eijffinger (2005)
EU15 1995-2001 Yes Positive impact
Lolos (2009) Greece 1990-2005 Yes Positive impact
Swedish Institute for Growth Policies (2004)
Sweden 1995-1999 No No impact or even negative
impact.
Dall’erba and Le Gallo (2007)
145 European regions 1989-1999 Yes No impact
Antunes and Soukiazis (2005)
Portugal 1991-2000 Yes Positive impact
Ederveen et al. (2003)
EU-12 1960-1995 Yes Mixed results
1.2 Outline
The outline of the thesis is as follows; Section 1.2 will give the reader an overview of previous studies that have been made on the topic of the thesis. Moreover Section 2 presents a background on the regional disparities in Sweden and the 2000-2006 SF-policy. In Section 4 a theoretical framework of regional economic growth is presented which includes the main growth- and convergence theories and their connection to regional policies such as the SF-policy. The empirical analysis in Section 5 starts by presenting the data and methodology used in the analysis. Furthermore Section 5 explains the different models used in the analysis and their results. Finally Section 6 contains conclusions and suggestions for future research.
4
2 Background
The primary objective of the EU’s Cohesion policy is to decrease the disparities between regions in Europe and enhance convergence. Therefore the regions’ GRP per capita is the most important indicator when the EU decides which regions are eligible for support from the SF (Swedish Agency for Economic and Regional Growth, 2010). On these grounds the background will focus on the regional disparities in Sweden and the allocation and aims of t he SF-support.
2.1 Regional Disparities in Sweden
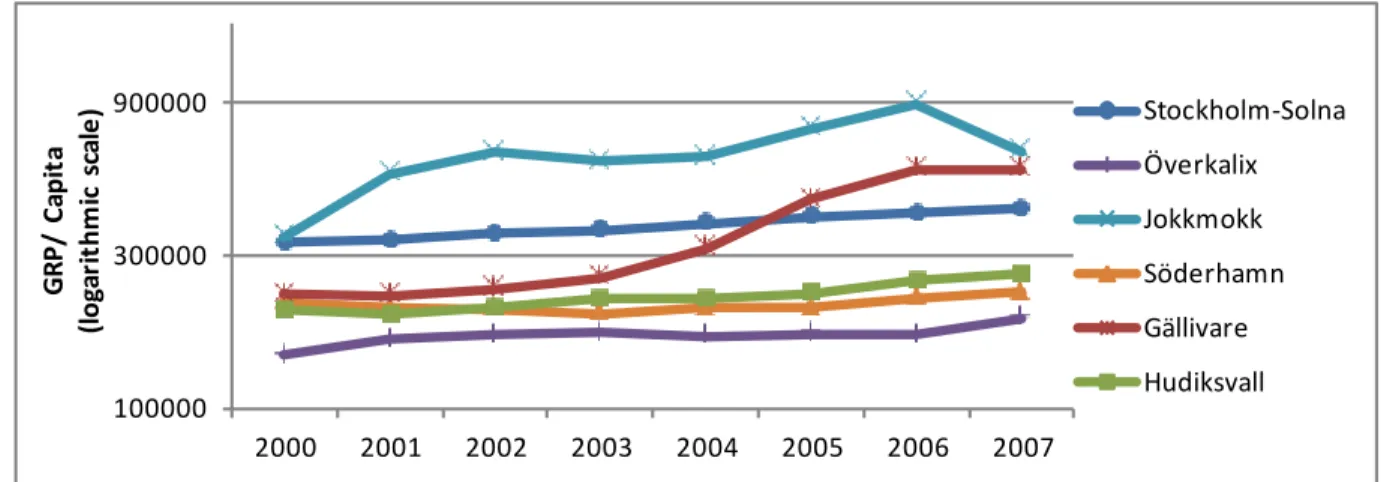
Diagram 1 displays the growth of six LA regions’ GRP per capita from 2000-2007. Even though the program period ends in 2006 we have chosen to extend the period for the analysis to 2007, since the results from the total SF-program period cannot be expected until at the earliest 2007, hence we assume a lagged effect. These regions are selected because they represent the highest and the lowest growth rates and levels of GRP per capita. From Diagram 1 we can conclude that there are large disparities between the northern regions of Sweden. Jokkmok and Gällivare have had the highest GRP per capita growth with an average annual GRP per capita growth rate of 11,4% and 14,3% respectively. Meanwhile other northern regions, such as Överkalix present among the lowest levels of GRP per capita in Sweden. In addition Hudiksvall and Söderhamn had the lowest growth of their GRP per capita between 2000-2007 with an annual average growth rate of 2,5% and 2% respectively. Among other regions that have performed well from 2000-2007 are the larger city regions such as Stockholm.
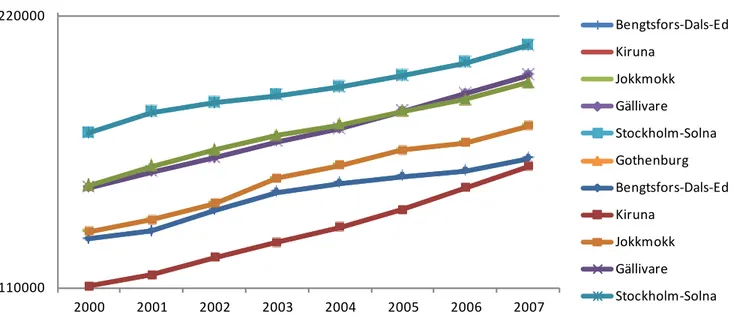
If we use a different variable to measure the growth rate in Sweden the situation slightly changes. Diagram 2 displays the growth of six selected LA-regions’ wages per capita from 2000-2007. In difference to Diagram 1 Jokkmokk is no longer in the lead even though the region is still in the top both when it comes to level and growth of wages per capita. The same goes for Gällivare which more or less has followed the same growth path as Gothenburg. Instead it now becomes clear that Stockholm is the region which has the highest level of wages per capita followed by the larger city regions. Kiruna is however the region which had the highest growth rate from 2000-2007 but the lowest level in 2000. The region which has experience the lowest growth rate is Bengtsfors, a region with low population density.
Diagram 1 GRP/ca pita 2000-2007 i n six LA-regions, SEK current prices. Source: Statistics Sweden.
100000 300000 900000 2000 2001 2002 2003 2004 2005 2006 2007 G R P / C api ta (l og ar it hm ic s ca le ) Stockholm-Solna Överkalix Jokkmokk Söderhamn Gällivare Hudiksvall
5 110000 220000 2000 2001 2002 2003 2004 2005 2006 2007 Bengtsfors-Dals-Ed Kiruna Jokkmokk Gällivare Stockholm-Solna Gothenburg Bengtsfors-Dals-Ed Kiruna Jokkmokk Gällivare Stockholm-Solna
Diagram 2 Wa ges/capita 2000-2007 i n six LA-regions, SEK current prices. Source: Statistics Sweden
As for convergence, Gullstrand and Hammarlund (2007) present no clear proof of absolute convergence in Sweden between the years of 1993-20035. Gullstrand and Hammarlund (2007) point out that convergence rates are very slow for the wage and average income between the Swedish urban areas if even convergence is detected. However a higher rate of convergence between the regions in the northern part of S weden can be observed. The fact that Swedish urban areas, on the one hand, converge very slowly, if they converge at all, and on the other hand differ depending on if they are located in the north or south indicates that the urban areas’ conditions for growth differ in an essential way (Gullstrand & Hammarlund, 2007).
2.2 Structural Fund Policy, 2000-2006
In general terms the EU holds a strong economic position in the world economy; however there are large disparities between the states and regions within the Community. To even out these disparities, the Community adopted a Cohesion Policy in 1986. The main tool of the Cohesion Policy to decrease the disparities are the SF which consist of the European Regional Development Fund and the Social Fund. During the program period 2000-2006 the EU allocated 35% of the total Community budget to the Cohesion Policy (EU, Cohesion Policy, 2007). The SF was allocated through three different objectives with different aims. Objective 1 aims to promote the development and structural adjustments in regions that are lagging behind, dominated by regions with a GRP per capita under 75% of the EU average (Armstrong & Taylor, 2000). Objective 2 aims to support economic and social changes in regions with structural difficulties. Finally Objective 3 focus on human resource development (NUTEK, 2004a). Additionally there are programs intended to complement these Objectives which concern social and economic questions that are common for several European regions (NUTEK, 2001).
In Sweden, a total amount of approximately 20 billion SEK was invested in the SF-programs for the program period 2000-2006, additionally an amount of approximately 40 billion SEK
5
6 was privately and publically invested in these programs. The final SF- investments in the different Objective 1 and 2 program areas for the program period 2000-2006 can be observed in Diagram 3. The SF- investments are divided into received support from the EU and private and public co-funding. Similarly the division of the investments for Objective 3 can be observed in Diagram 4. However this diagram does not show the investments per program area since Objective 3 covered most of the Swedish urban areas. Sweden received funding under Objective 1, 2 and 3, as well as for the complementary progra ms. The SF-policy’s main areas of intervention were industrial development, human resources development, increased quality of education, capacity building and development of SMEs. Specifically the 2000-2006 SF-programs aimed at creating and safeguarding thousands of job opportunities, create new enterprises and increase the participatio n in educational interventions.
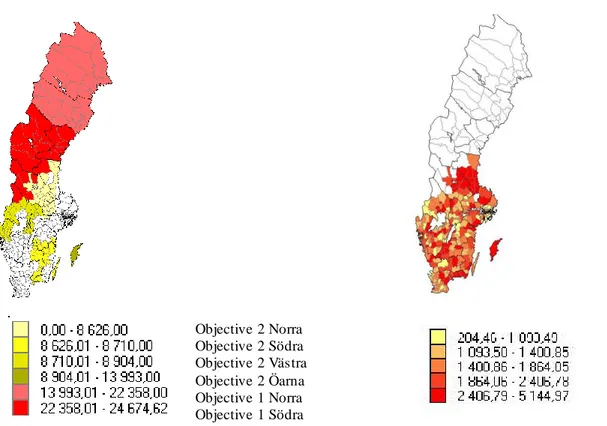
The geographical allocation of the funding can be observed in Figure 1. The numbers of SEK per capita are based on data on final payments fro m the SF in the program area. Noticeably the sparsely populated Objective 1 areas in the northern part of Sweden have received a large part of the funding, almost 3 times more in per capita terms than the Objective 2 areas
(NUTEK 2004b). These areas were eligible for Objective 1 support for their low population
density and not because of having a GRP per capita below 75% of the EU average (Armstrong & Taylor, 2000). Objective 3 covered most of the Swedish urban areas except for the Objective 1 areas where the Objective 3 interventions were already included. (NUTEK 2004b). Clearly the Objective 3 support is the lowest in per capita terms. When comparing the two maps it is obvious that every urban area in Sweden has received more or less SF-support and many urban areas have even received support under both Objective 2 and 3.
Obje ctive 3, per capita SF-support, SEK Objective 1 and 2, per capita SF-support, SEK
Objective 2 Norra Objective 2 Södra Objective 2 Västra Objective 2 Öarna Objective 1 Norra Objective 1 Södra
Figure 1 Geographical alloca tion of the SF-support, Objecti ve 1, 2 and 3, 2000-2006, SEK. (Authors own cons tructi on after data
7 Diagram 3 Fi nal payments from the SF, Objective 1 a nd 2, 2000-2006 per program a rea.
Source: County Administrative Boards.
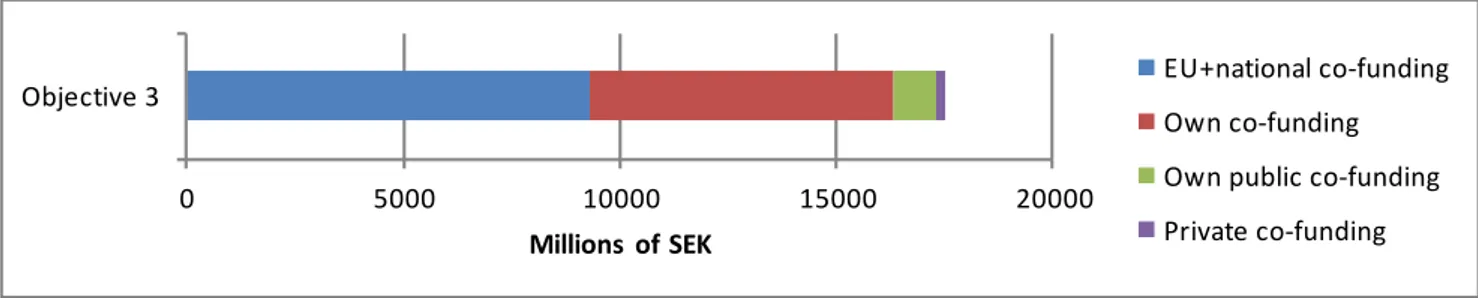
Diagram 4 Fi nal payments from the SF, Objective 3, 2000-2006.
Source: Swedish ESF-council.
- 2 000 4 000 6 000 8 000 10 000 12 000
Objective 1 Norra Norrland Objective 1 Södra skogslänsregionen
Objective 2 Norra Objective 2 Västra Objective 2 Södra Objective 2 Öarna Millions of SEK EU Privately Publically 0 5000 10000 15000 20000 Objective 3 Millions of SEK EU+national co-funding Own co-funding Own public co-funding Private co-funding
8
3 A Theoretical Framework of Regional Economic Growth
Regional development is determined by a region’s capacity to exploit and organize local resources (environmental, economic, physical and human) and to attract new resources and activities into the region. The factors that generate this capacity and determines the region’s development path and well-being is often built- in to a single indicator – the growth of a region’s per capita output or income. This allows for an analytical modeling of the development path and is often made through regional growth theories. The most accepted definition of growth by present-day theories and models of regional growth state that growth is an increase in a region’s real production capacity and its ability to maintain that increase (Capello, 2007). The most commonly used measures of regional growth are growth of output, growth of output per worker and growth o f output per capita. The most appropriate measure to use depends on the purpose for which the measure is to be used (Armstrong & Taylor, 2000).
Even though there is no single framework that captures the underlying foundations and reasons of economic growth the exogenous and endogenous models presented below are the most common ones (Howitt & Weil, 2008). Policy makers are interested in knowing which factors are the most important determinants of regional per capita income levels and how low-income regions can best be helped to catch up to high- low-income regions, hence the question is how to generate a process of convergence (Armstrong & Taylor, 2000). Since the primary goal of the EU’s Cohesion policy is convergence of regional income per capita the meanings and outcomes of the underlying economic growth- and convergence theories are of high importance (Ederveen et al., 2003).
3.1 Neoclassical (exogenous) Growth Theory
The neoclassical growth theory, developed by Solow and Swan in 1956 is one of the most important growth models which is based on the process of capital accumulation. It assumes that the economy is competitive, in the sense that factors are paid according to their marginal products, and also that factors are quickly able to be reallocated so that they are employed in their most productive use. The theory is based on the law of diminishing productivity which implies that holding one factor constant, i.e. capital the greater the level of the variable factor i.e. labor , the lower its marginal product. The theory consists of three elements: the production function expressed in per capita terms, the link between savings and growth in capital and the required investments to keep the capital- labor ratio constant given the depreciation rate and the rate of population increase (Dornbusch, Fischer & Startz, 2008). The economy reaches a steady-state when savings and required investments balance with steady-state capital. In this model the process of growth occurs when capital per head is increasing which occurs when saving exceeds investments requirements. In Diagram A1 this implies that the economy moves to the right until it reaches the point of the steady state where the line intersects the line. At this point output and capital per head are constant and the aggregate income is growing at the same rate as the population, hence the steady state growth rate is not affected by the savings rate. However an increase in the savings rate will in the long-run raise the level of output and capital per head. On the contrary an increase in population growth reduces the steady state level of capital and output per head and
9 increases the steady state growth rate of aggregate output. By allowing technology to improve over time we can obtain growth of output and capital per head in the long-run even once the economy has reached its steady state. An exogenous increase in technology causes the production function and the saving curve to rise. Thus the steady state growth rate of aggregate output is determined by the rate of technological process (Dornbusch et al., 2008).
3.2 Endogenous Growth Theory
The endogenous growth theory was developed in the late 1980s since dissatisfaction with the neoclassical growth theory had arisen on both theoretical and empirical grounds (Dornbusch et al., 2008). It can be understood as an extension to the neoclassical growth theory since it argues that the technological process is itself determined by the growth process (Ederveen, et al., 2003). While the neoclassical theory leaves out the identification of the causes of technological progress the endogenous growth theory focus on the determinants of the technological progress that enhance the long-run growth (Dornbusch et al., 2008). This is done by broadening the concept of capital to include the accumulation of human capital (Mankiw, Romer & Weil, 1992). The endogenous growth theory was developed by Romer (1986) and Lucas (1988) where growth is endogenously generated by a process of knowledge accumulation. The basic idea of the theory is to modify the production function in a way that allows for self-sustaining (endogenous) growth so that the function obtains constant marginal product of capital. This implies that both the savings and the production curve be come straight lines and savings will always be higher than required investments (Dornbusch et al., 2008). The implication of the endogenous growth model is that countries or regions that save more will have a higher growth rate and the differences in income between them can persist indefinitely even though they have the same saving and population growth rates (Mankiw et al., 1992). In the endogenous growth theory the engine of growth is the technological progress therefore differences in long-term economic growth can be explained by differences in the efforts to generate or adapt knowledge on new technologies (Ederveen, et. al, 2003).
The extended version of the neoclassical model emphasizes the importance of human capital as a critical factor in determining the productive capacity of the economy. Furthermore it points out that a region’s ability to create or absorb technical progress is not simply a matter of investing in physical or human capital but is also determined by its institutional environment. Knowledge-rich regions will be generated in an institutional environment that promotes the creation and transmission of new ideas. These regions will increase their technical knowledge which will be transformed into new products and new methods of production. As a result regional disparities exist due to institutional environmental differences. In this sense some regions are more able to generate their own technical change, hence some regions are able produce (endogenous) technical progress within the region while others acquire their (exogenous) technical progress through the purchase of new capital equipment from other regions. This difference between (endogenous) technical progress and (exogenous) technical progress in determining the labor productivity is illustrated in Figure A1. In this Figure an economy following the components of the right hand side, i.e. investing in human capital and R&D and creating a network where new ideas can easily be created and
10 transmitted will grow faster than an economy that is only relying on the components of the left hand side, i.e. investing in new capital (Armstrong & Taylor, 2000).
3.3 New Economic Geography
The new economic geography literature emphasizes the role of clustering forces in generating disparities of economic activity and income between regions. One of the primary questions that the new economic geography seeks to answer is why economic activity is distributed unevenly, with centers of concentrated activity surrounded by ‘peripheral’ regions of lower density. It provides an approach to the theory of economic agglomeration and has been applied to the economics of cities, the emergence of regional disparities, and the origins of international inequalities (Venables, 2008). Theories of agglomeration suggest that there is an important economic benefit of economic agglomeration (spatial co- location of economic agents) since economic activity and population around the world is concentrated in highly dense metropolitan areas (Sachs & McCord, 2008). Agglomeration theory is primarily a theory of external economies of scale since the profitability of each firm is higher the more other firms there are nearby. This could be because of true externalities such as direct positive links between firms, specifically knowledge spillo vers (Braunerhjelm, Faini, Norman, Raune & Seabright, 2000). There are two types of agglomeration economies, localization and urbanization economies (Ohlin, 1933). Urbanization economies are associated with city size or diversity while localization economies are associated with the concentration of particular industries (Strange, 2008).
3.4 Convergence and Divergence
Theories of convergence and divergence are theories which examine the reasons for diminishing or increasing disparities between rich and poor regions, and theories which, in the case of divergence explain the persistence of such disparities. Economic growth theories are often associated with processes of convergence or divergence (Capello, 2007). The connection between the different growth theories presented above and the process of convergence/divergence will be presented below.
The most important implication of the neoclassical model is that if two countries or regions have the same rate of population growth, the same saving rate, and access to the same production function and technology they will eventually reach the same level of income. However if their saving rates differ they will reach different levels of income but have the same steady-state growth rates (Dornbusch et al., 2008). This means that neoclassical growth theory predicts that a process of convergence will take place between countries and regions. The process of convergence will occur through a process of regional factor allocation and migration. Specifically the law of diminishing productivity implies that if the ratio is high the quantity of capital will be high relative to the quantity of labor employed, marginal product of capital will be low and the marginal product of labor will be high. This can be translated into a situation where there is a country consisting of two regions, region and region , in which the ratio is higher in region than in region . Let’s assume that the labor abundant region is poorer than the capital abundant region . In such situation the marginal product of capital will be higher in region than the marginal product of capital in region , similarly the marginal product of labor will be higher in region than in region .
11 Since factors are mobile in the neoclassical growth theory the capital will migrate from region to region , and labor will migrate from region to region in order to earn higher factor rewards. This process is illustrated in Figure A2 and will continue until the ratios are the same in both regions. This process implies that the marginal products of both mobile factors will increase and therefore the aggregate national output should increase (McCann, 2001). Two types of convergence are identified, firstly absolute convergence which implies that poorer countries or regions tend to grow faster per capita than rich ones and conditional convergence which implies that an economy grows faster the further it is from its steady state value, regardless if it is poor or rich (Barro & Sala-i-Martin, 2003).
The endogenous growth model is not designed to explain why different economies grow at different rates. The model cannot predict convergence between countries or regions since a region’s production function allows for self-sustaining endogenous growth (Mankiw et al., 1992). The model can on the other hand explain the sources of divergence. Since the model assumes that technology makes technology a poor economy will stay poor because it lacks the ability to invent and adapt new technologies while rich co untries at the technological forefront find it easier to invent and adapt new technologies, thus increasing their lead (Ederveen et al., 2003).
In the new economic geography approach a concentration of economic activity facilitates the transmission of knowledge and innovations. This implies that economic centers grow faster than other types of regions and the disparities between them can increase (Gullstrand & Hammarlund, 2007).
3.5 Impact of the EU-integration and SF-policy on Convergence
Keeping the economic growth theories and their connection to convergence/divergence in mind we now examine the effect of the EU- integration on regional disparities and shed light on the question what the impact of the SF-policy is on the process of convergence.
Original neoclassical regional growth will depend on the changes in the regional factor stocks and the level of regional technology, and since factors are mobile there will be no long-run differences in the growth-rates of factors across regions. Since regions are more open to each other than countries are when it comes to mutual regional trading relationships and factor mobility, areas that are undergoing economic integration, such as the EU should be experiencing a process of one-sector regional economic integration. This integration allows for one-sector reallocation of factors across the EU, as well as some potential regional trade and capital effects. This implies that in the long-run all regional production functions will tend to converge and over time the EU should observe a tendency towards regional convergence (McCann, 2001). There is however theories arguing that a greater integration would rather lead to regional divergence. Krugman (1993) argues that larger capital and labor mobility instead leads to divergence in both economic structure and the growth rates of regions. Bertola (1993) also argues that capital and labor mobility generates regional divergence since capital and labor tend to migrate towards the more prosperous and competitive regions. Irrespective of whether or not the EU- integration does eventually generate a process of convergence without the SF-support, these forces of convergence will act slowly and will
12 need all the help they can get, possibly through a regional policy such as the EU’s Cohesion Policy (Armstrong & Taylor, 2000). The neoclassical model predicts that if a region spends a continuous stream of cohesion support on public investment, then its steady state level of per capita GDP increases, hence the SF-support can increase a region’s level of per capita GRP. However there is a risk that the SF-support would not lead to additional public investment in lagging regions since there exists a problem of crowding out at the regional level. Crowding out occurs as national governments change the allocation of their support to backward regions due to the funding received from the EU (Ederveen, et al., 2003). Ederveen, et al., (2003) show that, on average every €1 of cohesion support crowds out €0.17 of national regional aid. In the endogenous growth models, policy interventions can make a difference since they can stimulate the growth of the knowledge intensity of the labor supply and knowledge production in the form of R&D (Karlsson et al., 2001). In the endogenous growth theory a higher level of knowledge creates new knowledge which enhances higher growth rates. Therefore it is possible to affect the growth by an intentional investment in R&D, and regional policies such as the EU’s Cohesion Policy that increase the population’s level of education could lead to a higher growth performance. The SF are mainly directed to areas of intervention such as development of SME, infrastructure, human resources and R&D as well as capacity building. According to the endogenous growth theory an improvement in such areas could increase a region’s growth rate (Gullstrand & Hammarlund, 2007).
As for the new economic geography theory, according to Braunerhjelm et al. (2000) specialization and reallocation of economic activity within Europe should not necessarily lead to geographic concentration or regional inequality. But if there are sufficiently large gains from agglomeration freer European markets co uld lead to geographic concentration and polarization. SF-support for lagging regions is most likely insufficient to reverse the agglomeration dynamics that prevail at present, however the support might be able to retard the agglomeration process or support a more equal distribution of economic activity (Ederveen, et al., 2003).
The neoclassical growth model leads us to the hypothesis that the SF-policy would promote economic growth as they increase the rate of investment in physical capital. Meanwhile the endogenous growth theory leads us to a similar hypothesis since the SF-policy increase investment in human capital in the program areas. At the same time the SF-policy could retard the agglomeration process and foster a more equal distribution of economic activity.
13
4 Empirical Analysis
4.1 Data and Method
This section will explain the method for the empirical testing and the analysis of the model used. In order to examine whether the SF-policy enhances economic growth and convergence between the Swedish regions the analysis is divided in two parts.
In the first part we examine if there has been any convergence between the Swedish regions between the years 2000-2007. This analysis is performed at the LA region level as well as at the urban area level. Two kinds of convergence theory models are used; σ-convergence and absolute β-convergence (Sala-i-Martin, 1996).
In the second part we examine the growth of the indicators employment, education and new firm formation within the Objective 1, 2 and 3 areas. These indicators are chosen because they represent the main aims of the SF-policy in the Objective 1, 2 and 3 areas. Specifically we want to examine if the areas that have received much support (Objective 1 areas) have had a better growth than the areas that have received less (Objective 2 areas) or no support from the SF. The growth of the indicators in the Objective 3 areas will be estimated separately due to data constraints and overlapping of the different Objectives6.
The observations are collected at the urban area level from Statistics Sweden. The quality of the data from Statistics Sweden can be questioned; alternative data sources could have been used in order to obtain more reliable results. However, due to the small size of this thesis and the lack of time we have chosen to rely on the data from Statistics Sweden.
Sweden consists of 289 urban areas which are divided into 75 LA regions7. When the analysis is performed at the LA region level the data has been transformed from urban area level to LA-region level. LA regions are used because it is the most appropriate division to use for regional analyses due to regional formation through commuting patterns. A LA region is defined as a functional region within which people can live and work without having to make too time-wasting journeys (Swedish Agency for Economic and Regional Growth, 2010). The data on the final investments from the SF has been obtained from 5 different county administrative boards and the Swedish European Social Fund (ESF) -council. Since data on the investments from the SF is not available on the urban area level we assume that every SF-eligible urban area in a program area has received funding. Consequently the total amount of support to the program area has been divided by the populatio n of the program area in order to obtain the support in per capita terms. Since all urban areas in Sweden are eligible for Objective 3 support the Swedish ESF-council has composed data on the urban area level, which has been transformed into per capita terms.
6
Overlapping of the Objectives is described in Section 2.2 7
14
4.2 Model of β-convergence and σ-convergence
There are two ways of measuring convergence, β-convergence and σ-convergence. Absolute β-convergence occurs when β is negative. This implies that poor economies tend to grow faster than rich ones. σ-convergence occurs if the dispersion of the economies’ real per capita GDP levels tend to decrease over time. It is important to note that the existence of β-convergence is a necessary condition for σ-β-convergence. In the case of similar economies such as regions within a country it is more likely to find absolute β-convergence as well as σ-convergence. This is the reason why this study will only estimate absolute β-convergence (Sala-i-Martin, 1996).i
To control if the poorer regions of Sweden are growing faster than t he richer ones, the absolute β -convergence model is used. Equation 1 is used to estimate absolute convergence (Gullstrand & Hammarlund, 2007):
(
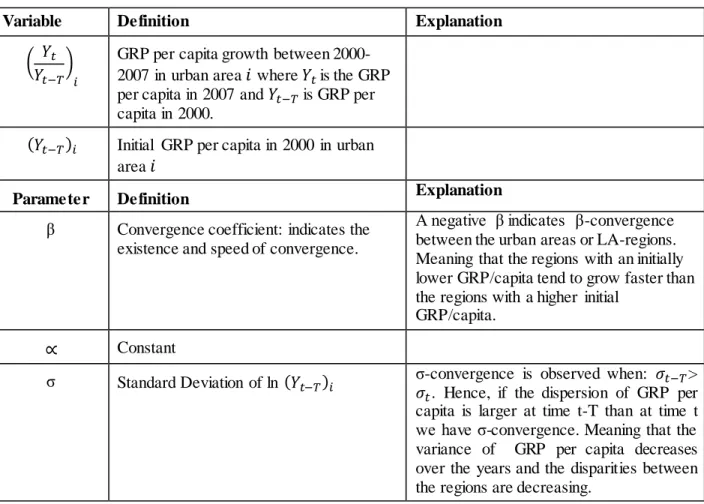
) Table 2: Va ri able a nd parameter description of Equation 1.
Source: (Sala-i-Martin, 1996) and (Gullstrand & Hammarlund, 2007).
As can be observed in Table 3 a negative β is observed at both the LA- level and urban area level. However these values are only statistically significant at the urban area level. This iimplies that we can conclude that there has been a process of convergence between Swedish urban areas from 2000-2007.
Variable Definition Explanation
( )
GRP per capita growth between 2000-2007 in urban area where is the GRP per capita in 2007 and is GRP per capita in 2000.
Initial GRP per capita in 2000 in urban area
Parameter Definition Explanation
β Convergence coefficient: indicates the existence and speed of convergence.
A negative β indicates β-convergence between the urban areas or LA-regions. Meaning that the regions with an initially lower GRP/capita tend to grow faster than the regions with a higher initial
GRP/capita. Constant
σ Standard Deviation of ln σ-convergence is observed when: . Hence, if the dispersion of GRP per > capita is larger at time t-T than at time t we have σ-convergence. Meaning that the variance of GRP per capita decreases over the years and the disparities between the regions are decreasing.
15 Table 3: Regression result from OLS estimation of a bsolute convergence
Variables LA-regions 2000-2007 Urban areas 2000-2007 α t-stat (.986) 1.083 .890 (2.872) β t-stat -0.063 (-.706) -.050* (-1.966) F-value .499 3.867 .007 .013 N 75 289
*Statistically significant at 5% level
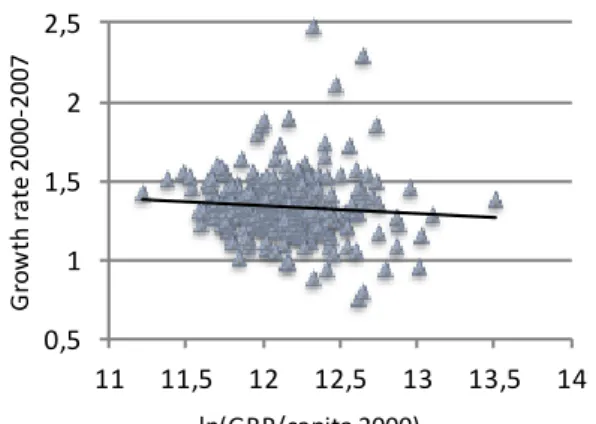
In Diagrams 5 and 6 the growth rate versus the GRP per capita is presented. The log of the GRP per capita for 2000 is depicted on the horizontal axis while the growth rate of per capita GRP between 2000-2007 is depicted on the vertical axis. The regression result indicates that the estimated speed of convergence, β is negative. Thus the slope of the regression line is negative, both at the LA and urban area level. From the convergence perspective, this is positive. Since the regions with initially lower GRP are growing faster than the richer ones, meaning that they tend to grow towards equal levels. Therefore β-convergence occurs. However the value is only statistically significant a t the urban area level, meaning that we can only conclude that convergence occurs at the urban area level. A possible reason why β-convergence does not occur at the LA-region level is that it is easier for smaller regions which are more similar to each other to converge than for larger regions which tend to be more dissimilar to each other. This reasoning is in line with Sala-i-Martin’s (1996) convergence theory which states that smaller regions within a country are more likely to converge towards each other in an absolute sense than countries. The SF-policy primarily aims at decreasing the regional disparities through the promotion of convergence between regions. On these grounds the result that β-convergence occurs at the urban area level strengthens the reasons to believe that the SF-policy fosters convergence between the Swedish urban areas.
Diagram 5: Diagram 6:
Growth ra te vs. i nitial GRP/capita in LA-regions Growth ra te vs. i nitial GRP/capita in urban areas
0,5 1 1,5 2 2,5 11,75 12 12,25 12,5 12,75 G ro w th r ate 2 0 0 0 -2007 ln(GRP /capita 2000) 0,5 1 1,5 2 2,5 11 11,5 12 12,5 13 13,5 14 G ro w th r ate 20 00 -2007 ln(GRP/capita 2000)
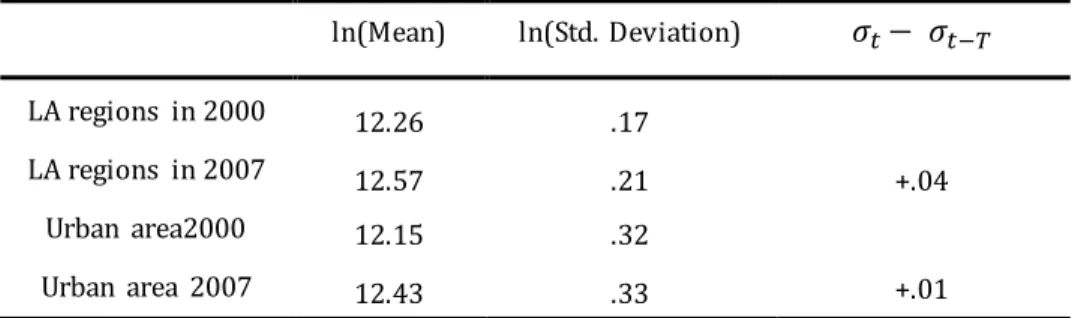
16 According to Table 4 the requirements for σ -convergence does not hold, neither on the LA-region or urban area level, since is smaller than . Meaning that the standard deviations for 2000 are smaller than the standard deviations for 2007.
Table 4: Des criptive statistics of per ca pita GRP, for σ-convergence
Diagram 7 and 8 show the dispersion of the GRP per capita where the years 2000-2007 are depicted on the horizontal axis and the log of the standard deviation of GRP per capita are depicted on the vertical axis. It is obvious that the dispersion between both the LA-regions and the urban areas have been increasing from 2000 to 2007. This means that there is no sign of σ-convergence and that the disparities between the regions are rather increasing than decreasing. An interesting phenomenon is the cyclical pattern in the diagrams which shows that the dispersions increase when the economy is expanding while the dispersions decrease in recessions. Between 2001-2003 the Swedish economy experienced a recession, as can be seen in the Diagrams 7 and 8 the dispersion of per capita GRP decreased between these years. Meanwhile the dispersion of per capita GRP increased between the 2004-2006 when the economy was expanding and decreased again in 2007 when the growth rate was slowing down (Ekonomifakta, 2010). This indicates that the profits that the economy experience in prosperous business cycles does not reach the most disadvantaged regions. Hence, the distribution of income becomes unequal when the economy as a whole is improving.
Diagram 7: Diagram 8:
Di s persion of per ca pita GRP i n LA-regions Di s persion of per ca pita GRP i n urban areas
ln(Mean) ln(Std. Deviation) LA regions in 2000 12.26 .17 LA regions in 2007 12.57 .21 +.04 Urban area2000 12.15 .32 Urban area 2007 12.43 .33 +.01 0,16 0,185 0,21 0,235 2000 2002 2004 2006 ln ( Sta n d ar d D ev ia ti o n) Year 0,309 0,319 0,329 0,339 2000 2002 2004 2006 ln ( Sta n d ar d D ev ia ti o n ) Year
17
4.3 Model of Goal Indicator Analysis
This model will examine the growth of the goal indicators employment, education and new firm formation in the different program areas. This will be done by using separate regression models for each goal indicator, i.e. employment, education and new firm formation. Equation 2 states the model which will be used for Objective 1 and 2.
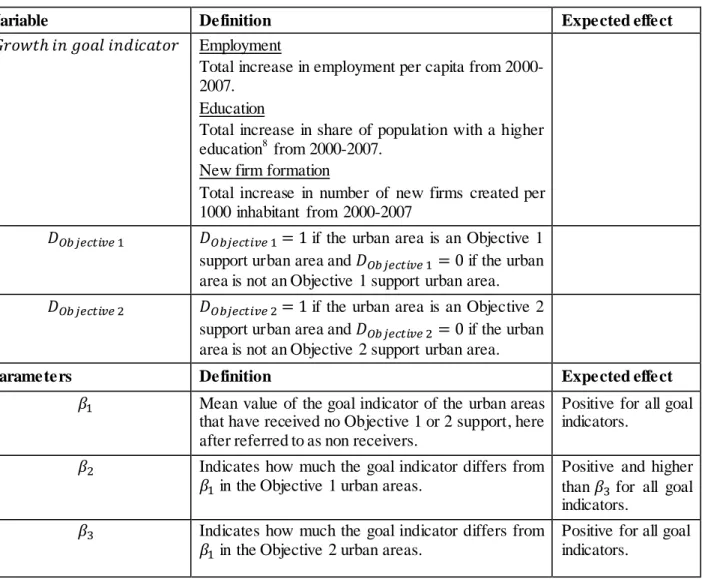
Table 5 Va ri able a nd parameter description for Equation 2
Variable Definition Expected effect
Employment
Total increase in employment per capita from 2000-2007.
Education
Total increase in share of population with a higher education8 from 2000-2007.
New firm formation
Total increase in number of new firms created per 1000 inhabitant from 2000-2007
if the urban area is an Objective 1 support urban area and if the urban area is not an Objective 1 support urban area. if the urban area is an Objective 2
support urban area and if the urban area is not an Objective 2 support urban area.
Parameters Definition Expected effect
Mean value of the goal indicator of the urban areas that have received no Objective 1 or 2 support, here after referred to as non receivers.
Positive for all goal indicators.
Indicates how much the goal indicator differs from in the Objective 1 urban areas.
Positive and higher than for all goal indicators.
Indicates how much the goal indicator differs from in the Objective 2 urban areas.
Positive for all goal indicators.
Source: Gujarati and Porter (2009)
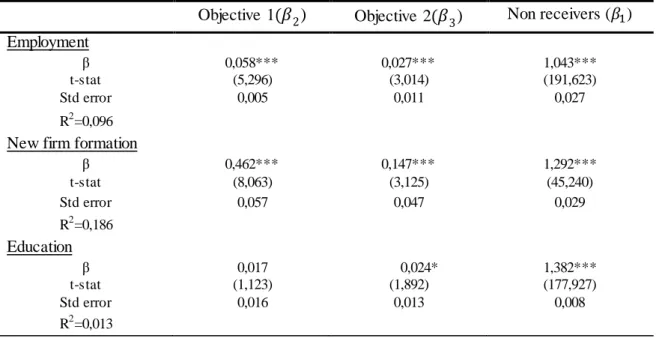
Table 6 shows the results of the three different regressions. For employment, the results indicate that the mean growth in employment per capita is 0,058 higher in the Objective 1 areas than the mean growth in the non receiving areas. Similarly the mean growth in employment per capita is 0,027 higher in the Objective 2 areas than in the non receiving areas. Since all the β-values for employment are statistically significant we can conclude that both the Objective 1 and 2 areas have had a higher mean growth in employment per capita between 2000-2007 than the non-receiving regions. We can also conclude that the Objective 1 areas have had the highest mean growth in employment. For new firm formation the results
8
Minimum 3-year post-secondary education
18 are similar, both the Objective 1 and 2 areas have had a higher mean growth in number of new firms created per 1000 inhabitant than the non receiving areas. Likewise the Objective 1 areas present the highest mean growth in new firm formation. For the growth in share of population with higher education the value for Objective 2 is statistically significant at the 10% level but insignificant for Objective 1. This implies that we can conclude that the increase in share of population with higher education has been higher in the Objective 2 areas compared to the non receiving areas. On the other hand we cannot make any conclusions for the education in the Objective 1 areas. A reasonable explanation for this is that the entire Objective 1 area only has 3 universities compared to 36 in the rest of Sweden (Swedish National Agency for Higher Education, 2010).
In summary the results indicate that the regions that have received SF-support under Objective 1 and 2 have had a better growth in employment and have had a higher growth of firm formation compared to the non receiving regions during the period. Since the SF-policy of Objective 1 and 2 is, to a high degree aimed at increasing the employment and create new firms these results indicate that the SF-policy has accomplished its aims in these program areas. These aims are reached due to investments in human resource development, industrial development, capacity build ing and development of SMEs. These are investments in physical and human capital which, according to the neoclassical and endogenous growth theories would promote economic growth where the investments are made. This confirms the hypothesis that the SF would promote economic growth as they increase the rate of investment in physical and human capital.
Table 6 Regression results for goal i ndicators, 2000-2007, Objective 1 a nd 2.
Objective 1 ) Objective 2 ) Non receivers ( ) Employment β t-stat 0,058*** (5,296) 0,027*** (3,014) 1,043*** (191,623) Std error 0,005 0,011 0,027 R2=0,096
New firm formation
β t-stat 0,462*** (8,063) 0,147*** (3,125) 1,292*** (45,240) Std error 0,057 0,047 0,029 R2=0,186 Education β t-stat 0,017 (1,123) 0,024* (1,892) 1,382*** (177,927) Std error 0,016 0,013 0,008 R2=0,013
***Statistically significant at the 1% level N=289
**Statistically significant at the 5% level *Statistically significant at the 10% level
The effect of the Objective 3 interventions had to be estimated in a separate model due to data constraints and overlapping of the Objectives. Note that some of the Objective 3 urban areas
19 also have received Objective 2 support. Moreover since the Objective 3 interventions are already included in the Objective 1 areas the Objective 1 areas cannot be seen as non receivers of Objective 3 support. Hence, the entire Sweden has received more or less Objective 3 funding, the question is where this funding has been most effective. To estimate the effect of the Objective 3 interventions the goal indicators employment and education are used. The reason why the indicator new firm formation is left out is because Objective 3 is focused on increased employment through human resource development and education. Work of change, skills supply and capacity building within working life are the primary interventions in the Objective 3- program (NUTEK, 2001). Equation 3 is estimated in order to analyze the growth of the goal indicators in the Objective 3 areas.
Table 7 Va ri able description of Equation 3
Variable Definition Expected effect
Employment
Total increase in employment per capita from 2000-2007.
Education
Total increase in share of population with a higher education from 2000-2007.
Mean value of the goal indicator of the urban areas that have received no direct Objective 3 support.
Positive for all goal indicators. Indicates how much the goal indicator differs from in
the Objective 3 urban areas.
Negative for all goal indicators.
Parameters Definition Expected effect
if the urban area is an Objective 3 support urban area and if the urban area is not an Objective 3 support urban area.
From the Objective 3 regression analysis, significant values can be observed for employment but not for education in Table 8. The value for employment is negative, indicating that the Objective 3 areas have had a lower mean growth in employment, compared to the areas which received no direct Objective 3 funding. By estimating the Objective 3 interventions in a separate model we can assume that the Objective 3 interventions have been more successful in the areas that have not received direct Objective 3 support, hence mainly the Objective 1 areas. This becomes clear as growth in employment is the highest in these areas. Meanwhile growth in employment is 0.048 lower in Objective 3 areas. On the other hand the amount of Objective 3 support is significantly lower in per capita terms than Objective 1 and 2 support. Therefore it can be unreasonable to expect any positive growth results based on the Objective 3 support.
20 Table 8 Regression results for goal i ndicators, 2000-2007, Objective 3.
Objective 3 Non receivers of direct Objective 3 (β1) Employment β t-stat -0.048*** (-4.536) 1.101*** (114.772) Std error 0.011 0.010 =0.067 Education β t-stat -0.009 (-0.575) 1.40*** (103.218) Std error 0.015 0.014 =0.01
***Statistically significant at the 1% level N=289 **Statistically significant at the 5% level
*Statistically significant at the 10% level
In order to find out if the urban areas that have received the least part of the SF-support have grown more or less than the areas that have received both Objective 1 and 3 or 2 and 3 support a regression analysis for the urban areas that have only received Objective 3 support performed.
Table 9 Va ri able a nd parameter description of Equation 4
Variable Definition Expected effect
Employment
Total increase in employment per capita from 2000-2007.
Education
Total increase in share of population with a higher education from 2000-2007.
Mean value of the goal indicator in the urban areas that have received more than just Objective 3 support.
Positive for all goal indicators. Indicates how much the goal indicator differs from in
the only Objective 3 urban areas.
Negative for all goal indicators.
Parameters Definition Expected effect
if the urban area has only received Objective 3 support and if the urban area has received more than just Objective 3 support.
The results from this regression analysis can be observed in Table 10. Once again it becomes clear that the Objective 3 areas have had a lower growth development. By performing this (Eq. 4)
21 regression analysis it becomes clear that the areas that has not received Objective 1 or 2 support, hence only Objective 3 support have had a lower growth of employment than all other urban areas. In addition these areas have had a lower growth of education than all other areas. From these results it can be concluded that the urban areas that have received the most SF-support have grown the most while the urban areas that have received the least SF-support have grown the least. Mean growth of employment has for instance been the highest in Objective 1 areas which have received the largest amount of funding. Meanwhile the urban areas that did not receive either Objective 1 or 2 supports had a smaller growth of employment than both Objective 1 and 2 areas. Hence, the achievements of the SF-policy’s aims seem to be related to the amount of SF-support that an urban area has received. This indicates that the SF-policy’s interventions are effective to the degree that they aim to be effective, thus the more SF-support the higher effect in terms of growth in the goal indicators. This is an important and positive finding which speaks in favor of the SF-policy.
Table 10 Regression results for goal i ndicators, 2000-2007, onl y Objective 3.
Only Objective 3 Non receivers of only Objective 3 (β1) Employment β t-stat -0.038*** (-4.8) 1.082*** (188.023) Std error 0.008 0.006 =0.074 Education β t-stat -0.022* (-1.940) 1,404*** (173.029) Std error 0.011 0.008 =0.013
***Statistically significant at the 1% level N=289 **Statistically significant at the 5% level
22
5 Conclusions and suggestions for future research
In this study the impact of the SF-policy between 2000-2007 on regional growth in Sweden has been analyzed. Since regional convergence is the overall aim of the EU’s SF-policy the study has questioned if there has been any sign of regional convergence in Sweden. Furthermore the study has examined the development of important SF goal indicators as employment, education and new firm formation in the different Objective areas.
The study has found results of absolute β-convergence at the urban area level, from this we can conclude that the overall regional convergence aim set by the EU has been achieved in Sweden. At the same time the results of the growth of the goal indicators show that the Objective 1 and 2 areas, which received most part of the SF-support, have achieved their aims in increasing employment and creating new firms. In addition the Objective 2 areas have had a higher increase in share of population with higher education compared to the areas that did not receive either Objective 1 or 2 support. The Objective 3 areas, which received the least part of the SF-support, did not present the same positive results of its interventions. The Objective 3 areas had a lower mean growth in employment than the areas that received no direct Objective 3 support. In addition the areas that only received Objective 3 support had a lower growth of both employment and education than all other areas. This suggests that the policy of the Objective 3 interventions should be reconsidered in order to reach its aims more effectively. From the results we can reach the overall conclusion that the positive impact of the SF-policy on the goal indicators seem to be the largest in the areas that received most part of the funding.
It can be concluded that the results of absolute β-convergence and achievement of the aims in the Objective 1 and 2 areas indicate that the SF are e ffective in enhancing economic growth in the areas of intervention. These results are not in line with the study performed by the Swedish Institute for Growth Policies (2004) which found no sign of convergence or positive impact of the SF-policy. The reason why the results from this study differ so much from the results of the one performed by the Swedish Institute for Growth Policies might be that the two studies are performed for different time periods. Therefore it might be the case that the efficiency of the SF-policy has improved from the program period 1995-1999 to the program period 2000-2006.
Yet the results of this study point to some recommendations for the future SF-policy. First of all it should be noted that an exact impact of the SF-policy is very hard to estimate since it is difficult to know if the results solely depend on the investments from the SF. In addition the allocation of the funding is very dispersed and hard to trace. Therefore the goals should be set according to their ability to be measured. Even though this study generally has found positive results for the SF-policy the finding that the distribution of income is becoming more unequal as the economy as a whole is improving suggests that the economy’s profits should be better distributed in good times so that they reach the most disadvantaged regions too.
The interest on this topic is certainly increasing, not to mention due to the enlargement of the EU. There are many important areas to consider in future research on this topic that this study has not brought up. Among those the inclusion of control variables is an important extension
23 of this type of study. By including control variables both in the convergence and the goal indicator analysis the results of the SF-impact would become more exact. Since statistically significant results of the goal indicator education were difficult to obtain the impact of the SF-policy on education could be more closely analyzed. In addition an improved availability of more precise data, especially concerning the allocation of the support would allow for more exact and confident conclusions in future research on the topic.