J
Ö N K Ö P I N GI
N T E R N A T I O N A LB
U S I N E S SS
C H O O LJÖNKÖPING UNIVERSITY
I l l - h e a l t h i n S w e d e n
A Regional Perspective
Master thesis in Economics
Author: Karin Berntsson Tutor: Lars Pettersson
Johan Eklund
Master’s Thesis in Economics
Title: Ill-health in Sweden – A Regional Perspective Author: Karin Berntsson
Tutors: Lars Pettersson
Johan Eklund
Date: 2005-05-30
Subject terms: Ill-health, Sick leave, Sickness Insurance, Income, Municipalities
Abstract
This thesis examines the regional development of ill-health and the purpose is to ana-lyse factors that tend to influence the Swedish ill-health. Theory of household choice between work and leisure is used when analysing the results of the empirical study. The background for this thesis is derived from the development of ill-health that has increased with 5.1 days between the years 2000 and 2004. The empirical findings show that unemployment has a positive relationship with ill-health and that women tend to be more ill than men. Furthermore, the results confirm that income has a negative relationship with ill-health and this is also true for large companies. Conse-quently, small companies have positive influence on ill-health and an analysis of the municipalities in the northern part of Sweden points out a higher number of ill-health than the other municipalities. Moreover, the individuals’ age is also a factor that can explain the development of ill-health. These findings confirm that unem-ployment, gender, income, size of company, age, and the municipalities in the north-ern part are factors that can explain the development of ill-health. However, other factors are important in the process as well.
Magisteruppsats inom Nationalekonomi
Titel: Ohälsa i Sverige – Ett regionalt perspektiv Författare: Karin Berntsson
Handledare: Lars Pettersson
Johan Eklund
Datum: 2005-05-30
Ämnesord Ohälsa, sjukfrånvaro, sjukförsäkring, inkomst, kommuner
Sammanfattning
I denna uppsats behandlas ohälsans regionala utveckling och syftet är att analysera vad som påverkar den svenska ohälsan. Teori angående hushållens val mellan fritid och arbete används för att analysera resultaten från den empiriska undersökningen. Bakgrunden till denna uppsats bottnar i utvecklingen av ohälsotalen som har ökat med 5,1 dagar mellan åren 2000 och 2004. De empiriska resultaten påvisar att arbets-lösheten har ett positivt samband med ohälsa och att kvinnor tenderar att vara mer sjuka än män. Vidare bekräftar resultaten att inkomsten har ett negativt samband med ohälsa och detta är även sant för stora företag. Följaktligen har små företag en positiv inverkan på ohälsotalen och en analys av kommuner belägna i den norra de-len av Sverige påvisar ett högre ohälsotal än övriga kommuner. Vidare är individernas ålder en faktor som kan förklara utvecklingen av öhälsotalen. Dessa resultat bekräftar att arbetslöshet, kön, inkomst, företagsstorlek, ålder och kommuner belägna i den norra delen är faktorer som kan förklara ohälsotalens utveckling, men även andra faktorer är av betydelse.
Table of Contents
1
Introduction ... 1
1.1 Earlier Research...2
1.2 Outline ...3
2
Theoretical Framework... 4
2.1 Theory of Household Choice ...4
2.2 The Allocation of Time...5
2.3 The Insurance Approach ...7
2.4 Summary ...7
3
Ill-health and Social Insurance in Sweden... 8
3.1 Behavioural Pattern of Ill-health ...8
3.2 Social Insurance ...13
3.3 Governmental Policy towards Sick Leave ...14
3.4 Summary ...15
4
Empirical Analysis of Ill-health in Sweden ... 16
4.1 Presentation of Data...16
4.2 Empirical Findings and Analysis ...18
5
Conclusion and Suggestions to Further Research ... 24
Figures
Figure 2-1 Time allocation decision between work and leisure...4
Figure 2-2 Introduction of a tax...5
Figure 3-1 Ill-health in relation to age goups, 2000 and 2004...8
Figure 3-2 Ill-health between men and women...9
Figure 3-3 Regional ill-health, 2000 and 2004 ...11
Figure 3-4 Increase in ill-health during the years 2000 and 2004 ...12
Figure 3-5 Regional deviations from the national average, 2004...12
Tables
Table 4-1 Presentation of statistical varaiables ...17Table 4-2 Regression results...19
Table 4-3 Regression results, transformed...21
Appendix
Appendix 1-1 Regional development of ill-health in respect of women. ...27Appendix 1-2 Regional development of ill-health in respect of men...27
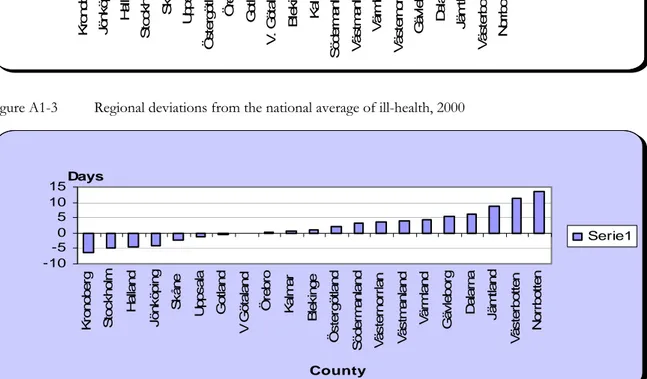
Appendix 1-3 Regional deviations from the national average, 2000 ...27
Appendix 2-1 Summary statistics ...28
Appendix 2-2a Correlations, 2000...28
Appendix 2-2b Correlations, 2004...28
Appendix 2-3a Correlation matrix, year 2000 ...29
Appendix 2-3b Correlation matrix, year 2004 ...29
Appendix 2-4 Regression results, LA-division ...30
Appendix 2-5a Regression results, year 2000...30
1 Introduction
Sick leave1 and sickness insurance have been important topics in Sweden that have received lots of attention for a long time (Rikner, 2002). The public cost for sickness benefits have dramatically increased along with absence due to illness between 1997 and 2002. These fig-ures have been doubled. Particular alarming is the development of cases that last longer than one year. These have increased from 44.700 in 1997 to 135.000 at the end of 2003. The increased number of people on sick leave has been particularly large among females (Ds 2004:16). During a period of only five years, the costs of the Swedish sickness insur-ance system increased form 13.9 to 41.3 milliards SEK (Ds 2003:63).
This development may seem a little bit odd since the Swedish residents have a high average length of life, high hygienically standard, few smokers, and a high level of education (Swe-denborg et al., 2003). In addition, health has been improved tremendously during the last couple of decades (Westerlund, 2005). Most people agree that the extensive sick leave in Sweden is a serious problem since it has made the costs of sick leave and early retirement pensions to explode during recent years. Moreover, sick leave is not only a problem for the public sector; it also means that fewer individuals are working (Swedenborg et al., 2003). There are several ways to measure sick leave and in this thesis one has chosen ill-health to represent this. Ill-health reflects the compensation paid out from the social insurance as a result of illness for the Swedish residents in an age between 16 and 64 years. More pre-cisely, ill-health mirrors the number of days with sickness-, early retirement-, rehabilitation-, and work injury-benefits. However, ill-health does not measure the first weeks of a sickness period since the employers are obligated to pay compensation during this period (Social in-surance office, 2005).
Within a few years, several of the workers in Sweden will retire. In order to increase and create a durable growth in Sweden, and to secure a continued developed welfare system, more people are needed to participate in the work force. An increased growth and an im-proved welfare require a work force with good health (Ds 2004:16). It is therefore most significant to have a work force with minimal sick leave so they can participate in the pro-duction. The question asked in this thesis is how the pattern of ill-health has developed during the years 2000 and 2004 and which factors influence ill-health? The purpose with this paper is to examine the regional development of ill-health in Sweden and to analyse factors that tend to influence ill-health.
The number of people on sick leave and early retirement pensions increased significantly during the second half of the 1980s but began to cool off in 1991. However, the number of people on long-term sick leave continued to increase. This development is alarming and it is therefore important to study the causes for absence due to illness (Bjernbäck et al., 1992). Sweden had in the beginning of the 1990s a higher rate of total absence2 than most other OECD-countries. A Swedish labour force survey from the late 1980s indicates that absence from work due to illness was at least twice as high in Sweden in comparison with the other OECD-countries (Holmlund, 1991). The sick leave rate started to decrease in the begin-ning of the 1990s but then, the cost of public sickness benefits started to increase
1 Sick leave put emphasis on properties on the patient and the disease p.16 (Englund, 2002).
2 Total absence includes absence from work due to illness and injury, holidays and vacations, and maternity
cally. During the 1990s, there were lots of political changes within the Swedish sickness in-surance system. For instance, there were changes in the compensation rate, insertion of employer obligation to pay compensation from the first day of absence and the insertion of a qualifying day (Rikner, 2002).
1.1 Earlier
Research
Many possible explanations to the increased number of people on sick leave have been highlighted by the Swedish Government during previous years. The number of publica-tions relating to this subject is large. The suggested explanapublica-tions are as follows: a decrease in public health, a worsened working environment, a demographic change of the work force, a higher level of employment and a lower level of unemployment, changes in the economic driving forces3, more restrictive early retirement pensions and administrative shortcomings such as medical certificate (SOU 2002:62). However, there is very finite re-search on the topic on what influences sick leave and the causes behind it. Most often the results are too general to be of any importance for the modern medical health service (SBU, 2003). Thus, earlier investigations have not been able to conclude any unambiguous reasons to the development of sick leave (Ds 2004:16). The solution on how to decrease the costs of sick leave seems therefore to be very difficult, since the reasons behind it gen-erate a complex relationship (Swedenborg et al., 2003).
Holmlund (1991) argues that there has been very little theoretical and empirical research by economists on causes and consequences of worker absenteeism. He provides a theoretical analysis in order to explain how experience rating in health insurance affects worker com-pensation, absence from work, employment, and output. The first model does not have any adjustments of taxes in connection to the introduction of experience rating, while the sec-ond model has this. In the secsec-ond model this is accompanied with an offsetting reduction in payroll taxes. This has been done in order to preserve fiscal neutrality. The results from the two models have different implications. Holmlund concludes that when the payroll tax is fixed, the experience rating increases nonpecuniary compensation and reduces the out-put. However, the effect on the wage and on the attendance is unclear. In contrast to this model, the second model experiencing rating accompanied with payroll tax adjustment will make the attendance, wage, and output to increase. Nevertheless, the effect on nonpecuni-ary compensation is unclear (Holmlund, 1991).
Johansson and Palme (1993) investigate the effect of economic incentives on absenteeism in Sweden where absenteeism is modelled as an individual day-to-day decision. The conclu-sion drawn from the study suggests that changes in the unemployment rate and changes in the level of compensation from the sickness insurance can explain approximately 70 per-cent of changes in the work absence rate 10 years later (Johansson and Palme, 1993). Rikner (2002) analysed the optimal levels of compensation in the public sickness insurance and in the employer-provided sickness insurance and concludes that the optimal sick-pay is lower than the wage in the one-period models. However, in the two-period models that are dynamic models, Rikner (2002) concludes that the most favourable sick-pay could probably be equal to the wage (Rikner 2002).
3 For instance changes in the level of compensations in the sickness insurance or insertion of a day of
Bergendorff et al. (2002) examined sick leave4 in eight European countries and concluded that Sweden, Norway and the Netherlands all had a higher sickness absence in comparison to Denmark, France, Finland, Germany, and the United Kingdom (Ds 2002:49). The common factor for these three countries was that they all had a more generous compensa-tion system (Ds 2003:63). In addicompensa-tion, Sweden showed a clear relacompensa-tionship between sick leave and unemployment. As unemployment increased, sick leave decreased (Ds 2002:49). Berggren and Carlsson (2003) examined regional differences of sick leave in Sweden and concluded that ill-health increases as the unemployment increases. On the other hand, they discovered a negative relationship between sick rate and unemployment (Berggren and Carlsson, 2003).
1.2 Outline
Chapter two presents economic theory where the allocation of time, choice between in-come and leisure, and the insurance approach are described. Chapter three illustrates the development of ill-health and provide a description of the social insurance system in Swe-den. The following chapter presents statistical data and contains an analysis of the empirical findings of factors influencing ill-health and if ill-health tends to differ between the Swed-ish regions. The conclusion and suggestions to further research are presented in chapter five.
2
Theoretical Framework
This chapter starts with presenting a theory of how households make choices between income and leisure. This is followed by economic theory in relation to the topic of allocation of time between different activities. Then, the insurance approach is described and the chapter is ended with a summary.
2.1 Theory of Household Choice
This model explains different choices that a household faces. For instance, the model de-fines how much time households will spend on leisure instead of working. Individuals allo-cate 168 hours between work and leisure5 during a week. Figure 2-1, below, shows how households decide to allocate their time.
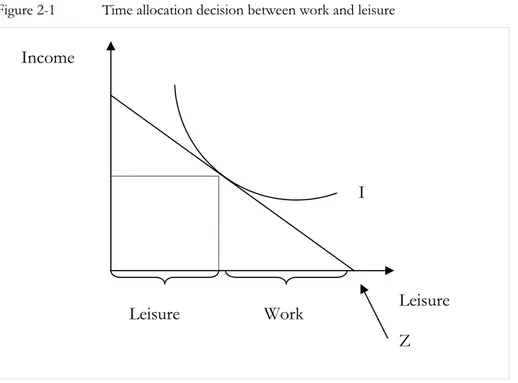
Figure 2-1 Time allocation decision between work and leisure
The straight line is the income-time budget line and represents the relationship between in-come and leisure. The slope of the line is determined by the hourly wage rates. Higher wage rate is characterized by a steeper time-budget line. If an individual choose to allocate the entire week to leisure, the income will be zero. This relationship is shown as point z in the figure. Individuals choose a point on the time-budget line in order to decide how many hours to work. The slope of the indifference curve for leisure and income are the marginal rate of substitution. This rate specifies the individuals’ willingness to give up a certain amount of income in order to receive one more hour of leisure, while still remaining indif-ferent. As individuals devote more time on leisure, they allocate less time to work since work is the opposite of leisure (Schotter, 2001). Figure 2-2 shows what happens if a tax is introduced.
5 Leisure is defined as all other activities that are not allocated on work.
Leisure Work
Income
I
Leisure Z
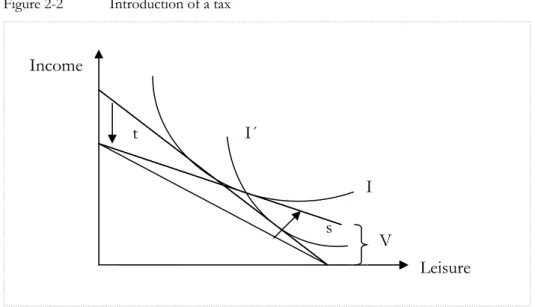
Figure 2-2 Introduction of a tax
The income-time budget line decreases as a tax (t) is established and the new indifference curve is represented by I´. V represents the social security net for the individuals. As the tax increases, other non-working income increases. Thus, less time is devoted on work and more time is allocated on leisure. The change in norms occurring makes the indifference curve to change and move outwards and become steeper. Nevertheless, there is a substitu-tion effect (s) which makes the individuals to reach the original indifference curve (I). In other words, the individuals remain on the original indifference curve since they remain in-different between the new and the original consumption bundles.
Individuals choose their best achievable points in order to reach the highest possible indif-ference curve. This is obtained by making the marginal rate of substitution between leisure an income equal to the wage rate. Thus, the choice made depends on the wage rate earned. As an individual starts to work, the income increases due to that the individual exchange hours into income in accordance with the time-budget line. According to this theory, the hourly wage rate given up is the opportunity cost of an hour of leisure. Hence, a higher opportunity cost of leisure represents a higher wage rate and this brings about an increase in the hours devoted on work and a decrease in leisure. Furthermore, as individuals do not work, they sacrifice income for leisure.
There is interplay between economic incentives and social norms in the framework of work decisions. Individual behaviour is influenced by social norms and economic incentives. Economic incentives are more important than social norms for some decisions and some-times the opposite is true. There are also occasions where both economic incentives and social norms are involved in the decision making process. Individuals face two choices. The first is an economic choice and the other is a political choice. The economic choice refers to whether individuals choose to live off public transfers or work and the political make references to the size of the transfer. In equilibrium, the intensity of social norms and transfer size are determined in an endogenous way (Lindbeck, Nyberg and Weibull, 1999).
2.2 The Allocation of Time
Becker (1965) defines a model where the allocation of time can be applicable in all non-work activities (Becker, 1965). He argues that the efficiency and allocation of nonnon-working time are important to economic welfare and that it might be more important than that of working time. Earlier empirical research has been evidence for that the income elasticity of
Income Leisure s t I I´ V
demand for different products has been biased as the cost of time has been neglected. Thus, indirect costs are important when examining all nonworking uses of time (Febrero and Schwartz, 1995). According to neoclassical theory, utility maximization made by households has the following utility function:
U = U(y1, y2, …, yn) (2.1.1) where y represents the n number of goods purchased on the market. Thus, the total utility depends on the total goods purchased. Nevertheless, the utility function is subject to a re-source constraint:
∑pi yi= I = W + V I = W(L)+V (2.1.2) where pi represent the goods prices, I the money income, W the earnings from labour, and V other income. The systematic incorporation of non-working time here will generate in departure. The households combine market goods and time by the use of the production functions and they decide upon the best combination of commodities in order to maximize their utility. Moreover, the total consumption price is the summation of direct and indirect prices. The equilibrium condition is reached as the utility function is maximized in respect to the resource constraint. This condition is met as:
Ui = ∂U/∂Zi = λπi i = 1,…m (2.1.3) where λ represents the marginal utility of money income. Becker (1965) defines maximum money income available as full income and it could be attained by allocating all time and other resources of the household in relation to the earning income. However, in this as-sumption, he does not make any regard for consumption. Nevertheless, he continues argu-ing that all time would not be spent at work since sleep and leisure is needed in order to reach efficiency and thus to maximise money income.
A fundamental assumption is that households are both consumers and producers. The households produce goods by mixing time and inputs of goods in relation to cost-minimisation rules set out accordingly to neoclassical theory of the firm. The quantities of goods produced will be determined by maximizing the good’s utility function subject to the resources constraint and the prices. The resources are measured by full income, which con-sists of the summation of money income and that lost by goods and the use of time to ob-tain utility. At the same time, goods’ prices are measured by the summation of costs of goods and time inputs.
An additional assumption is that the amount spent will be decided only on the effect on in-come and therefore not by any effect on the utility. Becker (1965) provides an example of this where free persons living in a poor environment may be forced to maximize their money income in order to survive. On the other hand, households in richer countries are willing to give up some part of their money income with the intention of obtaining addi-tional utility. Hence, the households exchange their money income to obtain a larger amount of psychic income. Becker (1965) provides examples of this where, for instance, the households may increase their leisure time or where they choose to employ unproduc-tive nephews.
The money income sacrificed under these conditions measures the cost of achieving addi-tional utility. Hence, the full income approach offers a significant resource constraint where time and goods may be combined into a sole overall constraint. This holds true since time can be transformed into goods through money income. Moreover, this approach also
in-cludes a unified behaviour of all substitutions of non-pecuniary for pecuniary income, irre-spectively of their nature or if they occur in the household or on the job. Becker (1965) ar-gues that a rise in earnings, holding full income constant by a decrease in other income, will bring about a decrease in the amount of time used on consumption. The reason for this is that time has now become more expensive (Becker, 1965).
2.3 The Insurance Approach
The basic insurance model states that there exist two possible outcomes as an individual faces an uncertain situation. The first is “go to work” and the other is to “be absent”. As-sumptions in the model are that individuals maximize their utility and the probability of ab-sence might be controlled by the insured. For instance, the employee can try to avoid infec-tions or try to eat healthy food. Moreover, full compensation is the optimal solution in this model. However, the optimal insurance solution is difficult to reach in reality, since there are a number of factors influencing the insurance market.
Moral hazard6 and adverse selection are examples of factors affecting the insurance market. When the behaviour of the insured cannot be observed by the insurer, it implies problems. The insurer may require a certain level of effort. Nevertheless, it is up to the insured to de-cide the level of effort. The problem here is that the insurer cannot control the effort cho-sen by the insured. This asymmetric information brings about problems with moral hazard. Furthermore, when moral hazard is present, the welfare will be reduced compared to the optimal solution mentioned above. Adverse selection is a similar problem, caused by asymmetric information in relation to the insured’s inherent characteristics (Rikner, 2002).
2.4 Summary
Households maximize their utility subject to a resource constraint. They combine com-modities and time by the use of product functions and decide upon the best combination of commodities with the intention of maximize their utility. The theory of household choice defines how much time households will spend on leisure instead of working. A higher opportunity cost of leisure represents a higher wage rate and this result in an in-crease in the hours devoted on work and a dein-crease in leisure. Moreover, individual behav-iour is influenced by social norms and economic incentives when deciding to go to work or not.
The allocation of time can be applicable in all non-work activities, according to Becker (1965). In this model, Becker (1965) makes the assumption that the amount spent will be decided only on the effect on income and not by any effect on the utility. Furthermore, the model incorporates a unified behaviour of all substitutions of nonpecuniary for pecuniary income. According to the insurance approach, there are two possible outcomes, go to work or to be absent. In this model, the individuals maximize their utility and the optimal solu-tion is full compensasolu-tion. However, this solusolu-tion is difficult to reach in reality.
6 It is important to make a distinction between moral hazard and cheating. Moral hazard is present if an
indi-vidual decides not to go to work on Monday because he or she did not sleep well the day before. If, on the other hand, this person decides to visit Copenhagen and finance this trip by reporting sick, then it is cheat-ing (Swedenborg et al., 2003).
3
Ill-health and Social Insurance in Sweden
The chapter starts with examining the development of ill-health in Sweden. This is followed by a description of the Swedish social insurance system. Next, Swedish policy in relation to sick leave is presented and the chapter ends with a summary.
3.1 Behavioural Pattern of Ill-health
Long-term sickness, early retirement pensions, and rehabilitation constitute together an area of large interest in the society. Long-term sickness and early retirement pensions influ-ence and are influinflu-enced by the conditions in the labour market and they constitute a large economic burden on the public sector (Marklund, 1997). Together they represent funda-mental societal effects of ill-health. The loss of productivity and the total cost of sickness benefits influence the public economy significantly (Westerlund, 2005). The number of people on sick leave and early retirement pensions are mostly represented by the elderly persons. Especially, after an age of 55, the number of people on sick leave increases dra-matically (SOU 2004:2). Ill-health in relation to different age groups is demonstrated below, in figure 3-1.
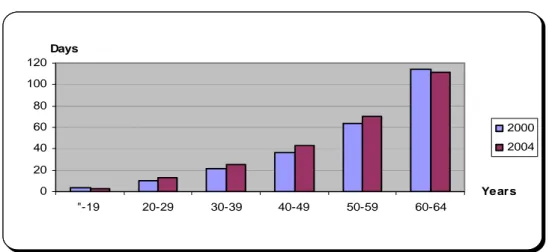
Figure 3-1 Ill-health in relation to age groups, 2000 and 2004
0 20 40 60 80 100 120 "-19 20-29 30-39 40-49 50-59 60-64 Years Days 2000 2004
Source: Social Insurance Office, 2005.
Figure 3-1 clearly indicates that the disbursements from the social insurance system in-creases as the individuals become older. The most striking differences between the years 2000 and 2004 are that ill-health in the age group 60-64 has decreased. This relationship holds true also for the individuals up to the age of 19 years. Nevertheless, the other age groups have increased during this period (Social Insurance Office, 2005).
Sweden has experienced significant changes in the labour market were the condition has changed from full employment to a situation with a high level of unemployment. In the beginning of the 1990s, the level of unemployment was only approximately one percent but in 1994 this figure increased to 13-14 percent. However, this period is followed by a re-covery in the labour market. Nevertheless, the employment level has not experienced any buoyant changes since there were 420. 000 less individuals employed in 1999 in compari-son to 1990. Significant economic and reorganization measures took place during the 1990s in both the private and the public sector. For instance, the organisations were trimmed, in-dicating that the number of employees was reduced. Moreover, the number of employees reporting having too much workload increased by 20 percent and the so called hectically
jobs increased. Thus, facing an increased rate of work, time pressure and more uncertain forms of employment became common situations to many workers (Eriksson, Starrin and Janson, 2003). The unemployment rates decreased at the end of the 1990s but long-term sick leave increased significantly (Westerlund, 2005).
Long-term sickness corresponds to both factors in the society as well as from the individ-ual reporting sick (Marklund 1997). Moreover, sick leave is dependent on the business cycle and the reasons tend to depend on different factors. The increased number of people on sick leave could depend on an increased level of employment that might generate in more persons staying home sick and thus receive sick pay. Other suggestions are defined as per-sons that earlier were unemployed today are listed as being sick, the increased level of em-ployment bring about persons with relatively worse health become a part of the work force, and the fear of becoming unemployed influence individuals attitude towards sick leave (SOU 2002:62).
Sick leave and early retirement pensions does not only tend to vary over time but signifi-cant differences has also been observed between age, sex, income, work places, employers, ethnicities, and geographical regions (SBU, 2003). Other risk categories that have been ob-served are occupations with low educational demands and earlier case records. Thus, high age, bad working conditions, and weak connections to the labour market are factors that significant increases the risk of long-term sickness (Marklund, 1997). The increase of peo-ple on sick leave has been especially large by females (Ds 2004:16). Figure 3-2 below, shows ill-health in relation to different sex during the year 2004.
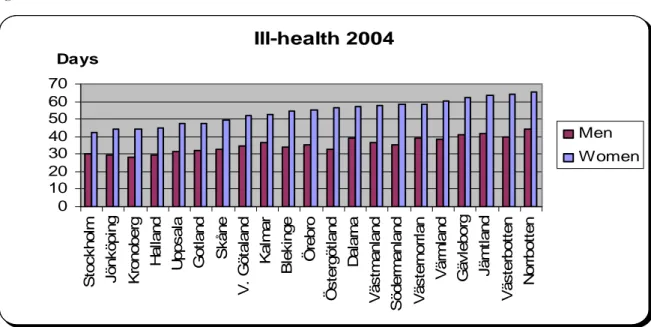
Figure 3-2 Ill-health between men and women
Ill-health 2004 0 10 20 30 40 50 60 70 S toc k h ol m J ö nk öp in g K ron ob er g Ha lla n d U p ps al a Go tl a n d Sk å n e V . G ö ta la n d Ka lm a r B lek in ge Ör e b ro Ös te rg ö tl a n d Da la rn a V ä s tm a nl an d S ö d e rm an la nd V ä s ter n o rr lan Vä rm la n d G ä v leb or g Jä m tl a n d V ä s te rb o tte n N o rrb o tt e n Days Men Women
Source: Social Insurance Office, 2005.
Women are more ill than men, according to the figure above7. This relationship holds true in all the counties and the county Kroneberg has the lowest level of ill-health while Norr-botten has the highest number of compensated days paid out from the social insurance
tem. The female difference between these two counties is 20.7 days and for men the differ-ence is equivalent to 15.7 days (Social Insurance Office, 2005).
The need to examine the economic driving forces is large, especially when considering the fact concerning Sweden’s future demographic challenge. That is, the individuals in the fu-ture need to provide for more individuals than the present individuals do today. This has to do with that the proportion between the numbers of individuals over an age of 65 years, in relation to individuals of a working age, are going to increase from around 30 percent to about 40 percent during the next three decades. Moreover, the number of individuals in an age between 16 and 64 that actively participate in the production has decreased during the last decade by approximately six percent. This is a result of an increased sick leave and a high level of unemployment in combination with a decrease of the gainfully employed population among the younger population. The effect from this will generate a reduction in the revenue from taxation and an increase in the costs, and thus a significant extra strain on the public finances (SOU 2004:2).
The development in Sweden shows that people tend to retire before they have reached a normal age of retirement. Instead of receiving a salary these individuals receive early re-tirement pensions or compensation from the Swedish sickness insurance (SOU 2000:121). The population is estimated to increase with roughly 1.7 millions within the next 50 years, where approximately half of this increase is represented by a population of an age of 65 years or older. Since the population of a working age (20-64 years) is expected to increase more or less with only 30 percent, the population that actively participate in the production will decrease in the future. There is only 29 percent of the gainfully employed population in present time that has an age over 64 years but in the year 2050, this figure is expected to be 45 percent. This means that for every old-age pensioner, there will be only 2.2 individuals capable of working in comparison with the currant number that is 3.4 individuals. Thus, the potential maintenance is expected to decrease with slightly more than a third over the next fifty years. This indicates that one of the most important questions in present time is how the welfare, and thus the ill-health, is expected to be handled as the number of elderly persons increases faster than those of an working age (SOU 2004:2).
The number of people on sick leave or early retirement pension has increased significantly during recent years. This implies large economic costs and in the long run, it might eventu-ally have consequences for how the welfare State will be shaped (SBU, 2003). Mental ill-health is one possible explanation to sick leave and it was not until 1997 that burnt out8 was
accepted as a reason to stay home due to illness (Eriksson, Starrin and Janson, 2003). The level of compensation influences ill-health. As one reduces the level of compensation, the numbers of compensated days are expected to decrease. However, the long run effects are more uncertain since the possibility to recover from illness could influence the individual’s future health (SOU 2002:62). Thus, generosity in the levels of compensation implies a too low excess and is one important factor explaining the increased number of people on sick leave (Swedenborg et al., 2003). Employment and sick leave have both dramatically in-creased in Sweden since 1997 and the level of compensation has been improved during this period (SOU 2002:62).
The differences in disposable income for every fifth individual that is unemployed, in rela-tion to the individuals that are employed, are less than 10 percent. A prolonged period of
unemployment generate for instance in a loss of competence. Moreover, hesitations from potential employers may occur and the individuals could experience a feeling of being iso-lated (SOU 2004:2). Total absence due to ill-health in 2001 corresponded to a sum of 800. 000 annual labour participation. Put differently, this figure keeps up a correspondence of 14 percent of the population of a working age (SOU 2002:5). Sick leave is unevenly dis-tributed between sex, place of work, and sectors. Hence, different places of work and working environments influence the pattern of sick leave (SOU 2000:72).
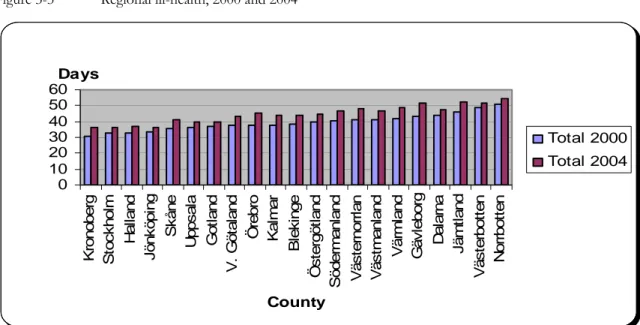
The total number of workers being absent due to illness was approximately 750. 000 in the year 2003. The public expenditure of sickness benefits has increased from 13.9 to 44.6 mil-liards between the years 1997 to 2003. The costs of sickness benefits and early retirement pensions increased from 37 to 58.5 milliards during the same period. Nevertheless, the total costs for the society are even higher since one has not considered the loss in production (Ds 2004:16). Ill-health decreased from 45 compensated days per individual to become 40 days per insured in 1996 (Marklund, 1997). In 2004, the national average of compensated days paid out from the social insurance was equal to 42.4 days per insured. Thus, there has been an increase of ill-health in comparison to 1996. Nevertheless, ill-health corresponded to a sum of only 37.8 days per individual in 2000. Figure 3-3, below, shows the regional de-velopment of ill-health in the years 2000 and 2004.
Figure 3-3 Regional ill-health, 2000 and 2004
0 10 20 30 40 50 60 K ro nober g S toc k hol m H a ll and J önk öpi ng S k åne U pps al a G o tl and V . G ö ta land Ö rebr o Ka lm a r B lek inge Ö s te rgöt land S öder m anl and V ä s ter nor rl an V ä s tm anl and V ä rm land G ä v lebor g Da la rn a J ä m tl and V ä s ter bo tt e n N o rrb o tt e n County Days Total 2000 Total 2004
Source: Social Insurance Office, 2005.
This figure illustrates that ill-health has increased in all Swedish counties and that the com-pensated days paid out from the social insurance system differ between different counties. Put differently, ill-health has increased with approximately 14 percent during this period. The increase in ill-health between the counties is displayed clearer in figure 3-4, below.
Figure 3-4 Increase in ill-health during the years 2000 and 2004 0 1 2 3 4 5 6 7 8 9 V ä s ter bot te n G ot la nd J ö nk öpi n g U pps a la N o rr b o tte n S toc k h ol m D al ar na H al la nd Ö s ter göt land K ronober g Vä s tm anl a nd Bl e k in g e Sk å n e V. G öt al and Sö d e rm anl a nd Jä m tla n d Ka lm ar V ä s ter nor rl an Ö rebr o Vä rm la n d G äv le bor g County Days Difference
Source: Social Insurance Office, 2005.
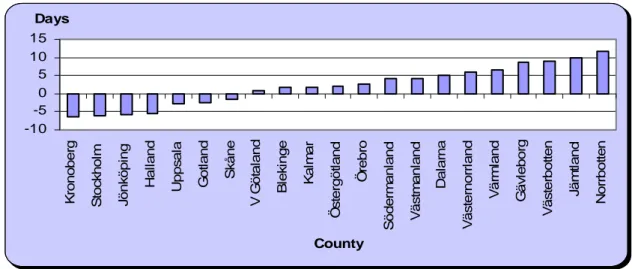
The figure above illustrates that the increase in ill-health are unevenly distributed among the counties. For instance, the county Gävleborg has experienced the highest increase in ill-health whereas the county Västerbotten has the lowest increase of ill-ill-health. The difference between these two counties is 5.3 days. In figure 3-5, below, regional differences from the national average during the year 2004 are illustrated9.
Figure 3-5 Regional deviations from the national average, 2004
-10 -5 0 5 10 15 K rono berg S to ckh o lm J önk öpi ng Ha ll a n d Up p s a la Go tl a n d Sk å n e V G ö ta la n d Bl e k in g e Ka lm a r Ö s te rg öt la nd Ö rebro S öde rm an la nd V ä s tm a nl an d Da la rn a V ä s ternorrl an d Vä rm la n d G ä v le borg V ä s terbot te n Jä m tl a n d N o rrbot te n County Days
Source: Social Insurance Office, 2005.
As the figure shows, ill-health differs between the counties and the deviations from the na-tional average vary significantly between the counties. Moreover, the number of compen-sated days paid out form the social insurance is higher in the northern part of Sweden and the county Norrbotten has the highest deviation from the national average (Social Insur-ance Office, 2005).
3.2 Social
Insurance
The Swedish sickness insurance system is mostly a social insurance. However, during the first two weeks in a sickness episode the employers have to pay the compensation (Rikner, 2002). The sickness insurance system is publicly administrated and is since 1955 a compul-sory insurance in Sweden (Johansson, 2003). Moreover, the sickness insurance is an impor-tant and integrated part of the Swedish welfare system (SOU 2000:72). Until the end of 1991, the social insurance system paid out all compensation. In the early 1990s, a change was made and between 1992 and 1996, the employer had to pay full compensation during the first 14 days of a sickness period (Andrén, 2001). This obligation increased to 28 days between 1997 and 1998 and during this period, the level of compensation decreased (SOU 2000:72). In April 1998, the employer’s obligation once again became 14 days (Andrén, 2001). Administration of the social insurance is governed by different social insurance of-fices, which have the responsibility to co-ordinate rehabilitation measures (SBU, 2003). Moreover, the increased costs of sickness insurance in Sweden during resent years indicate problems with ill-health (SOU 2000:72). The word illness is not defined in the law govern-ing public insurance. An expansion of the phrase illness has taken place durgovern-ing recent years where, for instance, states of sorrow and tiredness can grant right to sickness benefit (SOU 2000:72). During the years 1980 through 2000, the total transfer via the social insurance system corresponded to approximately 15-21 percent of the gross national product (Andrén, 2001).
The purpose with the social insurance system is to provide financial security in case of ill-ness or handicap to elderly, families, and children by reallocate funds between the individu-als in the society. The insurance system embraces every resident in Sweden and is financed partly or entirely by revenues from social security charges collected from the self-employed and from the employers along with special and general pension charges (Andrén, 2001). There are several factors influencing the development of number of people receiving com-pensation from the social insurance (Ds 2000:39). The social insurance sectors are defined as sickness insurance, the national basic pension, partial pension, survivor’s pension, and work injury insurance. There exist some social insurance benefits that are entirely financed by central government funds, such as housing allowance, child allowance, housing supple-ment for pensioners, different benefits for the disabled10, and some other allowances for families with children. Attendance allowance is another benefit but is to some extent fi-nanced by the municipalities. Voluntary sickness insurance, voluntary pensions, small busi-ness insurance, voluntary occupational health insurance, and seaman’s pensions are smaller public insurance plans that are financed from the yield of funds or/and by premiums (Andrén, 2001).
The social insurance system has experienced sweeping changes during the 1990s. For in-stance, one of the most important is the increased restrictions generating in decreased lev-els of compensation in relation to the income in the sickness insurance and the retirement annuity. Thus, the basic amount was decreased during the 1990s and this influenced the levels of compensation. Moreover, in 1992 there was an introduction of a period where the employer was obligated to pay compensation during the first two weeks that their employ-ees reporting sick. Also the introduction of a qualifying day in 1993 is another important change. There has also been a gradual increased restrictively in the application of the social insurance between 1985 and 1996 where, for instance, stricter rules has been applied in
der to receive early retirement pension. The compensation level was decreased in 1996 to reach a general level of 75 percent during the whole period of illness. In addition, there has been an increase of the partial compensation in forms of three-quarter and one-quarter of sickness insurance and early retirement pensions. Compensation paid out between 1988 and 1996 decreased significantly and the disbursements from the social insurance system were in fact halved during this time. This is mostly explained from changes in the rules, but could also be explained from an increased unemployment (Marklund, 1997).
3.3 Governmental Policy towards Sick Leave
There have been two major topics in the discussion relating to Swedish policy reflecting sick leave, and the first suggests that generous sickness benefits could bring about higher rates of absenteeism. The other argument has taken the working condition aspect view. This perspective will hopefully reduce absenteeism. Both the arguments indicate that a worker’s choice between absence and attendance is influenced by the compensation they may receive from the two alternatives. However, the idea about worker absenteeism could be reduced by striving for more pleasant working conditions or by lower sickness benefits. However, these hypotheses are highly controversial (Holmlund, 1991). There are two prob-lems politicians need to take into consideration when developing the sickness insurance. The first is adverse selection and the government has solved this by creating a compulsory insurance that is publicly administrated. The other problem deals with moral hazard and this can only be solved with control and excess. These actions are necessary in order to have a durable insurance system. An increased excess prevents moral hazard but provides a worsened protection for the insured. In short, the government constantly observes the rules and takes actions in order to reduce the different problems that appear (Swedenborg et al., 2003).
The government presented in 2002 a program that focused on an improved health of the work force. An important part of this program was to introduce a system generating stronger economic forces from the employers´ perspective to reduce and prevent ill-health (Ds 2004:16). From the first of July 2003, the government came to a decision of increased responsibility towards the employers, meaning that they had to pay the whole cost of ab-sence due to illness during the first three weeks that their employees reporting sick. Until this point in time, the employers only have had a responsibility during the first two weeks (Regeringen, 2003). Thus, an increased responsibility was put on the employer to share the cost of sick leave (Ds 2004:16). From the first of January 2005, the employers have to pay 15 percent of the costs of sick leave in cases that last longer than two weeks. At the same time, the employer is only responsible to pay compensation for the first two weeks. Hence, this policy does not contribute to any increased costs on the employer (Ds 2004:16). More-over, the government decided in 2003 to take appropriate actions in order to decrease the Swedish ill-health. Therefore the government decided that the compensated days paid out from the sickness insurance system should be halved until 2008 (Regeringen). More pre-cisely, the total disbursed days shall not go beyond 56.5 millions (Konjunkturinstitutet). Investigations suggests that the huge costs of sick leave in Sweden tends to depend on the business cycle, the working environment, lack of economic incentives from the employers and the individuals, the demographic change, and an insufficient administration of sickness insurance. An investigation (the AHA-investigation, SOU 2002:62) confirms that all these factors have had significantly impacts on sick leave in some way or another. However, no single factor can be said to have any decisive influence on sick leave. Thus, earlier research cannot confirm any unambiguous conclusion to the reasons of sick leave (Ds 2004:16). The
investigation concludes that the working environment and the individuals’ physical health have been worsened during recent years (Regeringen). Stronger economic forces towards the employers are needed in order to make them strive for a reduction of the number of people on sick leave (Ds 2004:16). Here rehabilitation is a key word since it can contribute to a decreased sickness period and a reduced risk of invalidity or early retirement pension. However, the conditions determining how the process of sickness develops and how suc-cessful vocational rehabilitation will turn out to be constitutes a complex pattern. To re-duce the risk of disability pension and to shorten the spells of illness are fundamental goals of vocational rehabilitation in Sweden (Marklund, 1997). To favour part-time sick leave rather than full-time sick leave and try to improve the working conditions are other impor-tant policies that hopefully will reduce sick leave (Ds 2004:16).
3.4 Summary
Ill-health produces fundamental societal effects and represents a large economic burden on the public sector. Investigations suggest that the huge costs of sick leave tends to depend on work environment, business cycle, lack of economic incentives, demographic change, and insufficient administration of the sickness insurance. However, no single factor can be said to have any fundamental influence on sick leave. Significant differences have been ob-served between, for instance, age, sex, income, work places, and geographical regions. Swe-den faces a future demographic challenge since the population of a working age will de-crease in the future. The Swedish sickness insurance is mostly a social insurance and the generosity in the levels of compensation tends to influence the behavioural pattern of ill-health. The disbursements form the social insurance system increased with approximately 14 percent between the years 2000 and 2004. The government have tried different policies in order to reduce the Swedish ill-health and decided in 2003 that the compensated days paid out from the social insurance should be halved until 2008.
4
Empirical Analysis of Ill-health in Sweden
This chapter examines if there is empirical support for the theories presented in chapter two. The chapter in-cludes an analysis of the Swedish ill-health, which interprets and compares the empirical findings.
4.1 Presentation of Data
According to neoclassic theory, households maximize their utility subject to a resource constraint. The total utility depends on the total goods purchased. The theory of household choice defines how much time households will spend on leisure rather than work. As a per-son starts to work, the income starts to increase since the individual exchange hours into income in accordance with the time-budget line. Moreover, the hourly wage rate scarified is the opportunity cost of an hour of leisure. Therefore, a higher opportunity cost of leisure represents a higher wage rate and this brings about an increase in the hours devoted on work and a decrease in leisure. Becker (1965) defines a model where the allocation of time can be applicable in all non-work activities He defines maximum money income available as full income and it could be attained by allocating all time and other resources of the household in relation to the income. From the theories above, the following model will be estimated:
IHi = β0 + β1unempi + β2incomei + β3companyi + β4norrbotten/Dnorra +
βgender + age + ε ( 4.1.1)
where i denotes LA-region i or municipality i.β0 is a constant and represents the intercept and ε is an error term. Theβ-values show the slope coefficient of the respectively inde-pendent variables. The equation above states that ill-health (IH), is a function of unem-ployment, income, company size, gender and age. Dummy variables called Norrbotten and Dnorth are also included in the model. Unemployment is expected to have positive effect on ill-health and income is expected to have a negative relationship with ill-health. Larger companies are expected to influence ill-health in a positive way. Put differently, the larger companies are likely to have more ill-health than the smaller companies. Consequently, the smaller companies are supposed to have a negative relationship with ill-health. The dummy variables are likely to have a positive relationship to ill-health. Females are supposed to have a higher number of ill-health than males and as the individuals becomes older, the number of compensated days paid out from the social insurance system is presumed to in-crease.
The information of ill-health was received from the social insurance office in Jönköping (Social Insurance Office, 2005). The municipalities in Sweden have also been grouped into 81 LA-regions, according to the classification made by NUTEK. A LA-region is referred to as a functional region and is short for local labour market. Moreover, LA-regions are based on commuting patterns (Statistics Sweden). The reason for dividing the municipalities into LA-regions is because earlier studies suggest that sick leave is correlated with the business cycle and thus the labour market. The author of this paper has decided to investigate the development of ill-health during the specific years 2000 and 2004. The reason for choosing these years originates in that the statistical material of ill-health divided on municipality level was first introduced in 2000. Moreover, since the purpose with this paper is to exam-ine the regional development of ill-health in Sweden and to analyse factors that tend to
in-fluence the ill-health, it was natural to compare the year 2000 and 2004. However, not sur-prisingly, the models have problems with heteroscedasticity11. Therefore dummy variables will be included in the models and the municipalities will be divided into LA-regions. The dependent variable, ill-health, and the independent variables are presented below, in table 4-1.
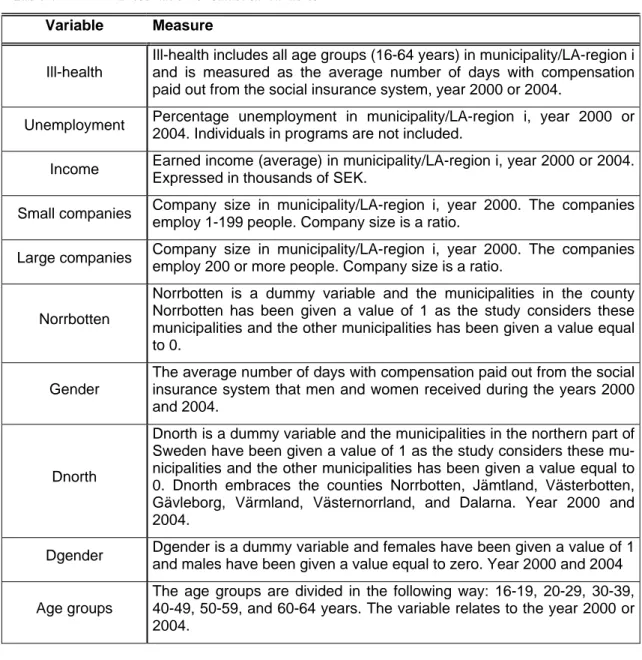
Table 4-1 Presentation of statistical variables
Variable Measure
Ill-health
Ill-health includes all age groups (16-64 years) in municipality/LA-region i and is measured as the average number of days with compensation paid out from the social insurance system, year 2000 or 2004.
Unemployment Percentage unemployment in municipality/LA-region i, year 2000 or
2004. Individuals in programs are not included.
Income Earned income (average) in municipality/LA-region i, year 2000 or 2004.
Expressed in thousands of SEK.
Small companies Company size in municipality/LA-region i, year 2000. The companies
employ 1-199 people. Company size is a ratio.
Large companies Company size in municipality/LA-region i, year 2000. The companies
employ 200 or more people. Company size is a ratio.
Norrbotten
Norrbotten is a dummy variable and the municipalities in the county Norrbotten has been given a value of 1 as the study considers these municipalities and the other municipalities has been given a value equal to 0.
Gender
The average number of days with compensation paid out from the social insurance system that men and women received during the years 2000 and 2004.
Dnorth
Dnorth is a dummy variable and the municipalities in the northern part of Sweden have been given a value of 1 as the study considers these mu-nicipalities and the other mumu-nicipalities has been given a value equal to 0. Dnorth embraces the counties Norrbotten, Jämtland, Västerbotten, Gävleborg, Värmland, Västernorrland, and Dalarna. Year 2000 and 2004.
Dgender Dgender is a dummy variable and females have been given a value of 1
and males have been given a value equal to zero. Year 2000 and 2004
Age groups
The age groups are divided in the following way: 16-19, 20-29, 30-39, 40-49, 50-59, and 60-64 years. The variable relates to the year 2000 or 2004.
This table illustrates the statistical variables that will be used in estimating different kinds of models. All the variables relate to the specific years 2000 and 2004, except for the variable income 2003, which relates to the year 200312. The independent variables are
11 White’s general heteroscedasticity test confirms that the nullhypothisis of no heteroscedasticity can be
re-jected in all models since the observed chi-square values are higher than the critical chi-square values. Thus, one can believe in the alternative hypothesis that heteroscedasticity is present in the models.
12 The reason for not use the level of income for the year 2004 when writing this paper is that this statistics
will not be availably until the beginning of 2006, since it is based on the income-tax return that the Swedish residents just have handed in to the tax authority.
ment, average income, company size, gender, and age. Moreover, dummy variables named Norrbotten and Dnorra will also be included in the models in order to examine if the mu-nicipalities in the northern part tend to have more ill-health than the other mumu-nicipalities. A statistical summary of the variables has been made and are presented in appendix 2. The statistical material has been divided into four separately correlation matrixes. This helps the reader to distinguish between the two different years and hence, the different types of models. The correlation matrixes are presented in appendix 2.
The variables have also been transformed using a natural logarithm in order to receive elas-ticities for these variables. In these models, two more independent variables have been added and they will examine if there are any differences in ill-health between men and women and between different age groups. In these models, the dependent variable is gen-der.
4.2 Empirical Findings and Analysis
In order to examine factors influencing ill-health, different cross section regressions have been made. The division into LA-regions showed no interesting results since the income variable was insignificant in the models relating to the year 200013. However, unemploy-ment showed a positive relationship with ill-health and had a one-percentage level of sig-nificance.
In order to examine if unemployment, income, company size, gender, and age influence the behavioural pattern of ill-health in the municipalities, other models have been estimated. They have been tested with the help of linear regression. Also, dummy variables have been included in the models with the intention of examining if the northern part of Sweden tends to have a higher rate of ill-health compared to the remaining part of Sweden. The null hypothesis of the estimations states that there is no relationship between ill-health and the independent variables. The alternative hypothesis claims that the pattern of ill-health can be explained by the independent variables, or at least one of them can explain changes in ill-health.
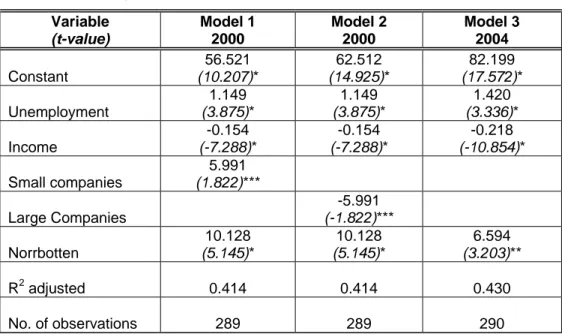
Model 1 and 2 refers to the year 2000 and study if unemployment, income, and company size influence the pattern of ill-health. The third model investigates if ill-health can be ex-plained by the level of unemployment and income during the year 2004. The results of the estimations are presented below, in table 4-2.
Table 4-2 Regression results Variable (t-value) Model 1 2000 Model 2 2000 Model 3 2004 Constant 56.521 (10.207)* 62.512 (14.925)* 82.199 (17.572)* Unemployment 1.149 (3.875)* 1.149 (3.875)* 1.420 (3.336)* Income -0.154 (-7.288)* -0.154 (-7.288)* -0.218 (-10.854)* Small companies 5.991 (1.822)*** Large Companies -5.991 (-1.822)*** Norrbotten 10.128 (5.145)* 10.128 (5.145)* 6.594 (3.203)** R2 adjusted 0.414 0.414 0.430 No. of observations 289 289 290
* significant on a 1-percentage level ** significant on a 5-percentage level *** significant on a 10-percentage level
The independent variables, unemployment, income, small companies, and the dummy vari-able Norrbotten, are all significant but at different levels of significance, in the first model estimated. An evaluation of this model points out that employment is positive correlated with ill-health. This positive relation to ill-health is also true for the variable small compa-nies. However, income is negatively related to ill-health and the models adjusted R2 is 0.414. The next model includes the same variables as this model, with the exception of the variable small companies that has been replaced with large companies.
Model 2 also signifies a positive relationship between ill-health and unemployment and the same is true for the Norrbotten effect. However, both income and large companies show a negative relationship to ill-health. Moreover, all the variables are significant on a 1-percentage level except for large companies, which is significant on a 10-1-percentage level. The value of the adjusted R2 is 0.414. The last model estimated refers to the year 2004. Like the previous models, the null hypothesis can be rejected also in this model and hence, one can believe in the alternative hypothesis. Unemployment is once again positively corre-lated with ill-health and the same holds true for the dummy variable Norrbotten. Further-more, the model signifies a negative relationship between income and ill-health and the ad-justed R2 is 0.430. This model, unlike model 1 and 2, contains one more municipality14. Model 3 has a higher adjusted R2 value, although not much, when comparing it to the other models. Since this model has one less independent variable, it is likely to assume that the variables unemployment and income have become more important explaining the devel-opment of ill-health.
The reader should keep in mind that model 1 and 2 contain one more independent vari-able. Additionally, the reader should also bear in mind the changes in rules governing the
employers’ responsibility. There is no systematic registration of data since in 2000, the em-ployers had an obligation to pay the entire cost of absence due to illness during the first 14 days but in 2004, this obligation increased to 21 days. Nevertheless, the empirical findings show unambiguous results. Unemployment increases as ill-health increases and the income level decreases as ill-health increases.
The relationship between ill-health and unemployment are significant on a one-percentage level in all three models and this indicates that the relationship is reliable. The findings point out that the employees’ health becomes worsened when more people become unem-ployed. One possible explanation for this relationship could be that people become sicker due to a more uncertain labour market. Hence, people become more insecure and therefore become sicker. However, the reader should keep in mind that individuals cannot be traced with the data used in this paper, and therefore the interpretation must be made with cau-tion. Thus, the given reasons are only suggestions.
The level of income is also significant on a one-percentage level in all three models. There-fore the empirical findings between income and ill-health could be relied upon. The results points out a negative relationship and hence, the level of income decreases as ill-health in-creases. It seems logical to argue that the level of income follows the level of educational attainment, which in turn influences the types of vacant jobs. Consequently, people with a higher level of income tend to be less ill than people with a lower level of income. Thus, an increase in income makes the alternative cost to increase and the incentives to stay home due to illness thereby decreases. This is in accordance with the theory of household choice. Another factor that tends to influence ill-health is the size of the companies. People em-ployed in small companies are positively correlated with ill-health while people emem-ployed in large companies have a negative relationship with ill-health. This is an interesting result since the author expected to find the opposite relationship between company size and ill-health. Nevertheless, these findings should be interpreted with caution since the findings is significant only on a level equal to 10 percent. The reason to why people employed in small companies tend to have a higher level of ill-health than people employed in large compa-nies, might be that of loyalty towards the employer as well as the employees. Put differ-ently, people employed in small companies may feel bad in reporting sick and therefore go to work even though they are sick. In the long run, this pattern of behaviour will bring about prolonged sickness.
The reason for include a dummy variable in the models is to examine if the municipalities in located in the northern part tend to more ill-health than the other municipalities. The dummy variable, Norrbotten, could be fully relied upon in the year 2000. However, the reader should keep in mind that the model relating to the year 2004 has a significance level equal to five percent. The regressions made signify a positive relationship between the Norrbotten effect and ill-health. An increase in ill-health generate in an increase in the county Norrbotten. Hence, the findings identify a regional difference in ill-health since the municipalities in the county Norrbotten has a higher level of ill-health in comparison to the other municipalities.
A suggestion for the Norrbotten effect might originates in that this county has relative small labour markets and a low occupation rate compared to the other counties. A small labour market brings about few options of different types of employment and hence, the risk of having an unsatisfactory employment is relatively large in these regions. Therefore one reason for the Norrbotten effect might originate from that people are unsatisfied with the labour market conditions and thus become sick-listed.
The empirical findings in this paper differ from earlier investigations. The differences seem to depend on how one has measured sick leave. For instance, Bergendorff et al. (2002) confirms a negative relationship between sick leave and unemployment when measure sick leave as being absent from work more than five days. The investigation made in this paper signifies a positive relationship between sick leave and unemployment, where sick leave mirrors the average compensated days paid out from the social insurance system. Thus, sick leave was measured as ill-health. The regression results from the transformed variables are presented in table 4-3, below15.
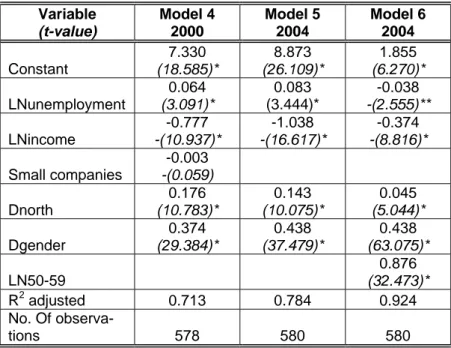
Table 4-3 Regression results, transformed
Variable (t-value) Model 4 2000 Model 5 2004 Model 6 2004 Constant 7.330 (18.585)* 8.873 (26.109)* 1.855 (6.270)* LNunemployment 0.064 (3.091)* 0.083 (3.444)* -0.038 -(2.555)** LNincome -0.777 -(10.937)* -1.038 -(16.617)* -0.374 -(8.816)* Small companies -0.003 -(0.059) Dnorth 0.176 (10.783)* 0.143 (10.075)* 0.045 (5.044)* Dgender 0.374 (29.384)* 0.438 (37.479)* 0.438 (63.075)* LN50-59 0.876 (32.473)* R2 adjusted 0.713 0.784 0.924 No. Of observa-tions 578 580 580
* significant on a 1-percentage level, ** significant on a 5-percentage level
The dependent variable in these models is gender and all the independent variables are sig-nificant except for the variable small companies. These models include a new dummy vari-able examining if the northern municipalities in Sweden tend to have a higher level of ill-health than the other municipalities. Moreover, gender and age are included in these mod-els. Like the previous models, these models also signify a positive relationship between un-employment and ill-health and a negative relationship between income and ill-health. How-ever, unemployment is negative correlated with ill-health in model six. This was discovered when adding the age group 50-59 years and this relationship also holds true when adding the age group 60-64 years. The number of observations, municipalities, has been doubled in models 4-6 in order to examine if there is any difference in ill-health between men and women. The variables measuring company size have not been included in these models since the empirical findings turned out to be insignificant.
Model four relates to the year 2000 and the independent variable measuring company size is insignificant in this model. However, the other variables are significant where the dummy variable, Dnorth, confirms that ill-health is higher in the northern part of Sweden. More-over, females tend to be more ill than males and the model’s adjusted R2 is 0.713.
15 The regression results when including the different age groups are to be found in appendix 2, in tables
Model five and six represent the year 2004 and similar to model four, these models also confirm that the northern municipalities have a higher number of ill-health than the other municipalities. Furthermore, the models also signify that women are more ill than men and model five’s adjusted R2 is 0.784. The empirical findings that age can explain ill-health is in
line with previous investigations. In model six, a variable measuring the age group 50-59 years has been included and this made the adjusted R2 to increase to 0.924. Interesting is
that this made the relationship between unemployment and ill-health to become negative. This relationship is also true if one includes the age group 60-64 years and the interpreta-tion of this is that as the unemployment level decreases, the number of compensated days paid out from the social insurance system increases. One possible explanation might be given from the fact that as people become older, the risk of receiving an early retirement pension increases. This generate in that the labour market conditions are not that impor-tant as it is when the individuals are younger.
The models adjusted R2 values increases as one includes a higher age group. However, this is not true for the last age group, 60-64 years, since this age group makes the adjusted R2 value to decrease when comparing it to the previous age group. One logical reason to this originates in that when including the age group 60-64 years, some independent variables becomes insignificant. Another reason could depend on that the other age groups em-braces ten years but the age group 60-64 years only makes references to 5 years. In the models making references to the specific year 2004, one discovers a clear pattern between the income level and the different age groups. As the individuals become older, the income level becomes more important. Put differently, people tend to care more about the level of compensation that they might receive from the social insurance as they become older. A suggested reason to this relationship could be that people tend to earn more money as they become older. Consequently, the level of compensation become more important since the loss in income becomes larger as the wage rate increases. As individuals become ill the in-come level decreases and less time will be devoted on work. The social security net makes the level of income to increase and this makes it possible for the individuals to reach the original indifference curve. This is in accordance with the theory of utility maximization and the theory of household choice.
The age group 16-19 years is insignificant in all models. However, the empirical findings when adding the other age groups confirm that ill-health increases as the individuals be-come older. Nevertheless, in the models referring to the year 2000, this is only true for in-dividuals in an age between 20 and 59 years since the age group 60-64 decreases, although not much. These findings are similar to earlier studies, which confirm that age is one factor that can explain the development of sick leave.
The dummy variable, Dnorth, is positive correlated with ill-health and this signifies that the municipalities in the northern part have a higher number of ill-health when comparing them to the other municipalities. Nevertheless, the reader should observe that this relation-ship was clearer in the year 2000. This can be a sign of a catch-up effect, where ill-health in the other municipalities has started to catch up with the municipalities in the northern part. Like the suggested reason for the Norrbotten effect, one reason for an increased number of compensated days paid out form the social insurance system in the northern municipali-ties originate from that people are unsatisfied with the labour market conditions and thus become sick-listed.
The dummy variable examining if there is any difference in compensated days paid out from the social insurance system between women and men signifies that women are more ill than men. When comparing the two years, one discover that the difference between
women and men have become more significant in the year 2004. Earlier investigations ver-ify that women tend to be more ill than men and this relationship is in line with the empiri-cal findings in this paper. From the statistiempiri-cal data used in this paper one cannot trace indi-viduals and their work places but one reason to why women tend to be more ill than men could be that women have a more demanding work than men.