J
Ö N K Ö P I N GI
N T E R N A T I O N A LB
U S I N E S SS
C H O O LJÖNKÖPING UNIVERSITY
Va l u e St r e a m M a p p i n g f o r
Wa s t e R e d u c t i o n i n P l a y i n g
S y s t e m C o m p o n e n ts F l o w
Case study: Leaning the Value Stream of Origo family components at
HAGS Aneby AB
Master Thesis within International Logistics and Supply Chain Management
Author: Belova, Inesa Martinkute Zhu, Yansong
Tutor: Hultman, Jens Jönköping January 2008
Acknowledgement
We would like to thank our tutor Jens Hultman for his support and guidelines during our work on the thesis.
We are grateful to the personnel of HAGS Aneby AB for the time taken out from their busy schedule and for valuable information:
Thomas Berfenfeldt, Torbjörn Miller, Peter Heim, Conny Hult, Ola Svenssohn, Regina Berg, Tommy Källberg, Bernt Enell, Per-Olof Löfkvist, Henrik Röste and Niklas Bergander.
We would like to thank all the other companies and the personnel for providing information valuable for the thesis.
We would like to thank Mikael Thulin, JTH, for his practical advice.
January 2008, Jönköping
Master Thesis in International Logistics and Supply Chain Management
Title: Value Stream Mapping for Waste Reduction in Playing System Com-ponents Flow: Leaning the Value Stream of Origo family comCom-ponents at HAGS Aneby AB
Authors: Belova, Inesa M. & Zhu, Yansong Tutor: Hultman, Jens
Date: January 2008
Keywords: Lean thinking, Value Stream Mapping, Wastes
Abstract
Introduction. Improvement of the product flow by means of applying the lean principles, including the value stream mapping tool has become an important component in the at-tempt of many companies to make transition from traditional production to the lean manu-facturing system. It often implies modernization of organizational structure, relationships with sub-contractors, suppliers and transportation companies. The topic of this master the-sis originates from company HAGS Aneby AB that produces playing systems comprising different components. This report is an attempt to understand and analyze the problems in the product flow on the example of playing system Agito that includes Origo product fam-ily components as the main constructive part.
Purpose. The purpose of this case study has been to identify, analyze and propose solu-tions for waste-related problems in the Origo product flow, by applying the lean thinking principles and the data collection methods.
Method. The proposed case study methodology combines both theoretical and empirical approach. Data collected in interviews with sub-contractors and suppliers, and observa-tions at the mechanical workshop and warehouse, have constituted the input for the value stream mapping method. The value stream mapping method has been applied to construct the current state map of the Origo value stream and identify the wastes. Furthermore, other methods including the decision point analysis, the postponement theory, and the supplier/buyer dependence grid have been subsequently applied to analyze the company relationships with key business partners and assist in designing a draft of the future state map.
Conclusion. It has been concluded from the constructed current state map of Origo value stream that the most critical wastes are waiting, transportation, unnecessary inventory, un-necessary motion and defects. Furthermore, the requirement of minimum quantity of raw material to be purchased from the supplier and the improper workshop layout has been recognized as the main reasons for the wastes. The measures to reduce the identified wastes have been pointed out. It has been proposed to better integrate the key actors into the HAGS supply chain. Adopting the cellular layout in the mechanical workshop has been found beneficial as well as orientation of production on customer orders rather than on forecasting. The mentioned measures to reduce wastes have been summarized in the draft of the future state map. The main advantages of the proposed future state are faster order fulfillment process, gained visibility and control of raw material and reduced costs in the flow of Origo components.
List of abbreviations
VSM: Value Stream Mapping SCM: Supply Chain Management TPS: Toyota Production System FIFO: First In First Out
5S: Sort, Set in Order, Shine, Standardize, Sustain MRP: Materials Requirements Planning
MRP II: Manufacturing Resources Planning ToW: Table of Waste
CSM: Current State Map FSM: Future State Map
EOQ: Economic Order Quantity JIT: Just in Time
TQC: Total Quality Control WIP: Work in Process C/T: Cycle Time L/T: Lead Time
Table of Contents
1 INTRODUCTION... 8 1.1 BACKGROUND... 8 1.2 SPECIFICATION OF PROBLEM... 9 1.3 PURPOSE... 9 1.4 RESEARCH QUESTIONS... 10 1.5 DELIMITATION... 10 1.6 DISPOSITION OF THESIS... 10 2 FRAME OF REFERENCE ... 112.1 FROM MASS PRODUCTION TO LEAN PRODUCTION... 11
2.2 LEAN THINKING... 12
2.2.1 Application of lean thinking to business processes ... 15
2.3 LEAN PRINCIPLE -SPECIFY VALUE... 17
2.4 LEAN PRINCIPLE -IDENTIFY THE VALUE STREAM... 19
2.5 LEAN PRINCIPLE -MAKE VALUE FLOW... 20
2.5.1 Value Stream Mapping... 21
2.5.2 The three types of activity ... 24
2.5.3 Wastes ... 24
2.5.4 Additional Value Stream Mapping tools ... 27
2.6 LEAN PRINCIPLE -PULL SCHEDULING... 29
2.7 LEAN PRINCIPLE -SEEK PERFECTION... 30
2.8 POSTPONEMENT... 30
2.9 POSITIONING AN ORGANIZATION IN TERMS OF SUPPLIER RELATIONS... 32
2.10 SUMMARY OF THE THEORETICAL BACKGROUND... 34
3 METHODOLOGY... 36 3.1 INDUCTION VS.DEDUCTION... 36 3.2 CASE STUDY... 36 3.3 DATA COLLECTION... 39 3.3.1 Interviews... 39 3.3.2 Observations ... 42 3.3.3 Secondary data... 42 3.4 TRUSTWORTHINESS... 43 3.4.1 Validity... 43 3.4.2 Reliability... 43 4 EMPIRICAL STUDIES ... 45
4.1 THE DEVELOPMENT OF HAGS ANEBY AB... 45
4.2 PRESENT-DAY HAGS ... 46
4.2.1 Products of HAGS... 48
4.2.2 Introduction of the product family ... 49
4.3 THE VALUE SUPPLY CHAIN OF ORIGO AT HAGS... 49
4.3.1 Supplier X ... 49
4.3.2 HAGS mechanical workshop ... 50
4.3.3 QPC ... 50
4.3.4 LTN ... 51
4.3.5 Outbound Logistics Companies ... 51
4.3.6 Customer ... 52
4.4 ORDER FULFILLMENT PROCESS... 52
5 ANALYSIS... 56
5.1 SPECIFY VALUE... 56
5.2 IDENTIFY THE VALUE STREAM... 56
5.3 MAKE VALUE FLOW (I): ANALYSIS OF THE CURRENT STATE MAP... 59
5.4 IDENTIFICATION AND ANALYSIS OF WASTES IN THE FLOW OF ORIGO... 62
5.4.2 Transportation ... 64
5.4.3 Unnecessary Inventory... 65
5.4.4 Unnecessary Movement ... 66
5.4.5 Defects ... 68
5.5 FURTHER ANALYSIS OF THE CURRENT STATE MAP... 69
5.5.1 Postponement and Decision Point Analysis... 69
5.5.2 HAGS positioning in terms of relationship ... 71
5.6 MAKE VALUE FLOW (II):SOLUTIONS TO REDUCE THE WASTES AND THEIR INFLUENCE... 73
5.6.1 Waiting... 73
5.6.2 Transportation ... 75
5.6.3 Unnecessary Inventory... 75
5.6.4 Unnecessary Motion ... 76
5.6.5 Defects ... 77
5.7 DRAFT OF FUTURE STATE MAP... 78
5.7.1 Summary of changes introduced in the future state value stream... 80
5.7.2 The benefits of the new components flow ... 81
6 CONCLUSIONS... 82
6.1 METHODOLOGICAL IMPLICATION... 82
6.2 THEORETICAL CONCLUSIONS... 83
6.3 MANAGERIAL IMPLICATION... 83
REFERENCES ... 85
APPENDIX 1 – HAGS MANUFACTURING FACILITIES AND HEAD OFFICE IN ANEBY... 89
APPENDIX 2 – INTERVIEW GUIDE ... 90
APPENDIX 3 – INTERVIEW QUESTIONS ... 91
APPENDIX 4 - ICONS... 94
APPENDIX 5 – CURRENT STATE MAP PROCESS I - THE FLOW OF STEEL PIPES OF ORIGO COMPONENTS ... 95
APPENDIX 6 – CURRENT STATE MAP PROCESS II - THE FLOW OF THE RINGS OF ORIGO COMPONENTS ... 96
APPENDIX 7 – CURRENT STATE MAP PROCESS III - THE FLOW OF PIPE-BOWS AND COUPLING-BOW OF ORIGO COMPONENTS ... 97
APPENDIX 8 – TABLE OF WASTE (TOW) ... 98
APPENDIX 9 - HAGS AGITO PLAYING SYSTEMS ... 99
LIST OF FIGURES
FIGURE 2-1THE ESSENTIALS OF LEAN MANUFACTURING (SOURCE:BJÖRNFOT,2006) ... 12
FIGURE 2-2THE 5SSYSTEM (SOURCE:TAPPING &SHUKER,2003)... 13
FIGURE 2-3PRINCIPLES OF LEAN THINKING (SOURCE:WOMACK &JONES,1996; CITED FROM HARRISSON & VAN HOEK,2005)... 15
FIGURE 2-4THREE AREAS OF THE VALUE STREAM.(SOURCE: TAPPING &SHUKER,2003). ... 16
FIGURE 2-5MAPPING PROCEDURE OF CSM(SOURCE:TAPPING &SHUKER,2003) ... 22
FIGURE 2-6THE POSTPONEMENT/SPECULATION STRATEGIES (SOURCE:PAGH &COOPER,1998)... 31
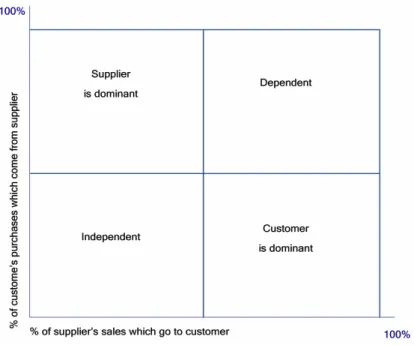
FIGURE 2-7THE CUSTOMER/SUPPLIER RELATION GRID (SOURCE:SCOTT &WESTBROOK,1991) ... 33
FIGURE 3-1RESEARCH METHODOLOGY FLOWCHART... 38
FIGURE 3-2RESPONDENTS INTERVIEWED IN THE CASE STUDY, PROVIDED IN THE INTERVIEWING SEQUENCE... 41
FIGURE 4-1THE EVOLUTION OF PLAYGROUNDS AT HAGS(SOURCE:HAGS PRESENTATION)... 45
FIGURE 4-2THE MANAGEMENT STRUCTURE AT HAGS WITH DEPARTMENTS VISITED DURING DATA COLLECTION SHOWN IN DOTTED PATTERN... 47
FIGURE 4-3EQUIPMENT PRODUCED AT HAGS(SOURCE: ADAPTED FROM HAGS HOMEPAGE) ... 48
FIGURE 4-4GENERAL VIEW OF THE ASSEMBLED ORIGO COMPONENTS. ... 49
FIGURE 4-5MAIN ACTORS IN THE ORIGO VALUE FLOW OF HAGS... 49
FIGURE 4-6ORDER FULFILLMENT PROCESS... 53
FIGURE 5-1SCHEMATIC PICTURE OF THE VALUE STREAM FOR ORIGO COMPONENTS... 57
FIGURE 5-2THE TIME FRAME OF ORDER FULFILLMENT PROCESS... 58
FIGURE 5-3OPERATION AND OWNERSHIP FLOWS OF ORIGO FOR A CUSTOMER ORDER... 58
FIGURE 5-4MAIN ORIGO COMPONENTS AND ASSOCIATED PRODUCTION PROCESSES... 59
FIGURE 5-5PROCESS I-VSM OF STEEL PIPES AT HAGS(FOR ALL THE PROCESSES SEE APPENDICES 5-7) .. 60
FIGURE 5-6VALUE ADDED VS. NON-VALUE ADDED TIME IN THE VALUE STREAM MAPPING... 61
FIGURE 5-7THE TIME FRAME OF THE ORDER... 62
FIGURE 5-8THE TRANSPORTATION STRUCTURE... 64
FIGURE 5-9THE REASONS OF WASTES OF ORIGO VALUE STREAM... 69
FIGURE 5-10THE DECOUPLING POINT OF ORIGO VALUE STREAM IN THE CURRENT SITUATION (SOURCE: ADAPTED FROM HINES &RICH,1997) ... 70
FIGURE 5-11THE NEW DECOUPLING POINT IN VALUE STREAM OF HAGS(SOURCE: ADAPTED FROM HINES &RICH,1997)... 71
FIGURE 5-12HAGS AND SUPPLIER X DEPENDENCE GRID IN THE CURRENT STATE (SOURCE: ADAPTED FROM SCOTT &WESTBROOK,1991)... 72
FIGURE 5-13HAGS AND QPC DEPENDENCE GRID: A) THE CURRENT STATE; B) THE FUTURE STATE (SOURCE: ADAPTED FROM SCOTT &WESTBROOK,1991)... 72
FIGURE 5-14THE PROPOSED TIME FRAME OF ORDER. ... 73
FIGURE 5-15THE SOLUTIONS TO REDUCE THE WASTES IN THE ORIGO VALUE STREAM... 78
FIGURE 5-16A DRAFT OF THE FUTURE STATE MAP FOR VALUE STREAM OF ORIGO (FOR A LARGER VERSION SEE APPENDIX 10)... 79
LIST OF TABLES
TABLE 2-1THE DEFINITIONS OF VALUE... 17
TABLE 2-2MANY MEANINGS OF VALUE WITHIN THE LEAN FRAMEWORK (SOURCE: ADOPTED FROM
KOSKELA,2004) ... 18 TABLE 2-3CLASSIFICATION OF ACTIVITIES... 24
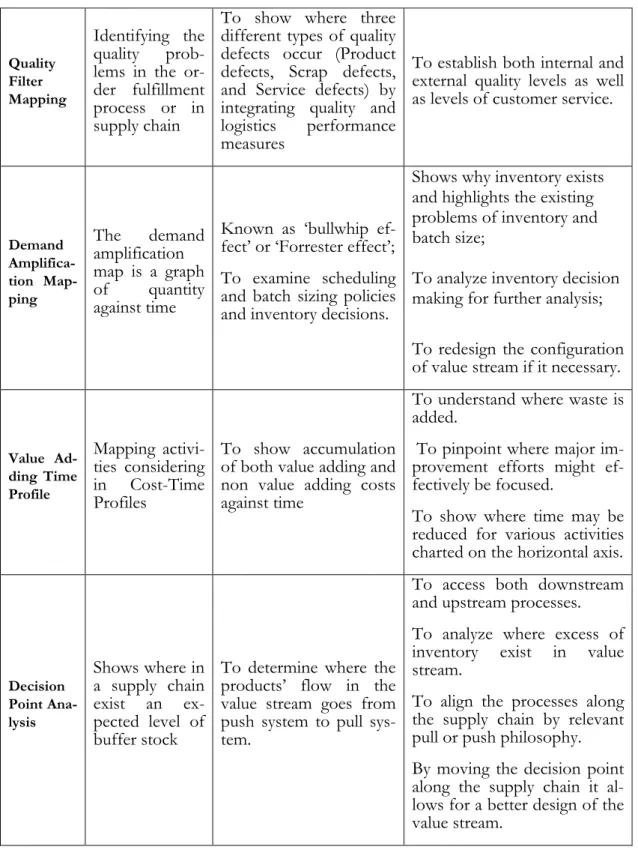
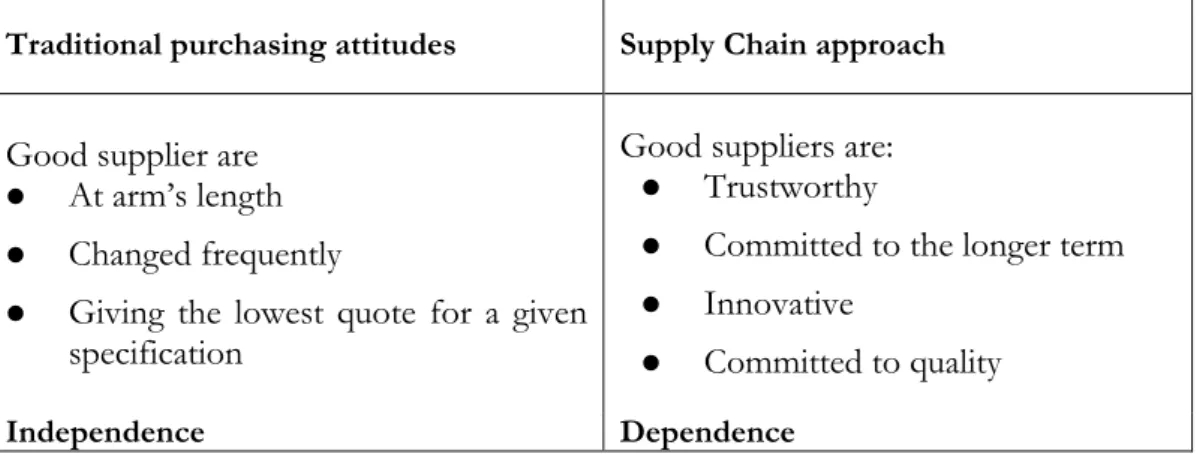
TABLE 2-4SUMMARY OF SEVEN VALUE STREAM MAPPING TOOLS (CONDENSATE FROM:HINES &TAYLOR, 2000;SULLIVAN ET AL.,2002;HINES &RICH,1997;KRISHNAMURTHY &YAUCH,2007) ... 27 TABLE 2-5TRADITIONAL PURCHASING VS A SUPPLY CHAIN APPROACH (SOURCE:SCOTT.&WESTBROOK,
1991) ... 34 TABLE 3-1THE TYPES AND THE DEGREE OF STANDARDIZATION OF INTERVIEWS... 40
1 Introduction
______________________________________________________________________ The chapter will present the background and the problem specification of the study. This has served as the foundation in formulating the problem statement, which in turn will serve as the foundation of the thesis.
The topic of lead time reduction is very hot for companies manufacturing a wide range of products, including those companies which outsource a significant part of their activities to other market players. Analysis of the product flow has thus been an important component in the business decision making process regarding the optimization of the organizational structure, relationships with sub-contractors, suppliers and transportation companies. The topic of this master thesis originates from company HAGS Aneby AB (Here and after it will be referred as HAGS) that produces playing systems comprising numerous compo-nents. An attempt to understand and analyze the problems in the product flow of HAGS on the example of one playing system made this study interesting not only from the meth-odological point of view, but also due to getting acquainted with many practical situations associated with one particular product flow.
1.1 Background
The term Value Stream Management originates from Supply Chain Management (SCM) that typically refers to the entire supply activity of a firm. Nowadays, SCM is “emerging into value activity management, which recognizes the importance of demand in addition to supply” (Marzian, McLaughlin & Andraski, 2003). Bruce et al. (2004) stated that the ten-dency of value creation usually takes place outside the boundaries of the individual firm. This implies that the practical field of SCM is changing continuously in order to cope with complex and diverse customer demands (cited in Halldorsson, Kotzab, Mikkola & Skott-Larsen, 2007). Companies explore the potential of the concept of SCM to improve their revenue growth by developing lean supply chains. This implies delivering products fast and at a minimum total cost for customers (Gunasekaran, Lai & Cheng, 2008). Lean supply chain integrates all the key processes and partners necessary to deliver the product to the end customer by adjusting the activities to the constantly changing demand of customers while delivering products quickly. As a result, companies that are parts of a lean supply chain become more competitive because they have lower cost than their competitors (Srinivasan, 2004). Wood (2004) stated that Value Stream Management results in the reduc-tion of wasteful activities, which makes the company more responsive to customer de-mand.
Stalk and Hout (1990) state that the focus on shorter lead time, flexibility and responsive-ness of the supply chain links external and internal activities, creating competitive advan-tage. Companies develop a structure which facilitates inter-company integration, coordina-tion and synchronizacoordina-tion of material flow (cited in Rich & Hines, 1997). Inter-company in-tegration and co-ordination focus on the supplier development through long-term partner-ships, trust and development of a structured process for information exchange between the organization and its supply chain (Ellram, 1991; Macbeth & Ferguson, 1994; Merli, 1992; cited in Rich & Hines, 1997). Synchronization of material flow originates from the Toyota Production System (TPS) in Japan. The Toyota’s lean supply network was characterized by high level of supply-chain integration and a structured approach to managing a smaller number of direct suppliers (Andersen Consulting, 1994; Hines, 1994; cited in Rich & Hines, 1997). The TPS production was based on lean thinking that is the essence of lean production. Lean thinking is grounded on the five principles (specify value, identify value
stream, flow, pull, and seek perfection) that are fundamental to the elimination of waste (Hines & Taylor, 2000). A framework of value stream mapping was developed by Toyota in Japan to understand waste and inefficiency in value streams (Jones, Hines & Tich, 1997). According to Brunt (2000), the benefits of removing waste and inefficiency in value streams are realized by showing a big picture of the value stream to optimize rather whole than individual processes. The detailed value stream mapping toolkit can be applied to fill in gaps left by big picture mapping. Some of the detailed mapping tools are process activity mapping, supply chain response matrix, production variety funnel, quality filter mapping, demand amplification mapping, value analysis time profile, and decision point analysis (Hines & Taylor, 2000).
According to Koskela (2004), the five lean principles provide a comprehensive foundation for transformation of productive activity from traditional to lean production. However, there are some limitations in application of lean thinking. Lean thinking is fragmented and lacks an adequate conceptualization of production. Next, the five principles do not system-atically cover value generation. In addition, “the failure to trace the origin of lean concepts and principles reduces the opportunity to justify and explain them” (Koskela, 2004 p.35). The focus of the study lies on leaning the supply chain of HAGS. Considering the lean thinking including the five principles and their limitations, we found them relevant for visualization of the Origo components flow, identification of wastes and looking for the ways to reduce the wastes. In our view the value stream mapping method applied here to Origo components flow could in future be extended to other product flows at HAGS.
1.2 Specification of Problem
The research problem solved in the thesis originates from the practical problem regarding the product flow at HAGS that has to be improved. Preliminary discussions with HAGS in the project formulation phase revealed problems with long lead time causing high level of inventory that were accompanying the product flows of various playing systems. The deci-sion was to visualize and analyze the flow on the example of Origo family components, and then propose possible measures how to improve it. Besides, the lean manufacturing principles including the concept of wastes and associated mapping tools had in many prac-tical situations proven to be an efficient methodology to cope with lead time problems. The research problem solved in the thesis is thus formulated as follows:
• How can the value stream mapping method be applied for improving the Origo components flow at HAGS?
It was thus interesting to apply lean principles, and particularly the value stream mapping method in the Origo flow context. Additionally, data collection possibilities provided at HAGS, including access to internal documentation, personal communication and contacts with sub-contractors and suppliers, made it realistic to solve the research problem.
1.3 Purpose
The purpose of the study is formulated as follows: to conduct a case study of the Origo com-ponents flow, by combining the lean thinking principles and the data collection methods, and thereby identifying, analyzing and proposing solutions for waste-related problems in the product flow at HAGS.
1.4 Research questions
In order to fulfil the purpose of the study, the following research questions have to be in-vestigated:
• How can the lean thinking framework be applied in searching for wastes in the flow of Origo family components?
• What are the reasons for the wastes in the Origo value stream?
• What can be done in order to reduce or eliminate the wastes in the flow of Origo family components?
1.5 Delimitation
The single case study was limited to the Origo product components which is the main part of a number of playing systems manufactured by HAGS. Proposing the solutions for waste related problems does not include implementation questions. The solutions were rather specified in terms of what can be changed in the internal HAGS organizational structure and their relationships with sub-contractors and suppliers. Only the key subcontractors and suppliers of HAGS were chosen for investigation of the Origo product flow.
1.6 Disposition of thesis
The thesis will henceforth be organized as follows:
Chapter 2 The Frame of Reference presents to the reader the knowledge in the areas of lean production, lean thinking, postponement and positioning the or-ganizations in terms of supplier relations. The value stream mapping method and the detailed mapping toolkit is presented. The theoretical tools presented in this chapter serve to interpret empirical data during the analysis. Chapter 3 The Methodology describes how the case study is conducted to combine
both theoretical and empirical approach. Application of the value stream method is discussed, taking into account the features of the investigated product flow and company specific data collection activities.
Chapter 4 The Empirical Studies present the collected empirical data from HAGS in-cluding the order fulfillment process and the main actors involved in the HAGS value stream.
Chapter 5 The Analysis presents the interpretations and reflections derived from the empirical studies by applying the theoretical knowledge. The focus is on the waste identification in the flow of Origo by constructing the current state map. Solutions to reduce the identified are proposed and visualized in the draft of the future state map.
Chapter 6 Conclusions will present the main findings from different perspectives in-cluding methodological, theoretical and managerial implications.
2 Frame of reference
_____________________________________________________
The purpose of this chapter is to provide the knowledge on the chosen theories for achieving the research purpose.2.1 From mass production to lean production
According to Srinivasan (2004), the first automobile manufacturing in the world were two Frenchmen, Rene Panhard and Emil Levassor, who obtained a license to build engines from Daimler in 1889. The next year they had built a car. Since they saw no future in the business they sold the business to Armand Peugeot. More and more car manufactures were establishing in the market in Europe and US. However, all of them had used craft produc-tion and cars were produced small volumes.
Henry Ford was the first mass producer in the US who changed the manufacturing world by introducing the concepts of flow and throughput velocity. The aid of the concepts was the moving-assembly line that sharply reduced the assembly time. Ford had a goal to re-duce waste not just within the factory but also across the entire supply chain. The removal of waste allowed reducing the production costs that benefited customers. However, Ford incurred high cost from manufacturing details, which cost the company thousands of dol-lars. Due to the promoting only a standard model with a single color Ford lost the market share to General Motors’ Chevrolet. General Motors had modified the principles of mass production and could offer the different models every year (Srinivasan, 2004).
Henry Ford’s contribution to mass production was the source of inspiration for many con-cepts and tools used in Toyota Production System (TPS). In 1960s Japanese manufactures came into the US market when it was the oil crisis hit. The Japanese compact cars used much less fuel than the American large cars. Japanese succeeded due to producing cars at low costs and using just-in-time (JIT) philosophy. They chose an unconventional path to reach greater heights, by beginning the long process of developing and refining manufac-turing processes to minimize waste in all aspects of operations (Seth& Gupta, 2005). JIT management system was invented by the two persons, Kiichiro Toyoda and Taiichi Ohno, who worked for Toyota Motor Corporation. Kiichiro Toyoda was inspired from Henry Ford’s book Today and Tomorrow. He had an idea to produce only what was needed and only when it was needed on a given day. It was introduced the method of kanban that became the basis for the JIT system (Srinivasan, 2004). Kanban is the means of JIT management or signaling system between a corporation and its suppliers. Supplier delivers components to the production line as and when they are needed (Gross, 2003). Moreover, he saw the need to cooperate with suppliers to perform JIT system and to change the traditional workshop layout to the product layout. The continuous improvement (kaizen) concept was brought from the visiting Ford Motor Company, and the supermarket principle was brought from the visiting the supermarket in US (Srinivasan, 2004). The idea to produce in small batches came up after the visit Ford Motor Company since a manager from TPS realized how wasteful are the production processes in big batches that US auto manufacturers were per-forming.
Thus it can be said that TPS benefited by introducing Henry Ford’s concepts of kaizen (continuous improvement), flow, pull production and waste elimination. The supermarket principle helps in pull production, i.e. to produce when it is needed. Furthermore, TPS emphasized the partnering with the automakers and their suppliers to achieve the mutual benefits (Srinivasan, 2004).
The partnering means the closer collaboration with the key actors in a supply chain. Figure 2-1 shows the essentials of Lean manufacturing cycle.
Figure 2- 1The essentials of Lean Manufacturing (source: Björnfot, 2006)
The actors are close connected in every day operations. The production is based on the principle what customer needs and when customer needs. Other actors in the supply chain balance their work according to the same signal that arises from customer demand. When a customer places an order, the actors start to produce in ‘just in time’ manner. The central role performs the cross-organizational team work, which coordinates the flow.
The goal of lean manufacturing is to reduce waste in human effort, inventory, time to mar-ket and manufacturing space to become highly responsive to customer demand while pro-ducing high quality products in the most efficient and economical manner (Seth& Gupta, 2005). This approach centers on the elimination of waste. Waste takes many forms and can be found at any time and in any place, it may be found hidden in policies, procedures, process and product designs, and in operations. Waste consumes resources but does not add any value to the product.
Thus, lean manufacturing combines the best features of both mass and craft production: the ability to reduce costs per unit and dramatically improve quality while at the same time providing an ever wider range of products and more challenging work (Womack, Jones & Roos, 1990). It was established beyond doubt that the organizations that mastered lean manufacturing methods had substantial cost and quality advantages over those, which were still practicing traditional mass production (Fleischer & Liker, 1997).
To sum up, Lean manufacturing was introduced by Toyota Production System that had its roots in the Henry Ford’s mass production system. The major emphasis was upon the re-ducing any kind of waste not even within the company but also across the supply chain. To speed up the production processes the principles of JIT, pull production, continuous flow were emphasized. The methods and tools to fulfill the principles were highlighted such as kanban, continuous improvement (kaizen), supermarkets, production in small batches and changing the traditional workshop layout.
2.2 Lean thinking
The term ‘Lean thinking’ was coined first by Womack, Jones and Ross in the book of “The Machine that Changed the World” (1990). The goal of lean thinking is to eliminate muda, that is, Japanese word for waste. The concept ‘lean’ is based on JIT principles and they were introduced to describe the working philosophy and practices of the Japanese
automo-bile manufacturers and in particular the TPS (Womack, et.al., 1990). Western automoautomo-bile manufacturers applied the concept in mass production (Harrison & van Hoek, 2005). Scholars that research value streams and lean initiatives explored other avenues such as the theory of constraints, system dynamics, simulation, and mathematical and expert system-based approaches (Seth & Gupta, 2005). Their work mainly focused upon the same point: how to minimize inventory and ensure its visibility in the pipeline in different industrial scenarios, and country-specific conditions. Thus, lean thinking has close connections with the above mentioned theories.
Lean thinking can be applied at all levels in a company and across a supply chain in order to eliminate wasteful activities. The two goals can be achieved in eliminating wasteful ac-tivities: 1) Lean thinking reduces lead times of products. The benefit will be that a company will be more flexible and responsive to downstream customers and will be able to provide smoother and more predictable demand for upstream suppliers. 2) Elimination of wastes aids in freeing up resources for deployment elsewhere in the business. It implies that lean thinking contributes a growth strategy (Srinivasan, 2004).
Usually companies focus on the issues within the company, e.g. how to reduce inventory to save on carrying costs. Lean thinking would help companies to be more responsive and re-liable to customer demands. In turn, customers would choose rather these companies than others that they had poor experience. It will strengthen the relationships with suppliers enabling to build customized products without having a large volume of inventory in-house (Srinivasan, 2004).
To promote flow of products, lean thinking uses some important tools such as 5S system, flow charts, takt time, one-piece flow, cellular layout, standard work, pull replenishment, continuous improvement for the pursuit of perfection, etc. We provide descriptions of some of the tools.
5S System.
It improves safety, work efficiency, and productivity and gives employees a sense of own-ership. Any organization, which aims to eliminate wasteful activities, should start with the 5S systems principles. To succeed in the lean journey, the organization has to put in prac-tice all of the principles (Srinivasan, 2004). The 5S system consists of five activities, see Figure 2-2.
5555SSSS
Sort SortSort Sort Set in Order Set in OrderSet in Order Set in Order Shine Shine Shine Shine Standardize Standardize Standardize Standardize Sustain Sustain Sustain SustainFigure 2- 2 The 5S System (source: Tapping & Shuker, 2003)
1. Sort - involves sorting and removing the unnecessary items (Tapping & Shuker, 2003). It means to organize something that is not organized (Srinivasan, 2004)
2. Set in order – involves arranging necessary items for easy and efficient access (Tap-ping & Shuker, 2003). The step can completed with the first on (Sort), because there is not big difference between them. The second step creates storage systems and provides visual information about the items stored (Srinivasan, 2004).
3. Shine – involves keeping clean the work area including the maintenance of tools (Tapping & Shuker, 2003). The practical benefit behind the third step is to discover small problems in machinery before big failure occurs (Srinivasan, 2004).
4. Standardize – involves creating guidelines, making standards visual that helps in the working process (Tapping & Shuker, 2003). The step concerns both personal and environmental cleanliness. The employees have to be trained to detect the prob-lems by following the imposed standards to measure and maintain “cleanliness” (Srinivasan, 2004).
5. Sustain – involves education and communication to ensure that everyone follows the 5S standards (Tapping & Shuker, 2003). The last step sustains the first four steps. It is important that top management supports the fifth step by providing in-centives that the step becomes as a habit (Srinivasan, 2004).
Flow charts
Flow charts visualize any manufacturing or service process from one step to the next step, etc. Through the flow charts it will be able to identify the unnecessary processes and wastes within them. The key to streamline the processes are to eliminate or at least reduce the non-value added activities. The example of the process flow chart, see Appendix 5.
One-Piece Flow
One-Piece flow means that products move one unit at a time between workstations. The goal of one-piece flow is to reduce the lead time of products or to reduce the work in process (WIP) inventory that assimilates during the process. In addition, it helps to im-prove product quality because the one-piece flow shortens the one-piece feedback loop. To implement the principle of one-piece flow it is desirable that it would be little variability in process times. Moreover, it is important that the process quality and one-piece flow should be linked together (Srinivasan, 2004). In addition, one-piece flow aids in the continuous flow of products (Rother & Shook, 2005).
Cellular layout
Cellular layout means that the workstations are organized in a processing sequence. The cellular layout enhances the one-piece flow. The cellular layout also called a product layout. Common layout configurations used for manufacturing workstations include the U-shaped cell, the T-shaped cell, the L-shaped cell, the C-shaped cell or a serpentine arrangement (Srinivasan, 2004; Tapping & Shuker, 2003). The traditional manufacturing layout is called a process layout where the workstations are grouped by departments or functions (Sriniva-san, 2004). The advantages of the cellular layout and one-piece flow are the following:
o WIP reduction;
o Better space utilization; o Reduction in lead time;
o Productivity improvement in terms of flexibility in allocation tasks to operators and rebalancing production according to urgent orders;
o Enhanced teamwork and communication;
o Better visibility of all tasks and operations (Srinivasan, 2004, p. 169-170).
Thus, the philosophy of lean thinking involves eliminating waste and unnecessary actions and linking all the steps that create value. In 1996, the initial concept of lean was more ex-tensively defined and described by five key principles (Womack & Jones, 1996), see Figure 2-3.
• Specifying value;
• Identifying the value stream; • Making value flow;
• Pull scheduling; • Seek perfection.
5. Perfection 4. Let customer pull
3. Create product flow
2. Identify value stream 1. Specify value
muda muda
muda muda
Figure 2- 3 Principles of lean thinking (Source: Womack & Jones, 1996; cited from Harrisson & van Hoek, 2005)
The lean principles will be described in detailed in Chapters 2.3-2.7.
The principles of minimizing waste are applied not even within automobile manufacturing enterprises but also to diverse industries such as furniture, electrical switchgears, aerospace, aircraft maintenance, electrical appliances and office products (Srinivasan, 2004; Harrison & van Hoek, 2005). According to Harrison and van Hoek (2005, p.171) the term “lean thinking refers to the elimination of muda (waste) in all aspects of a business”, and the ap-proach is totally different from traditional mass production apap-proach.
2.2.1 Application of lean thinking to business processes
As was mentioned before, identifying the wastes in the production processes allows prod-ucts and information flow through the business processes evenly. It is important to under-stand the business processes within the whole organizational structure in order to analyze the wastes. Thus, it is important to start the analysis of wastes by identifying the key busi-ness processes. The busibusi-ness processes of primer importance are considered such as order to replenishment, order to production, and product development (Harrison & van Hoek, 2005). Tapping and Shuker (2003) named business processes differently. However, they imply the same procedures to be performed. Thus, according to Tapping and Shuker, the business processes are concept to launch, raw material to finished goods and Order-to-Cash processes, see Figure 2-4.
Figure 2- 4 Three areas of the value stream. (Source: Tapping & Shuker, 2003).
Product development or concept to launch
Lean thinking can be applied to the business process is by making the process more effec-tive by supporting the development of products with desirable attributes and features, and achieving this on time. The main processes within the product development/concept to launch process are drafting release process, pricing, procurement, engineering proposals, customer ordering and quotes and control plan process (Tapping & Shuker, 2003; Harrison & van Hoek, 2005).
Order to production or raw material to finished goods
The business process involves all the manufacturing materials and information require-ments to deliver the product to the customer with the highest quality, lowest costs and shortest lead time. It can be prosecuted either within the company or can be extended down the supply chain (Tapping & Shuker, 2003; Harrison & van Hoek, 2005).
Order to replenishment or Order-to-Cash
The process begins with the incoming customer order. It can overlap with the raw mate-rial-to-finished product value stream. The examples of Order-to-Replenishment/Order-to-Cash value stream are: order lead time process, customer service returned material reports, month-end closing, product enhancement process, etc.
Thus, the lean thinking manages the business process by fast lead times. The approaches of vendor-managed inventory and quick response can be very helpful in achieving short lead times of order to replenishment business process. However, the approaches have some limitations, especially when an organization dealing with seasonal products, or does not want to share information, or lacking standard procedures, etc. (Tapping & Shuker, 2003; Harrison & van Hoek, 2005).
Each of these business processes involve lean thinking by examination the process, deter-mining waste within it, identifying the causes of the waste, and developing and implement-ing solutions. The purpose of lean management is not to make someone work faster, but
rather to streamline the flow that the work moves faster through the value stream. (Tapping & Shuker, 2003; Harrison & van Hoek, 2005).
To summarize, lean thinking is about how to eliminate muda (waste) from the non-value added activities both within organization and across the supply chain. Eliminating muda means enhancing the competitive advantage in terms of reducing lead times and freeing up resources for deployment elsewhere in the business. It implies to be more flexible and re-sponsible to the downstream customers, to have close collaborations with suppliers, and no need to keep high volumes of inventory in-house in order to be able to create a customized product. Lean thinking has close connections with the theories such as the theory of con-straints, system dynamics, simulation, and mathematical and expert system-based ap-proaches. There are important tools that can promote the lean flow of products: 5S system, flow charts, takt time, one-piece flow, cellular layout, standard work, pull replenishment, continuous improvement and the pursuit of perfection, etc. 5S System, flow charts, cellular layout and one-piece flow were described in more detail. There are three business process areas where lean thinking is applicable: concept to launch, raw material to finished goods and Order-to-Cash.
2.3 Lean principle - Specify Value
The first principle, specify value, means to define value from the end-customer perspective. It means that value is added along the supply network as raw material is converted into fin-ished product bought by the end customer. For example, the aluminum ore is converted into one of the constituents of a can of cola (Harrison & van Hoek, 2005).
Many dictionaries provide definition for the word “value”. The term value tends to have different meaning to almost every individual or organization. The reason of the differentia-tion of the value term due to the fact that the term is also used in different fields such as mathematics, ethics, music, physic and chemistry (Rutner & Langley, 2000). Table 2-1 pro-vides some definitions of value that can be relevant to use in business field.
Table 2- 1 The definitions of value
Definition References
Supply Chain Management
A property of a product or service that the cus-tomer cares about and would be willing to pay for.
Whicker, Ber-non, Templar & Mena, 2006, p.2
Logistics
Providing the right product at the right price, time and place, without error, with consistency over
time.
Rutner & Lang-ley, 2000, p. 77
Marketing
Value refers to the perceived worth in monetary terms of the economic, technical, service, and social
benefits received by a customer firm in exchange for the price paid for a product offering. Judgments
about value also take into consideration alternative suppliers’ offerings and prices.
Anderson & Narus, 2001,
Table 2-1 Continued
Marketing
A trade-off between benefits and sacrifices perceived by the customer in a supplier’s
offer-ing.
Ulaga & Chacour, 2001, p. 527.
Marketing & Management
Customer value is typically a dynamic concept because the perceived value of a product or service may change over time. The drivers that motivate a customer’s initial purchase may dif-fer from the criteria that connote value during use right after purchase, which in turn may
dif-fer from the determinants of value during long-term use
Woodruff 1997; Day & Wensley 1988; Flint, Woodruff & Gardial 1997; cited in
van der Haar, Kemp & Omta, 2001, p. 628
Lean thinking Value is the mean of materials, parts or
prod-ucts that flowing through in the value stream Koskela, 2004, p. 29
It is argued that value is added to products or services only when the three criteria are ful-filled: customer cares about the change; physically change the item; and a company is doing right at first time (Blackburn, 1991; Gregory & Rawling, 1997: cited in Whicker et al., 2006).
Koskela (2004) provides the inferred meaning of value in parallel with five lean principles that were introduced in Chapter 2.2, see Table 2-2.
Table 2- 2 Many meanings of value within the lean framework (Source: adopted from Koskela, 2004)
Lean principles Inferred meaning of value
1. Precisely specify value by specific product 1. Specify value = specify product
2. Identify value stream for each product 2. Value stream = material and information flow
3. Make sure flow without interruptions 3. Value = flow of materials without inter-ruptions
4. Let the customer pull value from the producer.
4. Value = product
5. Pursue perfection 5. Value = product
The first principle is to specify value in term of product or product functions. The inferred meaning of value points to specify value. However, the value cannot be seen as itself, be-cause it is attached with the product. Thus, value here is used to mean materials or prod-ucts (Koskela, 2004).
The second principle means designing the production system including product develop-ment, order fulfilment process with goal to avoid the wasteful activities. Thus, the inferred meaning of value stream is the material and information flow including the key partners in the supply chain (Koskela, 2004).
The third principle highlights to make a flow without interruptions. It means to make a flow by eliminating the identified wasteful activities. In the inferred meaning of the princi-ple, the value is the flow. To achieve the waste free flow helps one-piece flow rather than producing in batches (Koskela, 2004).
The fourth principle accentuates that customers pull the products instead of producer pushes the unwanted products. The inferred value of the principle is that the products will be produced in ‘just in time’ manner that keep lead time under control (Koskela, 2004). The fifth principle stresses that there is a need for “continuous minimization of waste and maximization of value”, associated with JIT and TQC (Total Quality Control) concepts (Koskela, 2004, p. 31). Thus, the continuous improvement should be performed in any lean organization.
As a summary, the concept of value has different meanings depending on the industry where it is used. The value in terms of lean thinking is based on five lean principles. How-ever, the common perception of value is when customer cares about the product, buys it continuously and a company is doing right at first time.
2.4 Lean principle - Identify the Value Stream
The second principle is to identify the value stream means to define the whole sequence of processes along the supply network. The mapping of the value stream is very helpful to identifying and removing the sources and causes in the supply network (Harrison & van Hoek, 2005). Womack and Jones (1996, p. 19) defined the value stream as “the set of all the specific actions required to bring a specific product through the three critical management tasks of any business”:
• All activities, even non-value added activities, involve in creating products from concept through detailed design and engineering to what a customer is willing to pay for;
• Sharing information along the supply chain based on orders and orders forecasts from the stage of order taking to the stage of delivery scheduling;
• The network of processes and operations from raw materials to a finished product (Womack & Jones, 1996; Tapping & Shuker, 2003).
Mainly, there are three value stream areas for each product family. The areas include multi-ple processes and activities that usually overlap with other areas. The areas are such as 1) concept-to-launch, 2) raw material-to-finished products, and 3) order-to-cash, see Figure 2-4. (Tapping & Shuker, 2003).
There are many value streams in any organization that involve both the value added and non-value added actions to bring a product from the concept through development, manu-facturing to the end customer. In manumanu-facturing, the products are classified in product families. A product family refers to group of parts that share a common processing se-quence (Tapping & Shuker, 2003).
It is difficult to choose a value stream to map due to its complexity. Tapping and Shuker (2003) suggest breaking value stream areas into smaller streams. Womack and Jones (2005) suggest mapping only those value streams that a company wants to improve. Tapping and Shuker (2003) propose drawing the maps by starting from the end customer and going
to-wards upstream, including all manufacturing activities that needed to bring product from the concept to the receipt of the customer.
2.5 Lean principle - Make Value Flow
The third lean principle, make value flow, means applying the key factors along the supply chain. To minimize delays, inventories, defects and downtime in order to support the value flow are the key factors of the principle. It is important to visualize and simplify the proc-esses to identify and remove waste of value flow. Thus, the above mentioned factors will be achieved (Harrison & van Hoek, 2005).
In order to make value flow the three steps have to be performed. First of all, a company has to focus on the actual object, i.e. specific product, specific order, etc. and map that (Womack & Jones, 1996). However, it is important to map only that flow which the com-pany needs to improve (Rother & Shook, 2005). The best results will be achieved if the company will be able to map the value stream from the beginning to the finished product, i.e. including suppliers and n-tiers sub-suppliers. Secondly, it is recommended to ignore the traditional boundaries of jobs, careers and functions organized into departments. The sec-ond step makes the first step possible. It will be feasible to remove the barriers across a supply chain by mapping the specific product or product family. It enables the continuous flow of the mapped product. Third, it is important to reconsider specific work practices and tools to get rid of all sorts return flow, scrap, and stoppages allowing the product to flow through the business processes continuously. All these steps have to taken together (Womack & Jones, 1996).
The dedicated cross-skilled team should be created to conduct the work according the mentioned steps. The cross-skilled team should consist of marketing, engineering, purchas-ing and production professionals includpurchas-ing employees of key components and material suppliers firms. Sales and production scheduling are major members of the team in the lean enterprise. Sales department plans the sales campaign according to the capabilities of duction system. Thus, it is important that the salesmen would offer according to the pro-duction system capabilities to make a smooth flow from sale to delivery (Womack & Jones, 1996).
There are some tools that aid to implement the approach. One of them is “takt time, which synchronizes the rate of production to the rate of sales to customers” (Womack & Jones, 1996 p. 55). The takt time indicates how fast the workshop has to produce a component that is based on the selling takt time, which would correspondent to customers needs. The takt time is calculated by dividing the customer need per day to the available working hours per day. It is simple to produce according the takt time, however, it requires concentrated efforts because the operators have to react quickly in case of some problem arises and will be able to eliminate the reasons from the non-planned stoppage of production (Rother & Shook, 2005). Next tool is the JIT system, which could diminish the role of MRP system. However, if the changeover times of machinery is long and machines are producing in large batches then the inventory will accumulates and the JIT system will be helpless. There is a need to organize a workshop in a way that it contributes the continuous flow. Thus, the flow has to be organized according to production areas by product family including every fabrication and assembly step. The reorganizing a layout of workshop according to product families enables the one-piece flow (see Chapter 2.2), which in turn, enables the continuous flow of the product. To maintain the continuous flow it is important that every machine and every worker will be capable to perform an operation. It implies that there is a need of cross-skilled workers in a workshop that they could switch to other tasks when it is needed
or when someone is absent. It also implies that the work has to be standardized by the work team. Moreover, it is important that operators would be able to monitor their own work through mistake-proofing technique. In addition, to enable the continuous flow there is a need to reduce changeover times and batch sizes to the minimum that machinery al-lows (Womack & Jones, 1996).
2.5.1 Value Stream Mapping
According to Seth and Gupta (2005), Value Stream Mapping (VSM) is the process of map-ping the material and information flows for components and sub-assemblies in a value chain from raw material to the customer. Womack and Jones (1996) define VSM as a tool, which allows identify ways to get material and information to flow without interruption, improve productivity and competitiveness, and help people implement system rather than isolated process improvements (cited in Emiliani & Stek, 2004). Womack & Jones (1996), and Rother & Shook (1999) described value-stream maps as “material and information flow maps”, which are one-page diagrams showing the processes used to make a product (cited in Emiliani & Stek, 2004). VSM is used to identify the sources of waste in the value stream as basis for implementation plan that helps to see and focus on flow with a vision of and ideal (CMTC, 2003).
VSM is a mapping paradigm used to describe the configuration of value streams and it maps not only material flows but also information flows that signal and control these mate-rial flows (Rother & Shook 1999). Seth and Gupta (2005) state that it is necessary to map the value stream of products both within a company and across the supply chain. VSM modeling language includes standard icons, and it is easy to use with its widening dissemi-nation within the manufacturing community, and VSM also includes a step by step ap-proach to transform a current manufacturing state into a Lean Future State, which is the basis of its success in practice (Dinesh & Vaibhav, 2005). VSM tools were popularized by Rother and Shook (1999).
VSM became a popular implementation method for Lean manufacturing, and it is consid-ered as a classification scheme. VSM with seven mapping tools (namely, process activity mapping, supply-chain response matrix, production variety funnel, quality filter mapping, demand amplification mapping, decision point analysis and physical structure mapping) and their major application areas are very useful (Hines & Rich, 1997).
Mostly, the value-stream maps were applied to manufacturing activities, but nowadays the technique is used to map any service business process, including business-to-business sales, retail sales, e-business, auditing, healthcare, education, and government services (Emiliani & Stek, 2004).
Selection of a product family
Before starting the value stream mapping, a particular product or product family should be defined as the target for future improvement. Not all the product can be selected to map the flow that passes through the factory. The mapping of value stream means walking along the processes and drawing all the steps in the process required for a product family. Thus the drawing includes all of the steps including the physical and information flow from door to door in a factory (Rother & Shook, 2005).
To select a product or product family is recommended which passes along the same proc-esses and machinery in the workshop. However, it is recommended to avoid those product
or product families which are produced in large batches and are the part of many other product families (Rother & Shook, 2005).
Current state map (CSM)
“The current (or 'as is") status is mapped to capture a snapshot of how things are done and where the improvement potentials lie” (Seth & Gupta, 2005 p.45).
After selecting a particular product or product family, the next step is to draw a CSM, to understand how a workshop currently operates. Moreover, CSM helps in designing a lean flow of FSM. Mapping the process will give operators a clear picture of the wastes that hinder flow. It also enables to reduce or eliminate the identified wastes (Tapping & Shuker, 2003).
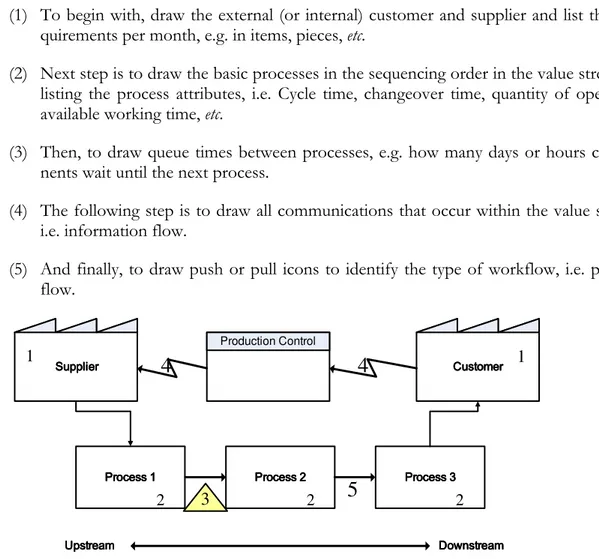
In order to observe and understand the value stream from customer perspective, it is sug-gested to start from the closest point to the customer and work the way upstream through the various processes. When it comes to the drawing of current state map, it should be conducted by the common CSM procedure. According to Tapping and Shuker (2003) the steps of the procedure are the following, and see Figure 2-5:
(1) To begin with, draw the external (or internal) customer and supplier and list their re-quirements per month, e.g. in items, pieces, etc.
(2) Next step is to draw the basic processes in the sequencing order in the value stream by listing the process attributes, i.e. Cycle time, changeover time, quantity of operators, available working time, etc.
(3) Then, to draw queue times between processes, e.g. how many days or hours compo-nents wait until the next process.
(4) The following step is to draw all communications that occur within the value stream, i.e. information flow.
(5) And finally, to draw push or pull icons to identify the type of workflow, i.e. physical flow.
Supplier SupplierSupplier
Supplier CustomerCustomerCustomerCustomer
Process Process Process
Process 1111 Process Process Process Process 2222 Process Process Process Process 3333
Upstream Upstream Upstream
Upstream DownstreamDownstreamDownstreamDownstream
Production Control
1 1
2 3 2
5
24
4
Enablers of moving from CSM to FSM
Creating the detailed FSM is a complex and multi-step process where representatives from all the involved companies should form a well coordinated team. According to Brunt (2000), the following enablers are required to make possible transition from CSM to FSM: (1) A cross-functional team is required to carry out the mapping process. The team has to understand the mapping language and icons and will be able to explain the overview of mapping process.
(2) The business performance benefits achieved in the FSM have to be agreed by all par-ticipants firms.
(3) The finance and measurement systems have to be balanced across a supply chain to avoid the conflicts, e.g. conflicts in operational measures in companies within a supply chain.
(4) The assessment of other value streams has to be considered to understand the where these value streams overlap can be created. It is important to take into consideration be-cause in any supply chain occur bottlenecks or capacity constraints.
(5) It is important to consider and analyze the whole value stream: from the customer to supply. Then it would be possible to rethink the delivery of value by removing more waste that incurs cost (Brunt, 2000).
Future state map (FSM)
“Future or "to be' state map shows how things should to be done considering takt time require-ments” (Seth & Gupta, 2005 p.45).
After the drawing of CSM next step is to draw FSM. The FSM depicts how the value stream of a product family should look like after eliminating or reducing all the inefficien-cies. The proposed future changes and suggestions for the improvement of the value stream are based upon FSM including the different lean tools. The examples of lean tools are FIFO lanes, work-area re-design, supermarkets, kanban, 5S, etc. These tools help to meet customer requirements, establish a continuous workflow and distribute work evenly. Moreover, FSM visualize where these tools are to be used (Tapping & Shuker, 2003). The process for mapping the future state takes place in three phases, which has to be per-formed together:
(1) Customer demand phase: understanding of customer demand for services and work units, including quality characteristics and lead time.
(2) Continuous flow phase: implementation of continuous flow. The indicator here is that customers receive the right work unit, at the right time, in the right quality.
(3) Leveling phase: distribution of work evenly (e.g. by volume and variety) to reduce queue times (Tapping & Shuker, 2003).
2.5.2 The three types of activity
Manufacturing, especially lean manufacturing strives to reduce waste in human effort, in-ventory and time to market. Manufacturing space is becoming highly responsive to cus-tomer demand, same as the demand to produce the quality products is focused on the effi-cient and economical manner (Seth & Gupta, 2005). Since lean thinking analyzes business processes systematically by identifying and removing wastes, it helps also to distinguish be-tween value added and non-value added processes (Harrison & van Hoek, 2005). Classifi-cation of processes is based on the elimination of waste (Seth & Gupta, 2005). There are two types of activities classification, see Table 2-3.
Table 2- 3 Classification of activities
Activities, classified by Monden (1993);
cited in Hines & Rich, 1997 Activities, classified by Womack & Jones (1996)
Value-added activities Value-added activities Necessary but non-value added activities Type One muda Non-value added activities Type Two muda
Value-added activities involve the conversion or processing of raw materials or semi-finished products through the use of manual labor. Examples include activities such as sub-assembling of parts, forging raw materials, and painting bodywork (Monden, 1993; cited in Hines & Rich, 1997). Thus, value added activities are the machinery working time required to produce a product.
Meanwhile, necessary but non-value added activities or Type One muda may be wasteful but are necessary under the current operating procedures. Examples include such as walking long distances to pick up parts, unpacking deliveries, and transferring a tool from one hand to another. In order to eliminate these types of operation it would be necessary to make major changes to the operating system such as creating a new layout or arranging for suppliers to deliver unpacked goods. Such change may not be possible immediately (Monden, 1993; cited in Hines & Rich, 1997).
Non-value added activities or Type two muda stands for the pure waste and involves unneces-sary actions, which can be eliminated completely. Examples include waiting time, stacking intermediate products, double handling and etc (Monden, 1993, cited in Hines & Rich, 1997). Typically, 95% of all lead time is non-value added activities (CMTC, 2003).
2.5.3 Wastes
According to Hines, Rich, Bicheno, Brunt, Taylor, Butterworth & Sullivan, (1998), under-standing wastes within the supply chain is considered as the first stages of VSM. Research-ers and practitionResearch-ers try to identify waste in value streams and, hence, find an appropriate route to removal, or at least diminishing the influence of waste (Hines & Rich, 1997). Waste takes many forms and can be found at any time and in any place. It may be found hidden in policies, procedures, production process, product designs, and in other
opera-tions (Seth & Gupta, 2005). Waste consumes resources but does not add any value to the product (Womack & Jones, 1996). Russell and Taylor (1999) define waste as anything other than the minimum amount of equipment, effort, materials, parts, space and time that are essential to add value to the product (cited in Seth & Gupta, 2005).
To identify and remove wastes to able to drive competitive advantage was pioneered by TPS. However, the focus was more on productivity that on quality (cited in Hines & Rich, 1997). According to Bicheno (1991), the reason for focusing on productivity is that im-proved productivity leads to leaner operations, which help to uncover further waste and quality problems in the system. Therefore, the systematic attack on waste is also a system-atic attack on the factors underlying poor quality and fundamental management problems (cited in Hines & Rich, 1997).
According to Shingeo (1989), Bicheno (1994) and Taiichi (1985) there are seven types of wastes, which are accepted commonly in manufacturing industry (cited in Hines & Rich, 1997): 1) overproduction, 2) waiting, 3) transportation, 4) inappropriate processing, 5) un-necessary inventory, 6) unun-necessary movement and 7) defects.
The waste of overproduction
The waste of overproduction is considered as the most serious waste as it discourages a smooth flow of goods or services and is likely to inhibit quality and productivity. Such overproduction also tends to lead to excessive lead and storage times. As a result defects may not be detected early, products may deteriorate and artificial pressures on work rate may be generated. In addition, overproduction leads to excessive work-in-progress stocks, which result in the physical dislocation of operations with consequent poorer communica-tion. This state of affairs is often encouraged by bonus systems that encourage the push of unwanted goods. The pull or kanban system was employed by Toyota as a way of over-coming this problem (Hines & Rich, 1997).
The waste of waiting
The waste of waiting occurs when time is not being used effectively. In a factory, the waste occur whenever products are not moving or being worked on. The waste affects both products and workers, each spending time waiting. The ideal state should be no waiting time with a consequent faster flow of goods. Waiting time for workers may be used for training, maintenance or kaizen (continuous improvement) activities and should not result in overproduction (Hines & Rich, 1997).
The waste of transportation
The waste involves goods being moved from one process to the next and adds no value to the products. Taken to an extreme, any movement in the factory could be viewed as waste, and thus, minimization of transportation is usually sought. In addition, double handling and excessive movements are likely to cause damage and deterioration with the distance of communication between processes proportional to the time it takes to feed back reports of poor quality and to take corrective action (Hines & Rich, 1997).
The waste of inappropriate processing
The waste of inappropriate processing occurs in situations where overly complex solutions are found to simple procedures such as using a large inflexible machine instead of several small flexible ones. The over-complexity generally discourages ownership and encourages the employees to overproduce to recover the large investment in the complex machines. Such an approach encourages poor layout, leading to excessive transport and poor com-munication. The ideal, therefore, is to have the smallest possible machine, capable of pro-ducing the required quality, located next to preceding and subsequent operations. Inappro-priate processing occurs also when machines are used without sufficient safeguards, such as poke-yoke (mistake-proofing technique) or jidoka (stopping a manual line or process when something goes wrong) devices, so that poor quality goods can be made (Hines & Rich, 1997).
The waste of unnecessary inventory
The waste of unnecessary inventory is a sign that flow was disrupted, and that there are problems in the process (Harrison & van Hoek, 2005). Unnecessary inventory tends to in-crease lead time, preventing rapid identification of problems and increasing space, thereby discouraging communication. Thus, problems are hidden by inventory. To correct these problems, they first have to be found. This can be achieved only by reducing inventory. In addition, unnecessary inventories create significant storage costs and, hence, lower the competitiveness of the organization or value stream wherein they exist (Hines & Rich, 1997).
The waste of unnecessary movements
The waste of unnecessary movements involves the ergonomics of production where opera-tors have to stretch, bend and pick up when these actions could be avoided. Other exam-ples are such as walking between processes, taking a stores requisition for signature or emptying parts from one container into another (Harrison & van Hoek, 2005). Such waste is tiring for the employees and is likely to lead to poor productivity and, often, to quality problems (Hines & Rich, 1997).
The waste of defects
The waste of defects implies that producing defects costs time and money (Harrison & van Hoek, 2005). Thus, the bottom-line of waste are direct costs. The Toyota philosophy tells that defects should be regarded as opportunities to improve rather than something to be traded off against what is ultimately poor management. Thus defects are seized on for im-mediate kaizen activity (continuous improvement concept) (Hines & Rich, 1997).
The seven wastes that are listed above were tested empirically for two years. It was shown that it was easy to identify waste and propose ways to reduce or eliminate it. However, it was found that there were actually more than seven wastes in the real life of organizations (Hines, et al., 1998). Furthermore, the seven wastes “lacked an ability to take on a more ex-act costing of existing wastes and hence the potential for improvement, and they did not easily represent the human interaction stages of the value stream” (Hines et al., 1998 p.33). Five more wastes were added to cover the lacked functions. They are the following: 1) Power and Energy, 2) Human Potential, 3) Environmental Pollution, 4) Unnecessary Overhead (including training), and 5) Inappropriate Design (Hines et al. 1998).