Automatic speed cameras in Sweden 2002-2003
22
0
0
Full text
(2)
(3) Preface On behalf of the National Police Board (RPS) VTI has evaluated the effects of automatic speed cameras in operation 2002–2003 or at least 2003. Estimates have been made with regard to road safety, speeds and socio-economic effects. The contact person at RPS was Sten Byström. The safety analysis is based on accident data from the Swedish Road Administration (SRA). Speed data has been collected by both SRA (spot speed) and VTI (car following). The analysis has primarily been performed by Gunnar Andersson (project leader). The results has earlier been reported in PM 2004-03-23 ”Automatisk hastighetsövervakning 2002–2003”. Jörgen Larsson has modified and amended the text. Thus the documentation of the project is now completed. Linköping, August 2005. Jörgen Larsson. VTI notat 10A-2004.
(4) VTI notat 10A-2004.
(5) Contents. Page. Summary. 5. 1. Introduction. 7. 2. Enforcement activity. 7. 3 3.1 3.2 3.3. Results Accident and injury development Speed development Socio-economic effects. 9 9 11 15. 4. References. 17. VTI notat 10A-2004.
(6) VTI notat 10A-2004.
(7) Summary The automatic speed camera activity has resulted in a considerable reduction of personal injury accidents and injured persons. The change is statistically significant. The greatest reduction, approximately 50%, is in fatal accidents and fatalities. At the end of 2003, camera boxes were used to enforce speed for 30 sections of road. The total road distance was about 500 km, and the number of camera cabinets was 225. The system consists of fixed pole and cabinets installed at the side of the road. All sections where speed enforcement is undertaken are clearly signed with information about the speed cameras. Speed camera enforcement has resulted in a total of 4,801 photographed vehicles in 2002 and 9,402 vehicles in 2003. Motorcycles and emergency vehicles that make up about 2% of the traffic are not included. The number of approved photos was 2,565 during 2002 and 6,073 during 2003. The proportion of approved photos and contacts with the vehicle drivers has thus increased from 53% to 65%. Nearly the entire decrease in unsatisfactory photos can be attributed to technical defects. The effects of camera enforcement on the average speed have been estimated using the speed measurements before and after the installation of the camera boxes. The enforcement method has resulted in significant speed reductions on the camera monitored sections of road. Great speed reductions are shown both at and between the camera boxes. Speeds can be expected to be reduced at the boxes by about 8 km/h and between the boxes by nearly 5 km/h if the average speed before speed camera enforcement began was 95 km/h. The basis for the effect estimates concerning traffic safety is comprised of the total result from the 14 test stretches that have been in operation in 2002–2003 and the 4 stretches that were monitored by cameras for all of 2003. The total road distance is about 340 kilometres. This automatic speed camera has been an experiment and resulted in a considerable reduction of personal injury accidents and injured persons. The change is statistically significant. The greatest reduction, approximately 50%, is in fatal accidents and fatalities. The number of severely injured persons has been reduced approximately 25%. However, the scope of the study is very limited with respect to accidents and injuries. Thus, the results of the study are very sensitive to random variations so that the conclusions about the magnitude of the changes should provisionally be regarded with caution. The study shows socioeconomic savings of 164 million SEK per year. The costs in the form of investments, operations, and increased travel time total nearly 60 million SEK and savings in the form of reduced costs for personal injuries, vehicles, and the environment make up about 244 million SEK. In the light of this the enforcement method is one of the most cost effective traffic safety measures.. VTI notat 10A-2004. 5.
(8) 6. VTI notat 10A-2004.
(9) 1. Introduction. The first Swedish experiments with automatic speed surveillance started in April 1990 [Nilsson, 1992]. The experiment comprised a total of 16 sections of road. Eight were two-lane rural main roads with a speed limit of 90 km/h and eight were two-lane urban main roads with a speed limit of 50 km/h. The experiment covered a period of two years. After the above mentioned experiment had finished seven camera boxes were installed 1998–1999 between Hudiksvall and Iggesund. The actual automatic speed camera activity began as a new experiment in Sweden during the summer of 2001. The first evaluation covered the time period up to and including the first half of 2002 at 14 sections [Andersson, 2003]. Speed camera enforcement has continued since then and the enforcement method has been successively introduced for new sections of road. The system consists of fixed pole and cabinets installed at the side of the road. All stretches where speed enforcement is undertaken are clearly signed with information about the speed cameras. A limited number of cameras have been used. Therefore the cabinets have often been an empty shell without camera.. 2. Enforcement activity. At the end of 2003, camera boxes were used to enforce speed for thirty sections of road. The total road distance was about 500 km, and the number of camera cabinets was 225. The average distance between the camera cabinets is about 4.5 km in each direction or 3 minutes when the speed is 90 km/h. Of the thirty sections, 14 (covering 270 kilometers) were in operation during all of 2002 and 2003. Four sections, covering 65 kilometers have been in operation the entire year of 2003. The 18 sections of road that has been analyzed according to traffic safety are listed in table 1. Other sections of road totaling 165 kilometers have been put into operation during the fall of 2003. Some of them are included in the speed analysis.. VTI notat 10A-2004. 7.
(10) Table 1 Sections with automatic speed surveillance in operation 2002–2003 or early in the year 2003. Id 02-001. Length Operation Number started (km) of cabinets. County. Road number, Name. Stockholm. 226, Huddingevägen, Stuvsta – Flemingsberg. 7.3. 2002. 9. (November). 05-001. Östergötland. 50, Vadstena – Omberg. 17.6. 2001. 10. 06-001. Jönköping. 659, Hovslätt – Månsarp. 11.5. 2001. 6. 07-001. Kronoberg. 25, Forssa – Kvälleberg. 15.2. 2001. 13. 12-001. Skåne. 21, Kristianstad – Hässleholm. 20.9. 2001. 12. 14-001. Västra Götaland 45, Trollhättan – Lilla Edet, Stallbacka-bron Västra Götaland 40, Borås – Ulricehamn. 13.9. 2002. 8. 2002. 10. 14-003. 36.0. (November). Värmland. E18, Alster – Skattkärr Ö. 5.1. 2001. 6. 18-001. Örebro. E18, Örebro – Karlskoga. 30.5. 2001. 6. 20-001. Dalarna. 70, Brunnbäck – Säter. 41.9. 2001. 8. 20-002. Dalarna. 70, Amsberg – Häradsbygden. 35.1. 2001. 9. 21-001. Gävleborg. E4, Hudiksvall – Iggesund. 6.0. 1999. 7. 22-001. Västernorrland. E4, Bredsand – Njurundabommen. 14.9. 2001. 8. 23-001. Jämtland. E14, Pilgrimsstad – Optand. 23.6. 2001. 7. 24-001. Västerbotten. E12, Umeå – Vännäs. 14.9. 2001. 7. 24-002. Västerbotten. E4, Lillåbron – Bygdeå. 10.0. 2003. 6. 25-001. Norrbotten. 97, Luleå – Boden. 18.6. 2002. 11. 25-002. Norrbotten. E4, Luleå – Piteå. 12.0. 2003. 6. 17-001, 002, 003. 8. VTI notat 10A-2004.
(11) 3. Results. Speed camera enforcement has resulted in a total of 4,801 photographed vehicles in 2002 and 9,402 vehicles in 2003 (table 2). Motorcycles and emergency vehicles that make up about 2% of the traffic are not included. The number of approved photos was 2,565 during 2002 and 6,073 during 2003. The proportion of approved photos and contacts with the vehicle drivers has thus increased from 53% to 65%. Nearly the entire decrease in unsatisfactory photos can be attributed to technical defects. Photos that were unsatisfactory because of poor quality in the photo, camera defects, transfer defects, low flash effect and improperly adjusted instruments have been reduced from 19.1% during 2002 to 5.4% during 2003. Unsatisfactory photos that are due to not being able to identify the driver because of sun reflection or hidden vehicle details made up about 13 % both years. Unsatisfactory photos for other reasons made up 14.5% of all photos in 2002 and 16.7% in 2003. Table 2 Unsatisfactory and approved photos 2002–2003. Code Specification. 2 3–5 6–10 11 12 13 14 15 2–15. Number of photos. 2002 Driver not identified 96 Driver hidden** 529 Technical defects*** 915 Number plate unreadable 84 No number plate 39 Unidentified nation 72 Many vehicles/ overtaking 39 Other defects 462 Sum unsatisfactory photos 2236. 2003 158 1097 508 88 79 237 108 1054 3329. Approved photos All* photos. 6073 9402. 2565 4801. Proportion of Proportion of all* photos unsatisfactory % % 2002 2003 2002 2003 2.0. 1.7. 4.3. 4.7. 11.0. 11.7. 23.7. 33.0. 19.1. 5.4. 40.9. 15.3. 1.7. 0.9. 3.8. 2.6. 0.8. 0.8. 1.7. 2.4. 1.5. 2.5. 3.2. 7.1. 0.8. 1.1. 1.7. 3.2. 9.6. 11.2. 20.7. 31.7. 46.6. 35.4. 53.4 100. 100. 100. 64.6 100. * Motorcycles, emergency vehicles and control photos excluded. ** By rear view mirror/sun shield/windscreen wiper. *** Poor photo quality/camera defects/transfer defects/low flash effect/ improperly adjusted instruments.. 3.1. Accident and injury development. The calculations of traffic safety effects are based on the roads that had speed camera enforcement during 2002–2003 or all of 2003. The comparison period is for roads with camera boxes both in 2002 and 2003, the years 1995–1999. For roads that only had camera boxes in 2003 the comparison period is 1997–2001. On the assumption that accident and injury development is changed in proportion to traffic changes if other factors are unchanged, the number of accidents and injured people has been recalculated taking into consideration the increase in traffic that occurred during the research period relative to the comparison periods. The traffic increase during 2002–2003 is 11% compared to the 1995–1999 period and 9% in 2003 compared to 1997–2001. The tables and. VTI notat 10A-2004. 9.
(12) figures below show the average accidents and injuries per year, taking traffic changes into consideration. Table 3 Number of personal injury accidents and injured persons before and with speed camera enforcement. Average before. With camera. Confidence interval at 95% level. Fatal accidents Severe accidents Minor accidents Total of accidents. 9.2 32.6 102.8 144.6. 4.5 22.6 81.9 109.1. 6.7 – 11.7 22.5 – 42.7 93.3 – 112.3 123.6 – 165.6. Fatalities Severely injured Minor injured Total injured. 12.6 49.0 180.0 241.6. 5.4 35.7 153.3 194.5. 7.8 – 17.4 28.9 – 69.1 154.7 – 205.3 198.3 – 284.9. As the table shows, the scope of the study is very limited with respect to accidents and injuries. Thus, the results of the study are very sensitive to random variations so that the conclusions about the magnitude of the changes should provisionally be regarded with caution. The overall results during the study period report a reduced number of personal injury accidents and injured persons. In both cases the reduction is statistically significant. The distribution of accidents and injured persons by degree of injury shows that all groups were reduced. The change is statistically significant with the exception of severe accidents and severely injured people. The results report a very strong change in the distribution of both accidents and injured persons to the extent of injury. The greatest reduction is in fatal accidents and fatalities. It may be a coincidence and a consequence of the limited scope of the study, that the relative reduction is greater when the degree of injury is more severe. Another explanation may be that camera enforcement has a relatively greater effect on the most severe accidents and personal injuries by reducing the highest speeds in the speed distribution the most. The hypothesis should be tested using continued follow-up of the camera enforcement. Figure 1 shows the relative change in the average number of accidents and injured people per year on the road sections that had camera speed enforcement. For comparison, the figure also shows corresponding relative changes for the rural roads (Source: SIKA (Swedish Institute for Transport and Communications Analysis) and SCB (Statistics Sweden) that are not monitored by speed cameras. The calculations are based on the time period corresponding to the calculations for the camera enforced roads. Traffic development has also been taken into consideration for the rural roads without speed cameras. As the comparison shows, the traffic safety effect on the camera enforced roads is very great.. 10. VTI notat 10A-2004.
(13) 20 8.6. 7.6. 10. 4.5. 3.2. 7.9. 2.9. Change in percent (%). 0 -4.1. -10. -8.6 -14.8. -20. -19.5. -20.3 -24.5. -30. -27.1. -30.6. -40. Roads with speed cameras. -50 -50.7. All other roads. -60. -56.8. -70 Fatal accident. Severe injury Slight injury accident accident. All injury accidents. Fatalities. Severely injured. Slightly injured. All injured. Figure 1 Percentage changes in accidents and injured people on sections with speed camera enforcement and other rural roads.. 3.2. Speed development. The effects of camera enforcement on the average speed have been estimated using the speed measurements before and after the installation of the camera boxes. The speed measurements were taken by the Swedish Road Administration as point measurements at the camera cabinets and between the camera cabinets. VTI measured speed progress for five stretches in both directions by following passenger cars. There is also car following data in one direction for an additional stretch of road. The measurements were taken by the Swedish Road Administration. The enforcement method has resulted in significant speed reductions on the camera monitored sections of road. Great speed reductions are shown both at and between the camera cabinets. Figures 2 and 3 show that the higher the average speed before the study, the more the average speed decreased during the study.. VTI notat 10A-2004. 11.
(14) Mean speed with camera enforcement (km/h). 110. 105. 100. 95. 90. 85 y = 0,4239x + 46,237 2 R = 0,6151. 80. 75 75. 80. 85. 90. 95. 100. 105. 110. M e an spe e d be fore (km/h). Figure 2 Average speeds before and with camera enforcement at the measuring points at the camera cabinets.. 12. VTI notat 10A-2004.
(15) 110. Mean speed with camera enforcement (km/h). 105. 100. 95. 90. 85. y = 0,6013x + 33,198. 80. 2. R = 0,7244. 75 75. 80. 85. 90. 95. 100. 105. 110. M e an spe e d be fore (km/h). Figure 3 Average speeds before and with camera enforcement at the measuring points between the camera cabinets. The relationship between average speeds during the study and the average speeds before the study are very strong. Table 4 below shows the estimated average speeds and the changes in speed at, and between, the cabinets when the average speed in the test sections of road before the set up of camera cabinets was considered. The estimates are based on the estimated regression connection that is shown in figures 2 and 3. Table 4 Estimated average speeds on sections with camera enforcement with respect to average speed on sections before camera installation, speed limit 90 km/h. Average. Estimated average speed. Change in speed. Difference,. speed (km/h). (km/h) with camera. (km/h). at cabinet –. before automatic. enforcement. speed camera. At cabinet. enforcement. between Between. At. Between. cabinets. cabinets. cabinet. cabinets. (km/h). 80. 80.1. 81.3. 0.1. 1.3. -1.2. 85. 82.3. 84.3. -2.7. -0.7. -2.0. 90. 84.4. 87.3. -5.6. -2.7. -2.9. 95. 86.5. 90.3. -8.5. -4.7. -3.8. 100. 88.6. 93.3. -11.4. -6.7. -4.7. 105. 90.7. 96.3. -14.3. -8.7. -5.6. VTI notat 10A-2004. 13.
(16) As the table shows speeds can be expected to be reduced at the cabinets by just over 8 km/h and between the cabinets by nearly 5 km/h if the average speeds before speed camera enforcement began was 95 km/h. If the average speed was 85 km/h before the camera activity started, that is 5 km/h lower than the speed limit, the speed at the cabinet is expected to be reduced by barely 3 km/h. The reduction between the cabinets is measurable, about 0.5 km/h. As the table shows, drivers reduce their speed more at the cabinets than between them. The higher the average speed before the speed camera enforcement started, the greater the increase in difference. The speed comparisons at and between cabinets in the evaluation that was made on the activity during the second half of 2001 and the first half of 2002 showed a fairly constant difference, 2.5 km/h regardless of the speed level before [Andersson, 2003]. Analysis of the results of the evaluation based on the 2001–2002 period and the results mentioned above show that the speeds at the cabinets in the above calculations decreased more than during the previous evaluation when the speeds were higher, before the camera monitoring began. Between the cabinets the current and previous figures of changes in speed differed very little. The current figures indicate a somewhat greater speed effect at the cabinet on the roads with high average speeds before the speed camera enforcement and for the most part the same effect between the cabinets as during the previous evaluation. The somewhat higher mean speed observed between the cabinets cannot for the present be regarded as “kangaroo driving”. As shown in figure 4 the driving sequence during camera enforcement is parallel to the situation before.. Average speed 2000. Average speed 2003. Speed limit. Camera. 110. Speed km/h. 100. 90. 80. 70. 60 0. 1. 2. 3. 4. 5. 6. 7. 8. 9 10 11 12 13 14 15 16 17 18 19 20 21 22 23 24 25 Distance km. Figure 4 Average speeds on national road 97 from Luleå to Boden without (2000) and with (2003) speed camera enforcement.. 14. VTI notat 10A-2004.
(17) 3.3. Socio-economic effects. The basis for the effect estimates is comprised of the total result from the 14 test sections that have been in operation in 2002–2003 and the 4 sections that were enforced by speed cameras for all of 2003. The total road distance is about 340 kilometers. The calculations are based on the changes in the average number of injured persons per year during the study period compared to the average for the corresponding time period five years before the study. The average traffic flow per day has been estimated as the average value of the stated interval values for the respective stretches. The number of vehicle kilometers has been estimated for 2003. The Swedish Road Administration’s estimated values [VV, 1999:170] were used in calculating the traffic costs (police reported accidents) and travel time costs. The values for fatalities, severely injured, and those with minor injuries are given as: 14,300,000, 6,200,000, and 360,000 SEK respectively. The change in travel time costs is based on the time value 120 SEK/h that is intended for transport in passenger cars, taking the number of passengers and the type of tasks into consideration. Speed related costs for calculating vehicle and environmental costs relate to passenger cars. The vehicle costs consist of gas consumption and wear and tear on tires. The environmental costs consist of the release of nitrogen (NOx), hydrocarbons (HC) and carbon dioxide (CO2). Table 5 presents results from a program developed at VTI [Hammarström & Karlsson, 1994]. Table 5 Speed related costs for vehicle and environmental factors. SEK / vehicle kilometers Speed km/h 88.0 91.5. Wear and tear on tires. Gas. NOx. HC. 0.1217 0.1412. 0.1981 0.2020. 0.0341 0.0356. 0.0084 0.0092. CO2. 0.2505 0.2554. The speed values that are used for calculating the travel time costs, vehicle costs, and environmental costs are related to passenger cars in the measuring point at the speed limit of 90 km/h. This data does not allow estimates of the number of vehicle kilometers at speed limits of 70 and 50 km/h. The relationship is deemed to affect the calculations marginally because the speed limits of 90 km/h make up the predominant portion of the completed number of vehicle kilometers. The speed changes on roads with the speed limits of 50 and 70 km/h are primarily the same as on roads with the speed limit 90 km/h. The average speed on roads studied was estimated at 91.5 km/h before the study, and 88 km/h with the speed camera enforcement. The traffic amount is estimated at 954.4 million vehicle kilometers. The investment costs for completing the study have been estimated for the camera installations (cabinet and electricity) and the control system (radar, camera, and computers). The average cost for the camera installation is 100,000 SEK according to information from the National Police Board and for one camera system it is 284,000 SEK. The calculation is based on 225 installations. VTI notat 10A-2004. 15.
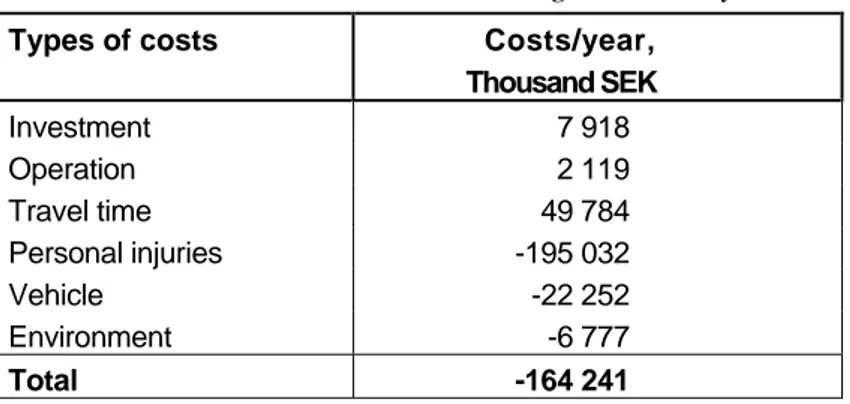
(18) and 30 camera systems. The depreciation period is five years and the cost of capital is 5%. The calculation of operating costs is based on time costs for police personnel, average evaluation period per report, estimated travel time to and from the installations and the number reported during the study. The results of the socioeconomic calculations are summarized in table 6. Table 6 Socio-economic costs according to the study. Types of costs Investment Operation Travel time Personal injuries Vehicle Environment Total. Costs/year, Thousand SEK 7 918 2 119 49 784 -195 032 -22 252 -6 777 -164 241. The study resulted in a combined socioeconomic saving of 164 million SEK per year. The costs in the form of investments, operations, and increased travel time total nearly 60 million SEK and savings in the form of reduced costs for personal injuries, vehicles, and the environment make up about 244 million SEK. Benefit/cost quota in the study is 3.7. The socioeconomic gains from the study are thus slightly more than 270%. In the light of this the enforcement method is one of the most cost effective traffic safety measures.. 16. VTI notat 10A-2004.
(19) 4. References. Andersson, G: Automatisk hastighetsövervakning – Resultat från försöksverksamheten. Swedish Road and Transport Research Institute, VTI, PM 2003-01-03, Linköping, Sweden. 2003. Andersson, G: Automatisk hastighetsövervakning 2002–2003. Swedish Road and Transport Research Institute, VTI, PM 2004-03-23, Linköping, Sweden. 2004. Hammarström, U & Karlsson, B: Fordonskostnader och avgasemissioner för vägplanering (EVA). Swedish Road and Transport Research Institute, VTI notat T150-1994, Linköping, Sweden. 1994. SIKA: Översyn av samhällsekonomiska kalkylprinciper och kalkylvärden på transportområdet: ASEK, redovisning av regeringsuppdrag. SIKA Rapport 1999:6, Stockholm, Sweden. 1999. Nilsson, G: Försök med automatisk hastighetsövervakning 1990–1992. Swedish Road and Transport Research Institute, VTI rapport 378, Linköping, Sweden. 1992. Vägverket: Samhällsekonomiska kalkylvärden planeringsomgång 2002–2011. Swedish Road Administration, Publikation 1999:170, Borlänge, Sweden. 1999.. VTI notat 10A-2004. 17.
(20) VTI notat 10A-2004.
(21)
(22) www.vti.se vti@vti.se. VTI är ett oberoende och internationellt framstående forskningsinstitut som arbetar med forskning och utveckling inom transportsektorn. Vi arbetar med samtliga trafikslag och kärnkompetensen finns inom områdena säkerhet, ekonomi, miljö, trafik- och transportanalys, beteende och samspel mellan människa-fordon-transportsystem samt inom vägkonstruktion, drift och underhåll. VTI är världsledande inom ett flertal områden, till exempel simulatorteknik. VTI har tjänster som sträcker sig från förstudier, oberoende kvalificerade utredningar och expertutlåtanden till projektledning samt forskning och utveckling. Vår tekniska utrustning består bland annat av körsimulatorer för väg- och järnvägstrafik, väglaboratorium, däckprovningsanläggning, krockbanor och mycket mer. Vi kan även erbjuda ett brett utbud av kurser och seminarier inom transportområdet. VTI is an independent, internationally outstanding research institute which is engaged on research and development in the transport sector. Our work covers all modes, and our core competence is in the fields of safety, economy, environment, traffic and transport analysis, behaviour and the man-vehicle-transport system interaction, and in road design, operation and maintenance. VTI is a world leader in several areas, for instance in simulator technology. VTI provides services ranging from preliminary studies, highlevel independent investigations and expert statements to project management, research and development. Our technical equipment includes driving simulators for road and rail traffic, a road laboratory, a tyre testing facility, crash tracks and a lot more. We can also offer a broad selection of courses and seminars in the field of transport.. HUVUDKONTOR/HEAD OFFICE. LINKÖPING POST/MAIL SE-581 95 LINKÖPING TEL +46(0)13 20 40 00 www.vti.se. BORLÄNGE POST/MAIL BOX 760 SE-781 27 BORLÄNGE TEL +46 (0)243 446 860. STOCKHOLM POST/MAIL BOX 6056 SE-171 06 SOLNA TEL +46 (0)8 555 77 020. GÖTEBORG POST/MAIL BOX 8077 SE-402 78 GÖTEBORG TEL +46 (0)31 750 26 00.
(23)
Figure


+5


Related documents
Low frame rate of feature tracking cameras (which led to substantial image noise and object detection issues) was identified as a problem in this research..
Variable speed limits mean that the maximum permitted speed is not always the same, but changes depending on the traffic situation.. Variations of this method are being
There are three main types of systems used for supporting custom engineered products (Elgh, 2011) which, are either based on the configuration of a set of predefined product
The effects of currency movements using the moving average method may result in a change in inventory value for every new purchase that the company
Eftersom lärare B nämnde att kraven i matematik har sänkts, frågar jag henne följande fråga: Intervjuare: men tror du att kraven har sänkts för att eleverna inte når upp
Då det även förekom att informanterna ansåg sig kunna känna av om sjuksköterskan ville väl blir frågan om viljan att göra väl är en förutsättning för god vård och kanske
Key words: constructed wetland, free water surface flow, wastewater treatment, Kenya, Sweden, vegetation, harvest, Cyperus papyrus, Echinochloa pyramidalis, mass load,
ANOVAn visade en tendens till signifikant interaktionseffekt för variablerna alkohol och nedstämdhet vad gäller social ångest hos tjejer (F(1, 164)=2,60, p=,108), där de tjejer
