Mälardalen University
School of Sustainable Development of Society and Technology Master’s degree project
Master Program: Quality in Process Technology
Examiners: Dr. Sven Hamp & Dr. Lena Johansson Westholm Supervisor: Professor Dr. Erik Dahlquist
Spring Semester, 2011
Mapping and analyzing Ventilation system in
University building
Possavee Thummakul Sadaqat Ali
2
Abstract
The Threshold Limit Value for 8-hour time-weighted-average exposures to CO2 is 5,000 ppm.
Currently, the American Society of Heating, Refrigeration, and Air-conditioning Engineers recommends a minimum office building ventilation rate offices of 10 Ls-1 per person, corresponding to an approximate steady state indoor concentration of 870 ppm based on the assumptions that outdoor CO2 is 350 ppm and indoor CO2 generation rate is 0.31 Lmin-1 per person. The purpose of
this project is to study the current state of ventilation system in 2 computer rooms of MDH university building. We will measure carbon dioxide concentration and temperature variations inside these rooms. At the moment, the system is working as on/off control. We will investigate that whether this kind of control is effective or not. We will also take into account all kinds of heating sources available in the room in different positions and climatic conditions.
In this project, we measure the room temperature and carbon dioxide contained in room by using thermocouple and carbon dioxide transmitter respectively. This data is collected and recorded by using data logger and easy view program. The last step is to make graphs for the measurements in the room to see the variations in different parts of the room and then analyze them to make some recommendations for the existing operating conditions.
3
Acknowledgement
This Master degree project was possible with the guidance and support of several individuals, who in one way or the other provided their valuable assistance throughout the preparation and completion of this study.
First of all, we would like to thank Mälardalen University, Västerås Sweden for providing us an environment to work in on our project, along with our supervisor Professor Erik Dahlquist, whose sincerity and encouragement was an inspiration to work on this study.
We are also thankful to Sven Hamp and Lena Johansson Westholm, our instructors for the course for their kind concern and providing us moral support in completion of the study.
Finally, we would like to thank our family that is supporting us from the start till end of our Master program in Sweden
.
4
Table of Contents
Abstract ... 2 Acknowledgement ... 3 1. Introduction ... 5 1.1. Objective ... 6 1.2. Methodology ... 61.3. Preliminary Project plan ... 6
2. Background and Literature review ... 7
2.1 Ventilation in air conditioning space ... 7
2.2 Heat transfer to the air conditioning space ... 7
2.2.1 Heat transmission through walls, ceilings, floor and windows ... 8
2.2.2 Solar radiation through glass windows ... 8
2.2.3 Lighting ... 8 2.2.4 Equipment ... 9 2.2.5 People ... 9 2.3 Heat Transfer ... 10 2.3.1 Conduction ... 10 2.3.2 Convection ... 11 2.3.3 Radiation ... 12
3. Materials and Methods ... 14
4. Experiments results and data analysis ... 17
4.1 Carbon dioxide contents in air conditioning space ... 17
4.1.1 Graphs for CO2 contents varying by time ... 17
4.2 Air Conditioning Space Temperature ... 20
4.2.1 Graphs for temperature varying by time ... 20
4.3 How the Ventilation system in MDH building works? ... 23
5. Discussion and Conclusion ... 24
6. Recommendations ... 25
7. Bibliography ... 26
5
1. Introduction
All closed places need ventilation. Ventilation system is the system that is used for exchanging indoor air with outdoor air for reduced moisture, odor, and other pollutants and is used for controlling indoor air temperature. To ensure enough ventilation, the American Society of Heating, Refrigerating and Air-Conditioning Engineers, Inc. says that “the living area should be ventilated at a rate of 0.35 air changes per hour or 15 cubic feet per minute (cfm) per person, whichever is greater”. (WHOLE-HOUSE VENTILATION SYSTEM). This can be illustrated in the figure shown below:
Figure 1.1 Airflow in room (The GSW office block )
The purpose of this project is to investigate how the ventilation system in MDH building is working. To do this, temperature and carbon dioxide is logged in the room as a function of time. Simultaneously measurements are performed on how many computers are on, how many persons are in the room, flow and temperature of the air and hot water fed to the room and similar data. Also outdoor temperature, sunshine intensity and similar is measured and stored on the central computer, while the local measurements are stored in a local computer.
Local measurements of temperature are also made inside the room at different positions to get a picture of the temperature distribution. Local airflow in the room is also measured at the same time. The loggers are used for recording temperature and CO2, and the data is stored using Easy View
program. The central logger stores data measured around the rooms. The work could be split into following parts:
- Measurements of CO2 and temperature using the instruments listed in Appendix A.
6
1.1. Objective
The objective of this project is:
-To investigate how the ventilation system in MDH building is working.
-To investigate how the temperature and CO2 contents vary by time with the existing system.
-To improve the process of Ventilation system in the building
.
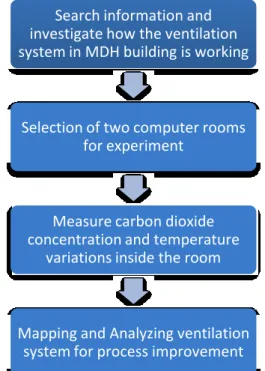
1.2. Methodology
Figure 1.2 Methodology of the Project
1.3. Preliminary Project plan
The project is divided into three main tasks of measurements, analysis and conclusion. The first part is the measurement along with literature review. Secondly, the data obtained is analyzed for any required improvements in the process. At last, we address the issue of quality and suggest appropriate controls to optimize the process
.
Search information and investigate how the ventilation system in MDH building is working
Selection of two computer rooms for experiment
Measure carbon dioxide concentration and temperature
variations inside the room
Mapping and Analyzing ventilation system for process improvement
7
2. Background and Literature review
Any combination of temperature and relative humidity falling within comfort zone is expected to maintain comfortable conditions for majority of occupants. Unless otherwise specified, inside condition of 24 °C 1 °C, 50 – 60 % RH (RH is Relative humidity) and air movement of 4.5 to 7.5 m/min are satisfactory for comfort cooling applications. (Aphornrathana,2007)
2.1
Ventilation in air conditioning space
Ventilation of outdoor air with the air already in the building can be divided into two broad classifications: Ventilation and Infiltration. (Aphornrathana, 2007)
Ventilation air is the air used to provide acceptable indoor air quality. Ventilation of certain amount of outside fresh air into the air conditioned space is also absolutely necessary, to replace the oxygen consumed and to dilute the concentration of carbon dioxide and pollutants like bacteria, fungus growth, viruses, cigarette smoke, carbon monoxide from outside air, hydrocarbons from building material, and etc. These contaminants in the air can cause health problems. Therefore, it is necessary to reduce the contaminations’ level within safe limits. (Aphornrathana, 2007)
Infiltration air is the flow of outdoor air into the building through cracks and other unintentional opening and through the normal use of exterior doors for entrance and egress. Infiltration is also known as air leakage into the building. (Aphornrathana, 2007)
2.2
Heat transfer to the air conditioning space
The air inside the air conditioning space receives heat from -Heat transmission through walls, ceilings, floor and windows. -Solar radiation through glass windows.-Lightings. -Equipments. -People
.
8
2.2.1 Heat transmission through walls, ceilings, floor and windows
Heat transmission through walls, ceilings, floor and windows caused by heat conduction can be estimated from:
Q
trans= U
.
A
.
CLTD
(Equation 2.1)Where,
= Heat gain through the wall or ceiling (W) U = Overall heat transfer coefficient (W/m2. K)
A = Area of roof, wall or ceiling (m2)
CLTD = Corrected cooling load temperature difference (°C)
2.2.2 Solar radiation through glass windows
Radiation energy from the sun passing through transparent material such as glass window becomes a heat gain to the room. Its value changes with time, orientation and shading. The heat gain through a glass window can be estimated from:
Q
glass= GLF
.
A
glass (Equation 2.2)Where
= Heat gain through glass window (W) GLF = window glass load factor (W/m2)
A glass = area of the glass (m2)
2.2.3 Lighting
The energy emitted by the lights is in the form of radiation that is absorbed in the space. The absorbed energy is later transferred to the air by convection. The primary source of heat from light comes from the light emitting elements (lamps), although significant additional heat may be generated from associated components in the light fixtures housing such as lamps. Generally, the instantaneous rate of heat gain from electric lighting can be calculated from:
Q
lightings= Watts
.
F
u.
F
s (Equation 2.3)Where
Q
lig htin gs= Heat gain from lighting (W)
W at t s = Total installed light wattage (W)
Fu = Use factor
Fu = Special allowance factor
Qt r a n s Qg l a s s
F
s9 The total light wattage is obtained from the rating of all lamps installed. The Use factor is the ratio of the wattage in use for the conditions under which the load estimate is being made to the total installed wattage. For example, for a space where the lights are on 24 hours a day, the Use factor value of 1.0 will be used. The special allowance factor is for fluorescent fixture. It accounts for ballast; typical value of 1.25 is normally used.
2.2.4 Equipment
The load from equipment is normally found directly from the manufacturer or the name plate data. Most of electrical equipments or machines produce solely sensible heat such as motors, television and computer. However, some equipment may produce both sensible and latent heat such as coffee – machine, toasters and microwave ovens. The heat output from such equipments result from the conversion of the electrical energy to heat. (Aphornrathana, 2007). Table 2.1 shows the latent and sensible heat loads for different components. It is to be noticed from the table that only coffee machine and toaster are the sources of latent heat.
Table 2.1 Typical heat gain rate for electrical equipments (Aphornrathana, 2007)
Equipment Heat load (W)
Sensible Latent Television set 50-100 Refrigerator 100-200 Personal computer 50-200 Laser printer 150-300 Photocopy machine 150-300 Coffee machine 300 150 Microwave oven 600-1400 Toaster 700 900 2.2.5 People
The heat gain from people is composed of two parts, sensible heat and the latent heat resulting from perspiration. The rate of the heat gain from people depends on their physical activities. (Aphornrathana, 2007). The following table shows the latent and sensible heat gains for different physical activities of human beings starting at rest to physical work. The sensible and latent heat gains increase, as the activity of person increases, thus aiding to gain in heat load.
Table 2.2 Normal heat gain values from occupants (Aphornrathana, 2007)
Activity Heat load (W)
Total Sensible Latent
Seated at rest 100 70 30
Seated, light office work
120 75 45
Standing or walking slowly
145 75 70
Light physical work 250 90 160
10
2.3
Heat Transfer
Heat transfer is energy in transit, which occurs as a result of temperature gradient or difference. This temperature difference is through a driving force that causes heat to flow. Heat transfer occurs by three basic mechanisms or modes: Conduction, Convection and Radiation.(Aphornrathana,2007)
2.3.1 Conduction
Heat conduction generally takes place in solids; through it may occur in fluids without bulk motion or with rigid body motion. In fluid, conduction is due to the collision of the molecules during their random motion. In solids, it is due to the combination of vibrations of molecules in a lattice and the energy transport by free electrons. (Aphornratana, 2006). Figure 2.1 shows conduction taking place in solids, and also different parameters that affect heat conduction through solids.
Figure2.1 Heat conduction through the wall (Aphornratana, 2006)
It is observed that the rate of heat conduction (q) through a wall with constant thickness is proportional to the temperature difference (T2 – T1) between the surfaces and the area normal to
heat flow direction (A) and is inversely proportional to the thickness of the wall (X). (Aphornratana, 2006).
(Equation 2.4)
Where,
k is thermal conductivity of the wall’s material (W/ m. K) A is cross – sectional area of the wall (m2)
L is the thickness of the wall (m)
T 2, T 1 is surface temperature of the wall (°C)
So, the heat conduction increases by increasing the area normal to heat flow, while decreases by increasing the wall thickness. The thermal conductivities of different materials at 27°C is shown in Table 2.3
q k A
T
2 T
111 Table 2.3 Thermal conductivity of common material at (300K) (Aphornratana, 2006)
Material K ( W / m . K ) Silver (pure) 427 Copper (pure) 399 Gold 316 Stainless steel (316) 14.4 Glass 0.81 Concrete 0.128 Fiberglass wool 0.040 Air 0.0262 Water 0.540 Wood 0.17 2.3.2 Convection
Convection is the mode of heat transfer between a solid surface and the adjacent fluid that is in motion, and it involves the combined effect of conduction and fluid motion. The faster the fluid motion, the greater the convection heat transfer. In the absence of any bulk fluid motion, heat transfer between a solid surface and the adjacent fluid is by pure conduction. The presence of bulk motion of the fluid enhances the heat transfer between the solid surface and the fluid. (Aphornratana, 2006)
Convection is called forced convection if the fluid is forced to flow over the surface by external means such as a fan, pump or the wind. In contrast, convection is called natural or free convection if the fluid motion is caused by buoyancy force that is induced by density difference due to the variation of temperature in the fluid. (Aphornratana, 2006). Heat transfer from a solid surface can be obtained from:
(Equation 2.5) Where,
is convection heat transfer coefficient (W/m2.K) A is heat transfer area (m2)
T w is surface temperatures of the wall (°C)
T is the bulk fluid temperature (°C)
The convection heat transfer coefficients for forced and natural convection are listed in Table 2.4
q h
c A T
w T
hc
12 Table 2.4 Typical values of convective heat transfer coefficient (Aphornratana, 2006)
Type of convection h ( W / m2 . K ) Natural convection (air) 5-15
Natural convection (water)
500-1000 Force convection (air) 10-200 Force convection (oil) 20-2000
Force convection (water) 300-20000 Water boiling 3000-100000 Water condensing 5000-10000 2.3.3 Radiation
Radiation is the energy emitted by matter in the form of electromagnetic waves as a result of changes in the electronic configuration of the atoms or molecules. Unlike conduction and convection, the transfer of energy by radiation does not require the presence of an intervening medium. In fact, energy transfer by radiation is the fastest (at the speed of light) and it suffers no attenuation in a vacuum. This is exactly how the energy of the sun reaches the earth. (Aphornratana, 2006)
The maximum rate of radiation which can be emitted from a surface at an absolute temperature (T s)
is given by the Stefan – Boltzmann law as:
(Equation 2.6)
Where σ = 5.67 x 10 -8
W/ m2. K4 is the Stefan – Boltzmann constant and is the emissivity of the surface. An idealized surface, which emits radiation at a maximum rate, =1, is known as a blackbody. The radiation emitted by actual surfaces is less than that emitted by the black body. The value of in the range 0 1, is a measure of how closely a surface approximates a blackbody. The emissivity value of different materials at 27°C is listed in Table 2.5, which shows that emissivity is maximum for soil after wood and is the least for Aluminium foil.
Table 2.5 Emissivity of common materials at 300K (Aphornratana, 2006) Material Aluminum foil 0.07 Anodized aluminum 0.82 Polished copper 0.03 Polished gold 0.03 Polished silver 0.02 Polished stainless-steel 0.17 Black paint 0.98 Water 0.96 White paint 0.90 White paper 0.92-0.97 Wood 0.82-0.92 Soil 0.93-0.96 qemit
ATs4
13 Another important radiation property of a surface is its absorptivity ( ), which is the fraction of the radiation energy incident on a surface, which is absorb by the surface. Like emissivity, its value is in the range 0 1. A blackbody absorbs the entire radiation incident on it. That is, a blackbody is a prefer absorber ( =1) as well as a perfect emitter. In practical, and are assumed to independent from temperature and wavelength of the radiation. The average absorptivity of a surface is taken to be equal to its average emissivity. The rate at which a surface absorbs radiation is determined from: (Aphornratana, 2006)
q
a bs qi n c (Equation 2.7)
Where
qinc is the rate at which radiation is incident on the surface: For nontransparent surface, the portion of incident radiation not absorbed by the surface
The difference between the rates of radiation emitted by the surface and the radiation absorbed is the net radiation heat transfer. If the rate of radiation absorption is greater than the rate of radiation emission, the surface is said to be gaining energy by radiation. (Aphornratana, 2006)
14
3. Materials and Methods
This part includes the way of calculating and recording the data. In this project, we measured room temperature and CO2 contents in two computer rooms by using thermo couple and CO2 transmitter
with the help of data logger and easy view program.
A thermocouple is a junction between two different metals that produces a voltage related to a temperature difference. Thermocouples are widely used sensors for the temperature measurement. The thermocouple that we have used in our experiments is Thermocouple Metal sheathed probe with molded standard connector Model 8102000 from pentronic
.
Figure 3.1 Pentronic Thermocouple
Carbon dioxide transmitter is the measurement instrument used for measuring Carbon dioxide. In our experiments, we have used aSENSE Carbon dioxide transmitter.
Figure 3.2 aSENSE Carbon dioxide transmitter
Data loggers are electronic devices that record data over time either with a built in sensor or via external sensors. (Wikipedia data logger). The data logger that we used in this project is PC-logger 2100 from INTAB. PC-logger 2100 is a complete and versatile data logger with 8 analog inputs, 3 pulse counters, an alarm output and 220kB memory.
15 From Quality perspective of this project, different parameters were taken into account during the whole project, considering it to be a Process Improvement. The four phases of Process Improvement are:
Understanding the process. Measuring the process. Analyzing the process. Improving the process.
The first step in the Process Improvement is the understanding of the current state of the ventilation system. An understanding of how the system is working in the building is the first step towards the improvement phase. So, the system was fully looked into, to understand the process.
The second phase of Process Improvement is measuring the process. It was done by taking into account the main factors that are involved in the process. These are temperature and carbon dioxide concentrations in the rooms. Also, the different parameters affecting the measurements and data are also considered. The parameters taken into consideration were:
The climatic conditions.
The effect of different parameters like the number of people and the computers that are on during the experiments for temperature and carbon dioxide measurements.
Repetition of experiments on different positions in the room to get a broad aspect of measurements and quality data for analyzing the current state of the process.
The computer rooms consist of twenty computers each and the labs are more or less full during the day time from 9:00 am till 4:00 pm. The number of people and the numbers of computers that are on during the measurements are also considered into account, as both are a source of load gain in the computer rooms. The computers are a source of heat gain and rise of temperature in the room. The numbers of people are aiding in the increase of carbon dioxide concentration, and are also a source of heat gain. At the time of measurements, the number of people in the rooms was 12 to 15,
Continuous Process Improvement
Under
stand
Process
Measure
Process
Analyze
Process
Improve
Process
16 as the number of students frequently changed during the measurements. The number of computers that were on during the measurements was 10 to 12. So, these were aiding in the rise of temperature, as the heat emitted through them was increasing the temperature inside the room. The climatic conditions were also taken into consideration and the measurements were made both for winter and spring season. The outside temperature during spring was 16 to 20°C while it was 3 to 8°C during winter, when the experiments were performed. These weather conditions help a lot in making improvements in the process.
The experiments were also repeated for different positions in the room to get quality data. The results show that there was variation in the temperature and carbon dioxide concentrations at different positions and it helped a lot in drawing the conclusions.
At last, graphs are drawn for the measurements and viewed for the variations in the temperature and carbon dioxide contents at different positions in the rooms. Finally, analyzing of this data from the graph is done for the improvements in the existing operating conditions
.
17
4. Experiments results and data analysis
4.1
Carbon dioxide contents in air conditioning space
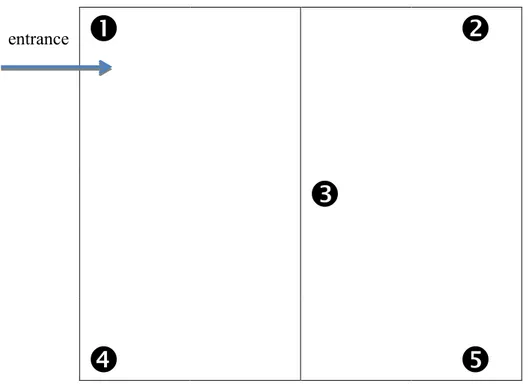
In this part, we have measured carbon dioxide contents in computer room 1 and computer room 2 using Carbon dioxide transmitter (Appendix A) at different positions shown in figure 4.1.
entrance
Figure 4.1 Computer rooms’ layout and positions where CO2 is measured
4.1.1 Graphs for CO2 contents varying by time
In this part, the graph between CO2 contents for different positions within the rooms is plotted. The
carbon dioxide contents were measured for both the rooms during winter and spring to analyze the effect of the climatic conditions on the concentrations of carbon dioxide. Moreover, the number of people in the rooms is also accounted for, as the human is a source of carbon dioxide production within the rooms.
The computer rooms consist of twenty computers each and the labs are more or less full during the day time from 9:00 am till 4:00 pm. At the time of measurements, the number of people in the rooms was 12 to 15, as the number of students frequently changed during the measurements.
18
Graph for Carbon dioxide during winter
Figure 4.2 CO2 contents in Computer room1 varying by time during winter
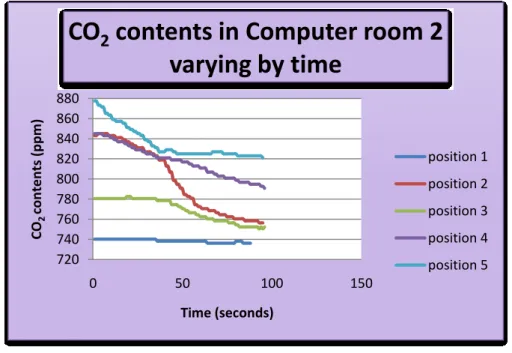
Figure 4.3 CO2 contents in Computer room2 varying by time during winter
355 405 455 505 555 0 20 40 60 80 100 120 CO 2 co n te n ts (p p m ) Time ( seconds)
CO
2
contents in Computer room1
varying by time
position 1 position 2 position 3 position 4 position 5 720 740 760 780 800 820 840 860 880 0 50 100 150 CO 2 co n te n ts (p p m ) Time (seconds)CO
2
contents in Computer room 2
varying by time
position 1 position 2 position 3 position 4 position 519
Graph for Carbon dioxide during spring
Figure 4.4 CO2 contents in Computer room1 varying by time during spring
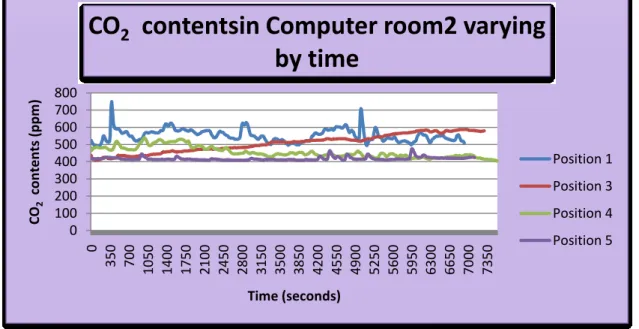
Figure 4.5 CO2 contents in Computer room2 varying by time during spring
0 100 200 300 400 500 600 700 800 0 350 700 1050 1400 1750 2100 2450 2800 3150 3500 3850 4200 4550 4900 5250 5600 5950 6300 6650 7000 7350 CO 2 co n te n ts (p p m ) Time (seconds)
CO
2
contentsin Computer room2 varying
by time
Position 1 Position 3 Position 4 Position 5 0 200 400 600 800 1000 1200 0 410 820 1230 1640 2050 2460 2870 3280 3690 4100 4510 4920 5330 5740 6150 6560 6970 CO2 c o n te n ts (p p m ) Time (seconds)C02 contents in Computer room1
varying by time
Position 1 Position 3 Position 2 Position 5
20
4.2
Air Conditioning Space Temperature
In this part we have measured air conditioning space temperature in computer room 1 and computer room 2 using Thermocouple (Appendix A) at different positions shown in figure 4.4
entrance
Figure 4.6 Computer rooms’ layout and positions where temperature is measured
4.2.1 Graphs for temperature varying by time
In this part, the graph between temperatures at different positions within the rooms is plotted. The temperatures were measured for both the rooms during winter and spring to analyze the effect of the climatic conditions. Moreover, the numbers of computers that are on during the measurements are also accounted for, as they are a source of increasing the temperature in the rooms.
The computer rooms consist of twenty computers each and the labs are more or less full during the day time from 9:00 am till 4:00 pm. At the time of measurements, the number of people in the rooms was 12 to 15, as the number of students frequently changed during the measurements. The number of computers that were on during the measurements was 10 to 12. So, these were aiding in the rise of temperature, as the heat emitted through them was increasing the temperature inside the room. Moreover, the latent and sensible heats generated by the students are also a source of heat gain in the computer rooms. The outside temperature during summer was 16 to 20°C while it was 3 to 8°C during winter, when the experiments were performed.
21
Graph for temperature during winter
Figure 4.7 Temperature in Computer room1 varying by time during winter
Figure 4.8 Temperature in Computer room2 varying by time during winter
22 23 24 25 26 27 28 29 0 5 10 15 20 Tem p e ratu re (d e gr e e c e lsi u s) Time (Minutes)
Temperature in Computer room1
varying by time
position 1 position 2 position 3 position 4 position 5 20 20.5 21 21.5 22 22.5 0 5 10 15 20 Tem p e ratu re ( d e gr e e c e lsi u s) Time (Minutes)Temperature in Computer room2
varying by time
position 1 position 2 position 3 position 4 position 522
Graph for temperature during spring
Figure 4.9 Temperature in Computer room1 varying by time during spring
Figure 4.10 Temperature in Computer room2 varying by time during spring
0 5 10 15 20 25 30 35 40 45 0 340 680 1020 1360 1700 2040 2380 2720 3060 3400 3740 4080 4420 4760 5100 5440 5780 6120 6460 6800 7140 Tem p e ratu re ( d e gr e e C e lsi u s ) Time (seconds)
Computer room1 temperature varying by
time
Position 1 position 2 positioin 3 position 4 position 5 0 5 10 15 20 25 30 35 0 380 760 1140 1520 1900 2280 2660 3040 3420 3800 4180 4560 4940 5320 5700 6080 6460 6840 7220 7600 Tem p e ratu re (d e gr e e c e lsi u s) Time (seconds)Computer room2 temperature varying by
time
position 1 position 2 Position 3
23
4.3
How the Ventilation system in MDH building works?
Figure 4.11 Ventilation system in MDH building
The ventilation system in MDH building is being controlled centrally. From figure 4.11, we see that the green line is the air duct. Red line is the hot water pipe and Blue line is the cooling water pipe. Yellow point (GP) is the pressure sensor, while the other Yellow point (GT) is the temperature sensor. Outdoor air enters into the system at point ST23. The airflow rate is controlled by electrical pump and electrical valve. Air temperature is controlled by hot water and cooling water flow rate, while the water flow rate is controlled by electrical pump. In this system heat exchanger is used for exchange of heat between air and water. All electrical components are controlled centrally through a computer program.
24
5. Discussion and Conclusion
Most people have some idea about ventilation in general terms but are not so sure of its importance in daily life. Ventilation is basically a process of removing bad air and supplying in fresh air containing the necessary ratios of the gases present in air for a normal breathing, either by natural or mechanical means. Ventilation removes indoor air pollutants and thereby improves the quality of indoor air. Indoor air pollutants may include tobacco smokes or fumes, unpleasant smells, dust particles, volatile organic compounds and many others. Moreover, the main purpose of the ventilation is to remove excess carbon dioxide, the accumulation of which causes suffocation and it becomes difficult for the inhabitants to breathe in. Ventilation system also controls the indoor air temperature, thus providing an environment where the people can live comfortably.
The ventilation system of MDH building is being controlled centrally. It was being complained that the system is not working properly in some parts of the building and feeling of discomfort is observed which includes increase in temperature and suffocation. So, it was a dire desire that some study must be conducted in order to understand the reason for it. Our group was given the opportunity to investigate and analyze the ventilation system of two of the computer labs and see the main causes of the discomfort. The measurements were made for the winter as well as spring season, but the main focus was the spring season, as the outside temperature is higher and also the breathing rate during spring is comparatively more.
The temperatures of both the rooms were measured and also the carbon dioxide contents within the room were also calculated. The measurements were made in different positions of the room and also in different climatic conditions. Moreover, the number of people and also the number of computers those are on are also taken into consideration.
The graphs reveal that the carbon dioxide concentrations are more at the entrance and middle of the computer room2 as compared to other parts of the room, which seems to be due to the fact that the ventilation in these parts of the rooms is not working properly. One of the reasons can be that the ducts at these parts are not able to take the exhaust air out of the rooms, which is resulting in accumulation of carbon dioxide. The number of people that were present at the time of measurements was 12 to 15 for all the positions. So, the carbon dioxide produced by the inhabitants of the room was equal in all parts of the room. It concludes that the increase in CO2concentration is
mainly due to the inefficiency of the system as the rooms were equally used by the people.
The CO2 graphs for the computer room 1 indicate that again the concentrations at the entrance of
the room are more as compared to other parts of the room under same conditions.
The graphs for the temperature show that in computer 1, the temperature is higher for the middle and entrance of the room. The number of people that were using the computers was also the same and the heat generated by the computers that accounted for gain in temperature was the same. There is also no other source of heat coming at these positions, as there is no window nearby that can cause the rise in temperature at these positions.
The temperature graph for the computer room 2 shows that the middle and entrance of the room is well regulated for temperature, as it is within the acceptable limits of temperature. The graph shows that at position 2, the temperature is much higher than the limits and is at more or less 30°c which can be due to the factor that it is close to the windows and the heat coming in through the glass is
25 aiding in the rise of temperature. The controls here are not working properly, which is causing increase in temperature in that part of the room.
It can be concluded from the discussion and evidence that there are poor controls both for the temperature and carbon dioxide concentrations in computer room 1 at the entrance of the room. The other parts of the rooms seem to be in control of the operating conditions.
6. Recommendations
It is recommended that the controls for the temperature and carbon dioxide be checked for accuracy and the discrepancies in the system be removed. It is also strongly recommended that these types of experiments should be carried out in the whole campus of Västerås and check for the controls, to make this university a role model for the world.
26
7. Bibliography
Aphornratana, S. (2006). Heat Transfer. Pathumthani, Thailand: Sirindhorn International
Institute of Technology Thammasat University.
Aphornrathana, S. (2007). Refrigeration and Air conditioning. Pathumthani, Thailand:
Sirindhorn International Institute of Technology Thammasat University.
CA Erdmann, K. S. (1999). INDOOR CARBON DIOXIDE CONCENTRATIONS AND SICK BUILDING
SYNDROME SYMPTOMS IN THE BASE STUDY REVISITED: ANALYSES OF THE 100 BUILDING.
Berkley, CA, USA.: Indoor Environment Dept., Lawrence Berkeley National Laboratory.
Improved control of air quality BUILDING . (2011, March). Retrieved from Improved control
of air quality BUILDING :
http://www.ornl.gov/sci/roofs+walls/insulation/fact%20sheets/whole%20house%20ventilati
on%20systems.pdf
INTAB. (n.d.). Retrieved March 18, 2011, from INTAB:
http://www.intab.se/pclogger2100/main.htm
Pentronic Thermocouple. (2011, March 18). Retrieved from Pentronic Thermocouple:
http://www.pentronic.se/Default.aspx?tabid=138
pentronic Thermocouple Cable. (n.d.). Retrieved March 19, 2011, from pentronic
Thermocouple Cable: http://www.pentronic.se/Default.aspx?tabid=154
Sense air. (n.d.). Retrieved March 19, 2011, from Sense air:
http://www.senseair.se/Datablad/ed_%20asensetransmitter.pdf
The GSW office block . (n.d.). Retrieved March 16, 2011, from The GSW office block :
http://www3.hku.hk/mech/sbe/case_study/case/ger/GSW_Berlin/GSW-energy-ventilation.htm
WHOLE-HOUSE VENTILATION SYSTEM. (n.d.). Retrieved May 10, 2011, from WHOLE-HOUSE
VENTILATION SYSTEM:
http://www.ornl.gov/sci/roofs+walls/insulation/fact%20sheets/whole%20house%20ventilati
on%20systems.pdf
Wikipedia data logger. (n.d.). Retrieved from Wikipedia data logger:
http://en.wikipedia.org/wiki/Data_logger
Wikipedia thermo couple. (n.d.). Retrieved May 10, 2011, from Wikipedia thermo couple:
27
Appendix A: Measuring Instruments
1. Pc data logger 2100
Pc data logger 2100 General Specification (INTAB)
Mechanical
Size 247x110x36(BxHxD mm)
Weight 860g
Connectors
10pcs detachable screw terminals
Power
12-15 (18) VDC, 400mA
Temperature range
Operating -20°C.. +50°C
Storage -30°C.. +55°C
Memory
224kB (112 000 values)
Computer interface
RS-232 9600 Baud 15 pin DSUB
Other
2 lines LCD for presentation
5 buttons for operating
Pc data logger 2100 Technology (INTAB)
A/D converter
16bits A/D converter with 25000
divisions. The resolution is 0.4mV
when using range ±10V.
Analog inputs
True differential inputs.
Input impedance 400kOhm between
+ and - , min 5Mohm to ground
reference.
28
Power supply
12volt DC makes PC-Logger simple to
connect to battery supply.
Detachable screw terminals
Use the detachable screw terminals
to measure on many different places
without unscrewing the sensors.
"Calibration"
All channels are software adjusted.
Adjusting constants are stored in the
logger and used to calculate the
measurements. No old fashioned
potentiometers to adjust logger
response.
2. Thermo couple
Thermocouple Metal sheathed
probe with moulded standard
connector Model 8102000
(Pentronic Thermocouple, 2011)
Design
Mineral insulated metal sheathed
thermocouple with standard male
connector
29
Example of use
Temperature measurement of gasses and liquids.
Maximum temperature
Probe:
Connector: 150 °C
Probe
Metal sheath: EN 2.4816 (Inconel 600).
Wires IEC 60584-2 class 1
Type: K and N
Measuring junction: Isolated
Signal connection
Moulded standard male connector
Colour code according to IEC 60584-3.
Certificate
Test value: Certificate EN10204 3.1b
Note
Working temperature, environment and
diameter of probe influence lifetime of the
sensor. Contact Pentronic for choice of suitable design.
TYPE
MAX. TEMP
K
1200 °C
N
1200 °C
30
3.Thermocouple Cable
Thermocouple cable Nylon-insulated (pentronic Thermocouple Cable)
Model N/N-24 Example of use
Manufacturing of wire temperature sensors.
Maximum temperature 150 °C Minimum temperature -65 °C Conductors Area 0,20 mm2 (AWG 24) Strands 1 x 0,51 mm Insulation Nylon
Conductors are parallel in the outer sheathing.
Outer sheathing
insulation Nylon Dimensions 1,1 x 1,8 mm
31
4.Carbon dioxide transmitter
aSENSE Carbon dioxide transmitter (Sense air)
FEATURES
• State-of-the-art Non-Dispersive Infrared
(NDIR) technology to measure CO2
• Maintenance free in normal applications
• Cost optimized for connection to DDC:s
• Contributes to lower energy costs when it is
applied in a Demand Control Ventilation
(DCV) strategy
• Available in different carbon dioxide
measurement ranges and different housings
• Internal automatic self diagnostics
• 2 analogue outputs as standard (V/mA).
Relay output as option
• Cost-efficient RS485 communication as
option
• Internal 2-channel logger as option
APPLICATIONS
aSENSE™ is designed to control ventilation by
transmitting the measured carbon dioxide and
temperature value to the system´s Master or
DDC. The transmitter is flexible and suits many
different ventilation strategies.
32
fresh air flow should, in rooms where people
stay more than occasionally, be at least 7
litres/sec and person.
If the room occupants are adults with a light
work-load and the outdoor CO2 concentration
is 350 ppm, this airflow answers directly to an
in-door CO2 concentration of 1040 ppm.
According to National Boards of Occupational
Safety and Health, the CO2 concentration can
therefore be used as an indicator of the Indoor
Air Quality (IAQ).
A CO2 concentration below 1000 ppm should
then always be the aim.
aSENSE™ carbon dioxide transmitter Technical Specification
General Performance
Compliance with ... EMC directive 89/336/EEC, RoHS directive
2002/95/EG
Operating Temperature Range1 ... 0 to +50 °C
Storage Temperature Range ... - 40 to +70 °C (standard model) (models -D: -20
to + 70 °C)
Operating Humidity Range ... 0 to 95% RH (non-condensing)
Warm-up Time ... ≤ 1 min. (@ full specs ≤ 10 minutes)
Sensor Life Expectancy ... > 15 years
Maintenance Interval ... no maintenance required 2
Self Diagnostics ... complete function check of the sensor
Display ... 4 Digits, 7 segments LCD with ppm / °C / %
indicator (models –D)
Electrical/Mechanical
Power Input ... 24 VAC/VDC±20%, 50-60 Hz (half-wave
rectifier input)
33
Wiring Connections ... screw terminals, max 1,5 mm2 wires/
European and US standard J-boxes
Outputs
Analogue 3
Protection ... PTC fuse (auto reset) on signal return M,
short-circuit safe
Linear outputs OUT1 & OUT2... 0/2-10 VDC ROUT < 100 OHM, Rload > 5k OHM
(0/1-5 VDC optional) 0/4-20 mA
Rload < 500 OHM
Default ranges... 0 – 2000 ppm CO2, 0 - 50°C
D/A Resolution ... 10 bits, 10 mV / 0.016 mA
D/A Conversion Accuracy ... voltage mode: ± 2% of reading ± 50 mV
current loop : ± 2% of reading ± 0.3 mA
ON/OFF
Relay (OUT3)... (accessory -R) isolated N.O., 1mA/5V up to
1A/50VAC/24VDC.
UART Serial com port
Protocol... SenseAir protocol (see comprot 0700xx rev 3_04.pdf
) Modbus as option 4
PC-interface ... RS232 UART cable with sliding contact and driver
(model A232 Cable)
PC User Interface Program ... UIP4 (or higher) 5
RS485 network com... (accessory -485) RS485 terminal slide-on port,
network capabilities up to 30 units
LonWorksTM network com. ... (accessory -LON) LonWorksTM add-on
Option Modbus RTU
CO2 Measurement
Operating Principle... Non-dispersive infrared (NDIR) with
Automatic Baseline Correction (ABC) 6
Response Time (T1/e) ... 2 min. diffusion time
Accuracy 7 ... ± 1% of measurement range ± 5 % of measured
value
34