J
Ö N K Ö P I N GI
N T E R N A T I O N A LB
U S I N E S SS
C H O O L JÖNKÖPI NG UNIVER SITYP e r f o r m a n c e d i f f e r e n c e s
a c r o s s m a r k e ts
A study of mutual funds
Master Thesis in Economics Author: Martin Carlsson Tutors: Agostino Manduchi
Pär Sjölander Jönköping June 2006
Master thesis in Economics
Title: Performance differences across markets – a study of mutual funds
Author: Martin Carlsson
Tutors: Agostino Manduchi
Pär Sjölander
Date: 2006-06-08
Subject terms: Mutual funds, Performance, Jensen’s index.
Abstract
In this thesis, I examine the performance of a sample of ten Swedish-based internationally diversified mutual funds managed by one of the largest commercial banks in the Nordic re-gion. The investigation cover a time span between 2000 and 2005 divided into two sets, 2000-2002 and 2003-2005. To measure the performance of the funds, I will utilize the Jen-sen’s index.
The results shows that there is no empirical evidence which indicates that managers seize superior stock selection skills when investing locally compared with investing on different markets for the selected funds. It does on the other hand shows that two out of the seven funds increases the beta towards the market when the market goes up. Finally, this thesis shows that inclusion of emerging markets creates further possibilities for diversification in a portfolio due to more developed markets tends to have high level of integration and move together.
Magisteruppsats i Nationalekonomi
Titel: En studie av fondförvaltares prestationer på olika geografiska marknader Författare: Martin Carlsson
Handledare: Agostino Manduchi Pär Sjölander
Datum: 2006-06-08
Nyckelord: Fond, fondförvaltare, förvaltning, Jensen’s index, geografisk diversifiering
Sammanfattning
I denna uppsats ska jag undersöka hur sju olika Sverige-baserade fondförvaltare presterar på sina respektive marknader och hur väl de utveckla mot sitt jämförelse index. Studien kommer att delas in i två tidsperioder, 2000-2002 och 2003-2005. Anledningen är att under den första perioden sjönk i stort sett alla världens börs index medan de under den senare tidsperioden steg kraftigt. För att genomföra studien kommer jag att använda mig av Jen-sen’s index.
Resultaten från studien visar att det inte finns några empiriska bevis för att någon av fond-förvaltarna presterar markant bättre än sitt jämförelseindex. Dock visar studien att två av sju förvaltare ökar sin fonds beta värde mot sitt respektive index när marknaden skiftar från nergång till uppgång. Slutligen visar studien att om man inkluderar tillväxtfonder så ökar diversifieringseffekten markand då de korrelerar väldigt lite med fonder som investerar på mer utvecklade marknader.
Table of content
1
Introduction ... 1
1.1 Background ...2
2
Geographical diversification ... 3
2.1 Diversification theory ...3
2.2 Home bias investments ...5
3
Performance differences across markets... 6
3.1 Active and passive mutual funds...8
4
Rating and evaluation of funds ... 9
5
Portfolio performance ... 10
5.1 Jensen’s index ...10 5.2 Correlation...126
Data ... 12
7
Empirical analysis ... 15
8
Conclusion... 18
8.1 Further Studies...19References ... 20
1 Introduction
In this thesis, I examine the performance of a sample of ten Swedish-based internationally diversified mutual funds managed by one of the largest commercial banks in the Nordic re-gion. The investigation cover a time span between 2000 and 2005 divided into two sets, 2000-2002 and 2003-2005. The first time span will measure when the stock market bears and the second when the market bulls. Centre of attention will be on how performance differs due to geographical markets.
It is widely known that international diversification can generate significant decreases in sys-tematic risk. One way for investors to achieve such diversification without investing in costly information and transaction costs is through internationally diversified mutual funds. On the other hand does investors in mutual funds pay an administration fee to the fund manager. The fund managers should posses the information and knowledge that yields a higher actual return than the stock index on that specific geographical market the investment takes place. It is not difficult to produce a positive payoff if the entire stock market raises. What is more interesting is if the manager can create superior performance and beat the comparable index. When paying this fee, one assumes that the manager does a sufficient job.
This is important for investor, because an actively managed portfolio, which has as a target to beat a comparable “buy and hold” portfolio, does often brings higher fees and if it results in poor performance should the investor look for a cheaper “passive” portfolio which tracks the index.
A crucial point in creating high payoff is that the security is correctly priced. This means that the prices on different financial assets have been subjects for systematic analysis from differ-ent financial institutions, mutual funds, analysts and banks and that all available price affect-ing information is taken into account and regarded as correct both in Sweden and abroad. This can be expressed as that the market has discounted all price affecting information and is included in the hypothesis about an efficient market and is an effect of the high levels of transparency and is related to the Efficient Market Hypothesis (EMH), which says that the prices of the securities values in financial markets should be equivalent to fundamental val-ues, or for the reason that all investors are logical or since arbitrage removes price differ-ences. The main obstacle about this hypothesis is that if it is true, there would not be any under- or over valued securities. Investors can in this case only receive compensation for the risk that the investment has.
The purpose of this thesis is to se how well the mutual fund managers of a large commercial bank perform on each individual mutual fund compared with the market index of the target-ing market. A further comparison will be done to see if the performance differ in different stages of the business cycle.
To measure the performance of the funds, I will utilize the model created by Michael Jensen, more known as the Jensen’s index or Jensen’s alpha. The method measures the deviation of a portfolio from the securities market line and is based on the CAPM-approach.
The aim of this thesis is to check my hypotheses for international mutual funds:
- Investors in mutual funds receives higher return on closely located markets com-pared with its corresponding index then on distanced markets.
- Fund managers decreases/increases the beta towards the market when the market bears/bulls
The data used is daily observations in the time span 2000-01-01 to 2005-12-31 by request from the banks database and will contain rates of the selected funds. Index notations will be collected for the same time span and dividing from Morgan Stanley Capital International (MSCI), Alfred Berg, Affärsvärlden and Standard and Poor’s. All indices used will be capital weighted and adjusted for free-float. Treasury bills issued by the Swedish central bank, with a time to maturity of 90-days will serve a the risk free rate.
The study shows no evidence of superior performance for any of the funds. It does on the other hand shows that two out of the seven funds increases the beta towards the market when the market goes up. Finally, this thesis shows that inclusion of emerging markets cre-ates further possibilities for diversification in a portfolio due to more developed markets tends to have high level of integration and move together.
1.1 Background
Historically, investments on the Stockholm Stock Exchange (SSE) have generated on aver-age a higher payoff than the savings account. An investor would have received an averaver-age premium of nine percent per year between 1938-1987. After 1987 the average premium has been seven percent with a large spread between successful years and less successful years. During the last 30 years mutual funds have changed the financial markets all over the world. This can be seen in the changes of the saving structure of household’s. Savings have moved from the traditional bank account towards mutual funds which offer possibilities to invest in different sectors and in different geographical regions. The increased savings in mutual funds in the Swedish households increased from less than 0.1 percent in 1980 to approximately 30 percent of the total wealth in 2005 (fondbolagen.se, 2006).
At present, more than 900 billions dollars are invested in actively managed equity mutual funds in Sweden. Assuming that the fees and expenses of these funds on average are about one percent of the assets1. This means that the total revenues for the fund administrators
summarises to more than SEK 9 billions yearly, although mutual funds provide a number of services and nearly half of the expenses arise because of the stock selection process (fondbo-lagen.se, 2006).
Buying mutual funds is a way for investors to buy the manager’s knowledge of the targeting market. As the savings in mutual funds have increased has also the number of managers in-creased. Some of the managers will perform sufficient and some poor. This thesis will hope-fully find evidence of how good knowledge the fund managers for these funds has of the targeting market and if they creates superior performance compared to the benchmark. The thesis will not take the fees into account when the calculations will be made but try to answer if it is valuable to invest in a active fund instead of in investing in a passive one which tries to follow index as much as possible.
2 Geographical diversification
This chapter will briefly discuss the benefits and possibilities of diversification and make it more easy to understand why an investor should look beyond the borders of its domestic county.
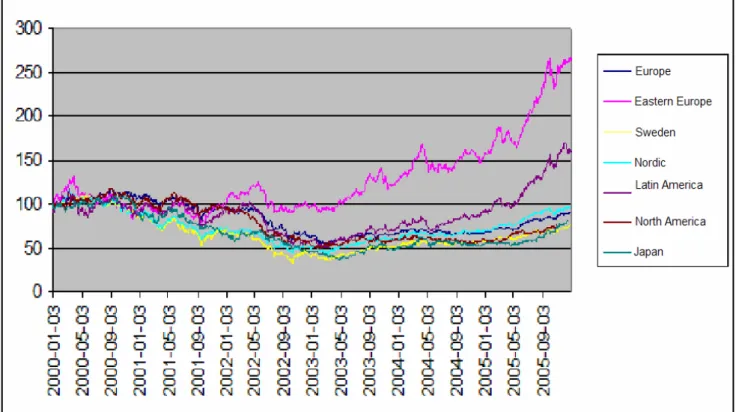
Traditional economic models assumes that investors have expectations regarding future pay-off of securities. Each investor selects his portfolio as to maximize the expected utility of the payoff. Investors aversions to risk implies that their portfolios should be diversified. In par-ticular, they will greatly benefit from international diversification. On the other hand, people do not often behave in accordance with these rules, investor’s money tend to stay in their home countries. Figure 1 shows how the different stock markets have developed since 2000-01-01, and suggests that the index move differently and a combination of them will reduce the risk and create a higher expected and more certain payoff.
Figure 1 The development of different stock markets form 2000-01-01 until 2005-12-31
2.1 Diversification theory
The theory of diversification explains how investors, who are risk-averse, can optimize their portfolio in order to get highest possible return given lowest possible level of risk. Investors on the equity market assumes that high risk will create possibilities for high return and low level of risk will pay lower payoff with higher certainty. International diversification is not a guarantee to prevent losses but a tool to reduce the systematic risk.
The study of portfolio creation begins with Markowitz “Modern Portfolio Theory” of diver-sification in 1952. His initial studies did at first focus on portfolios constructed of domestic assets. Since then, international markets have opened up since then and created better access for foreign investors. Literature have focused on the possibilities of higher payoff from in-ternational investments. One of the earliest works that explains the benefits of inin-ternational diversification came from Grubel (1968). He showed that the portfolio theory from Marko-witz could be useful also on international investments. His work led to additional research by Solnik (1974) whom expanded the discussion and developed the model on international di-versification. Later studies have focused more on international diversification from the view-point of fixed income markets (fixed income securities).
Solnik and McLeavey (2003) discusses the gains of international diversification. If there were an integrated equity and capital market, investors would create a portfolio which would re-flect a weighted world market index in order to lower the risk. The explanation is that the level of independency and heterogeneity is relatively high and the correlation is low between the different markets. This is due to the different financial, business and political construc-tion which are differently affected when events take place. Domestic investments tend to be positively correlated to each other, even when they are similarly affected by domestic condi-tions, such as changes in interest rates or national growth.
The total risk of a portfolio cannot be calculated without knowledge about the correlation between the different securities. A correlation coefficient (ρ) can be between +1.0 and -1.0. The gains from diversification depend on the correlation of the returns in different equity markets and diversification is possible unless there are perfect correlations. This means that there is opportunities for diversification and a pure diversified portfolio is located on the edge with correlation coefficient at either +1.0 and -1.0.
Solnik (1996) emphasize two different sorts of risks, diversifiable and undiversifiable which occur when an investor creates a portfolio. The first kind is systematic risk or undiversifiable risk. This risk affect the entire market or a market segment and is not possible to remove or avoid through diversification. Systematic risk could be both political or economically related and act either independent or in symbiosis. Interest rates, recessions, exchange rates, war and political instability2 are examples of risk factors which are not possible to diversify against. A
portfolios systematic risk can be calculated as followed: Systematic risk =βpσm
where βp is the beta coefficient for the portfolio and
σ
m is the standard error for themar-ket.
The share of a portfolio which is not systematic is called diversifiable risk or “unsystematic risk” and have an effect on a specific group of securities or an individual security. This type of risk is possible to decrease by diversifying the portfolio by investments in different com-panies, sectors or regions which have low level of correlation and will not be affected in the
2 One can argue that it is possible to diversify against political instability by choosing a market which has a
lower probability for political crises. What this example more focuses on is political crises which happens un-expected and as an example is the gas conflict between Russia and Ukraine which led to double prices for the citizens of Ukraine. Another example is if there is a unexpected outcome of an election and a radical left or right wing party wins and introduces a unimaginative reform policy which results in very low growth and a lot of capital leaves the country.
same way to a single event. An increased number of shares in a portfolio, lowers the unsys-tematic risk. This type of specific risk is related to the individual company, sector or market. Unsystematic risk could be a sudden strike of the employees, weaker demand for a certain type of goods or changes in the regulations for a certain sector.
One can draw the conclusion that by diversifying and investing in a higher number of shares, which are presumed to have low correlation with each other, reduces the systematic risk.
2.2 Home bias investments
A major part of all investors does not follow the theory exposed above, with an increased number of international holdings, even though it is proved that diversification lowers the risk.. Investors tend to place most of there investments in domestic assets even though it is known that equity markets of different nations do not always move together, investors can diversify their portfolios by holding assets in several countries. In 1991, more than 98 per-cent of the equity portfolio of Japanese’s investors in held domestically, 94 perper-cent for US and 82 percent for UK. This means that an investor disagree with the entire discussion of in-ternational diversification. It could be explained by the fact that investors have higher expec-tation of payoff on their domestic market. UK equity investors expect an average return of 9,6 percent on the UK market while US investors believed 4,5 percent and Japanese inves-tors 3,8 percent. This is also significant for the Japanese and US domestic market (French and Poterba, 1991).
Sjöberg and Gavelin (2006) write that during the last 20 years have changes occurred in the Swedish trading strategy towards international diversification. Investors in Sweden were until 1980 restricted by regulations regarded currencies and it was almost impossible or very ex-pensive to invest in foreign assets. Along with a deregulation increased the level of Swedish ownership abroad. They further explains that different countries enjoy different levels of benefits from international diversification and is exemplified with the US stock market which is regarded as the worlds largest equity market with more than 10 000 listed companies and a wide and deep bond market. This great variety gives a modest volatility. The broad quantity of investment opportunities means for an American investor a possibility for a well diversi-fied portfolio even though investments are done on the domestic equity market. In contrac-tion have the Swedish market fewer companies and a higher volatility3. This gives investors
in Sweden higher incentives to diversify internationally and due to the fact that the Swedish equity market stands for less than 1 percent of the total world stock market.
Sjöberg and Gavelin mentions however that institutional factors may reduce returns from investing abroad or they may without a doubt limit investors capability to hold foreign stocks. It is hard, on the other hand, to identify such restrictions. Institutional barriers such as transaction costs or taxes are unlikely to explain the low level of cross border equity in-vestments. Kang and Stulz (1997) claims that the barriers to investing abroad have been con-stantly reduced and this has created a more easy environment for investments. Even though foreign ownership is still narrow and should increase dramatically if barriers did not exist. There are opportunities for large increases in trade volumes if the international security mar-ket was more integrated and barriers reduced.
3 The Swedish stock market have relatively very high standard deviation compared to other developed equity
Huberman (2001) write that familiarity to an investment may creates an false impression of a superior advantage in information available to the investor which have not reached the mar-ket, perhaps to be among the first to have access to good or bad news first and therefore re-act in forehand of the market. He further discuss how the access of the superior information can gain excess payoff in order to spot opportunities to either buy or sell an asset in an ear-lier stage than the market. This idea of investing in the familiar and closely located markets and firms do not follow the idea of diversify and optimise the portfolio. A common example is a company’s retirement and pension funds which invest and hold its major part of assets in its own company. Huberman presents two reasons for this, firstly, familiarity plays a large role when it comes to comfort and a investor is more likely to invest in a company he or she knows (again to the believed superior information). The main point of the discussion here is that the investor faces a possible fright of investing in securities with little or no knowledge. Secondly, often the idea of investing in the company’s own stocks is a way of creating loyalty to the firm. The thought is that the single employee will create a better job for the company if the level on the pension is dependent on how the firm perform.
3 Performance differences across markets
Performance literature has focused on domestic mutual funds that are widely spread. The first ideas was developed in the 1960s where works by Treynor (1966), Sharp (1966) and Jen-sen (1969) was published. These ideas has expanded and many important works has fol-lowed with focus on performance of domestic funds, and when the financial market got more integrated internationally the number of works which focuses on the trading and in-vestments with foreign assets has increased in the last decades.
Cumby and Glen (1990) discuss the performance of 14 different foreign markets is. The study found that all funds were performing with a lower result than domestic funds. Shukla and van Inwegen (1995) highlights fund managers in the UK and concludes that equity port-folios invested in US underperforms domestic ones. Other studies in this area is Blake and Timmermann (1998) who expand the destination markets to four major regions and find similarly poor performance. Engström (2001) came across in a research of 299 Swedish and European based mutual funds, which invests both domestic and internationally, that firstly the funds tend to be biased towards a certain sector and did not have the same structure as the market and their comparable indices. Secondly showed the results that international and global funds underperforms compared to funds which only invest domestically.
Thomas, Warnock and Wongswan (2004) identify three separate reasons for unrestricted performance of international mutual funds. First is trading strategy, which is built on the re-search made by Choe, Kho and Stultz (2004) and shows that foreign investors is in favour of momentum trading which obstructs their performance. A reason for this is the informational drawback foreign investors get by investing abroad. The result of insufficient performance have been empirically in a range of studies from emerging countries Indonesia and Korea to developed like Germany. Further more, Thomas et. al (2004) finds evidence of contrarian trading which means that instead of buy past winners and sell past losers, do the opposite and sell past winners and buy past losers. This is true for investors both in upcoming mar-kets and developed marmar-kets.
Secondly is information a main factor, and indicates how well the investor can get access and utilize information which is spread and known to a limited group of people. Better perform-ance could also be determined on how skilful one is using publicly available information. Furthermore, it affects the total payoff if the investor have access to private information which enables them to move out of or into the market before the information have public and the return have been affected positively or negatively. If Swedish traders uses private in-formation, it is hard to find evidence for superior performance due to the fact that the trad-ing strategy is based on different and unfair conditions in relation to the targettrad-ing index. Grossman and Stiglitz (1980) found that investments in costly information have different outcomes and showed that it was not profitable to invest in Asia but created a better per-formance in Europe.
At last, preference for two different types of firms, well governed and cross listed. Firms which are expected to have a solid corporate governance and firms which are cross listed on different stock markets are often priced higher in terms of key numbers. Thomas et. al (2004) shows that a portfolio containing only cross listed firms and firms with solid govern-ance perform better than the MSCI index. Mutual fund managers could take the advantage of this and weight the fund heavily of this kinds of companies in order to create superior performance.
Solnik (1996) describes the constraints and misconceptions of international trading and di-versifications. He highlights five factors which could limit and hamper the performance. Firstly is the unfamiliarity to foreign markets where investors often face a new culture and the way of how business is conducted on the market. He further explains that firms have understood the advantages and profitability of direct investments for a long time. Even then does institutional investors often prefer to undertake theirs investments abroad through do-mestic brokers because foreign markets are seen as more risky. The unfamiliarity creates a prejudiced and a less optimal way of creating profits due to the differences in the trading process and communication. A second hinder is the regulation which holds back foreign in-vestors and favour local inin-vestors. Restrictions occurs in some countries for how large share of the ownership foreigners is allowed to hold. This is common both in emerging and devel-oped countries. Swiss firms tend to issue a limited amount of special shares which are traded at a premium over the “normal” shares. These restrictions is something which tends to be reduced and the European Union counteract ownership discrimination inside the Union. Moreover Solnik argues that the market efficiency, size and liquidity plays a large role in per-formance on foreign markets. Institutional investor prefer to invest in large-capitalized and more liquid markets due to the possibility to more easy realize an successfully performed portfolio and not be trapped with drops in prices and lower return4.
The fourth reason is that anything which is unknown is considered to be risky. Foreign mar-kets tend to be assumed more risky than domestic in the eye of the investor. One should keep in mind the study by French and Poterba (1991), where the expectations for the do-mestic stock market was higher than the foreign. Foreign assets might look more volatile than domestic assets, but their inclusion in a domestic portfolio will reduce the total risk of the portfolio because of the low correlation between various national markets. The intention is not to get rid of risk but to reduce the unsystematic risk while trying to maximize the pay-off. A key reason for increased volatility of investments abroad is currency risk and can be
4 Examples can be found from Spain and Italy in the 1980s where investors where caught with portfolios
reduced by a diversified portfolio or use currency forwards or options to some extent or as a completely hedge. On the other hand some investors want currency risk because foreign cur-rencies does sometimes provide opportunities for additional profits.
The final factor mentioned is costs of international investments and it tends to be higher than holding domestic assets. This is especially true for Sweden where costs are regarded to be low. On the other hand, the potential return of investing much higher in comparison but it is still a factor for why the performance should differ between domestic and foreign inves-tors and a explanation for why a portfolio is weighted towards domestic assets. Solnik high-lights transaction costs, custody costs, withholding taxes and management fees as compo-nents for international investments.
3.1 Active and passive mutual funds
Active asset management have traditional been carried out with the aim of attaining highest possible absolute return compared to the index. The CAPM theory says that all investors should own the market portfolio and a risk free asset in a suitable proportion. The Efficient Market Hypothesis (EMH) says that active portfolio managers on average does not beat the index and claims therefore that a rational investor should invest in a market index portfolio. This have increased the demand for “passive” mutual funds which has a target of following the index. Today are approximately 30 percent of institutional investors in US focused to-wards “passive” management and the largest mutual fund is a passive fund named Vanguard S&P Tracker which follows the Standard & Poor’s 500-index.
Graham and Dodd’s (1934) prominent study “ Security analysis” explains company valuation and fundamental analysis. They explain that one should invest in stocks which have a posi-tive expected payoff. If this is not possible should one turn their eyes on risk-free invest-ments. There are very few who applies this method today, but examples can be found in Warren Buffet’s Berkshire Hathaway and the Swedish investment company Lundbergs who both have a very concentrated portfolio with no similarities with the average index (Sjöberg & Gavelin, 2006).
The increased trend of comparing performance with the market index have led to that man-agers more often takes the same positions as the index. This can cause problems if compa-nies changes their weight the index because they have to pay attention to compacompa-nies which historical have not caused any interest, suddenly is important for the portfolio. The Swedish IT-company Icon Medialab came from nowhere and created a weight of nearly 1 percent in year 2000. The future is known and after IT-crash was the weight lowered to less then 0.02 percent. Another trend is that funds focus on different segments and groups of companies. Four well-known groups are large-cap, mid-cap, small-cap and micro-cap. A common prob-lem with these strategies is that companies tends to move between different segment and small-cap investors can have limitations of how large companies could be and could be forced to sell successful companies.
Some of the largest fund managers (apart from passive, index funds) more focused on fun-damental company valuation in combination with quantitative methods to construct portfo-lios. Analysts rank all potential companies in on sector and uses the grad in a multifactor model (e.g in Arbitrage Pricing Theory). Out of this can the best possible portfolio be con-structed in terms of systematic risk. J.P. Morgan Chase, Fidelity Institutional (not the funds which are offered to the public) and Citigroup are among those who use this method.
4 Rating and evaluation of funds
To invest in a fund is as mentioned an easy and comfortable way of getting access to a diver-sified portfolio even with small amounts. This is an explanation of why funds have been such a popular way to invest in the domestic market and a possibility to get access to foreign markets and stocks to a relative low cost. The number of funds which are possible to invest in has increased dramatically lately and has created a selection problem.
As it has been described earlier, it is risky to predict the future performance of a mutual fund. At the same time, the demand for information about the future performance is high. There are different participants which has concentrated to rate mutual funds with different methods. In this chapter I will present different rating actors and what methods they use in order to rate mutual funds.
Morningstar is one of two large fund rating firms in US (the second is Lipper). The ratings in Morningstar Sweden is based on a method which has been developed on the US market and includes apart from risk adjusted return also fees for purchasing and selling funds. The risk adjustment occurs through a theoretical utility function called constant relative risk aversion with a coefficient which tends to be normal. The method indicates that every extra percentage in total risk is penalized more on the margin in the calculation of risk adjusted return than lower percentages of risk. Morningstar includes the individuals utility function, this has been victim for criticism mainly from behavioural finance economists who claims that preference and utility functions is irregular. It does not pay attention to the fact that investor have different funds, it assumes that all investments are located in the same fund.
FT Fund Ratings is based on the progress compared by other funds with the same risk pro-file, type and total costs (excluded buy and sell costs). The risk profile analysis is provided by APT (Advanced Portfolio Technologies) which perform a factor analysis of the funds. Per-formance is measured as an excess return adjusted for the exposure (β). FT Fund Rating has the most modern method for quantitative rating with an extended analysis of risk. On the other hand, the comparison occur among other fund in the same sector and not against a neutral index.
W-rating, differ from the other rating firms due to the fact that their rating is not only based on past performance, it is instead based on qualitative judgements of the managing organisa-tion. It includes only mutual funds investing in stocks. The quantitative analysis is based on historical data on three years. It should, presuppose that these factors can be values on a relevant way, pick up for example changes in the mutual funds organisation. On the other hand is judging qualitative factors something which is considered to be difficult due to the fact that it an extensive work and hard to create the different necessary parameters.
Fondmarknaden.se uses return in relation to index with adjustments for total risk (closely re-lated to the Sharp-quota but not adjusted for the risk free investment). Even here is buy and sell costs included which shows that the rating is not just about managing the mutual fund. Compared to FT Fund Ratings, Fondmarknaden.se does not take a distinction between dif-ferent systematic risks which is not created by the mutual funds manager ability.
The last rating is Aktiespararna, which is an organisation that have the intention to watch the interests of small investors. Aktiespararna uses a modified Sharp-quota which instead of
de-Morningstar FT Fund Ratings W-rating, Wassum Fondmarknaden.se Aktiespararna
viations, both positive and negative, only measures negatively deviations in the performance compared to the average (Sjöberg and Gavelin 2006).
5 Portfolio performance
In order to clarify the benefits of investments in international portfolios and the use of di-versification, this chapter will discuss methods for evaluating mutual funds and how the pos-sibilities for differentiation can be assessed.
As mentioned in chapter 3 and 4, there are three basic risk adjusted performance measures that are commonly used, Jensen’s index, Sharp’s index and Treynor’s index. Sharpe’s index is calculates with the total variation in the investment and results in how the return (excluding the risk-free rate) per unit of risk. Treynor’s index differ from the Sharp-quota in the sense of how the risk is defined and measured, in the second method treat risk of the total market, in this case the investments β value while Jensen divide a portfolios total return into two parts: payoff from selection and payoff from risk taking. Selection describes how good the portfolio have performed compared with a passive portfolio with the same risk. Payoff from risk taking means that the payoff is a result of that a certain risk level is accepted. Total pay-off is the paypay-off one get in excess of the risk-free possibility to invest. He does also discuss the idea of actively managed equity portfolios. In a successful active portfolio, the portfolio have high values (β>1) when the market bulls and when the market bears should the β-values be low (β<1). In summary, the investor should increase the risk in the portfolio when the market goes up.
This thesis will use Jensen’s index in order to evaluate performances. The properties will be described in the following subsection and be put into practice and calculated in the empirical chapter 6 and presented in chapter 7.
5.1 Jensen’s index
Evaluation of mutual fund managers’ ability to predict future development of a stock market is often done with Jensen’s index or alpha which defines to what extent an investor assume that a stock is falsely priced. Excess payoff or yields below expectations is according to Jen-sen when the realized payoff differ from the portfolios choJen-sen level of risk. If there is a fully efficient market, the alpha should be zero and the investor will receive the payoff for which the Capital Market Line motivates.
Jensen presents in his original article (1968) six assumptions for the model which have to be taken into account and assumed; all assets are infinitely diversifiable, all transaction costs and taxes are zero, the capital market is in equilibrium, all investors are able to choose among portfolios only on the base of expected return and variance of return, investors have identi-cal decision horizons and standardized expectations about investment opportunities and that all investors are averse to risk and are wealth maximizes.
Jensen’s alpha is based on the Capital Asset Pricing Model about what expected payoff an asset or portfolio can earn given its level of systematic risk. If a portfolio manager is able to predict the future development he will be able to earn higher return than the expected.
Equation (1) defines the basic CAPM and says that the realized return on a portfolio can be expressed as a linear function of its undiversifiable or systematic risk, the realized return on the market index and the risk-free rate.
(
mt f t)
t f t p r r r r E( , )= , +β
, − , (1)where, E(rp) stands for expected return of the portfolio, rf for risk free return (90-day treas-ury bills in our case5 and will be calculated on a daily basis, rf,t =(1+ry,t)(1/250) −1,6 where
t y
r, is the yearly interest rate), β is the estimated beta for the fund based on the targeting market index and rm is the daily return from the comparable market index
7.
In order to construct Jensen’s alpha in equation (1) modified and the α is the variable that is estimated. Due to the fact that we are measuring the historical performance of mutual funds
) (rp,t
E is replaced by the daily historical payoff of the mutual fund, rp.
(
)
[
r r r]
urpt − ft + mt − ft +
= , , β , ,
α (2)
If one would like to estimate the risk in a portfolio for which is managed, an estimation of β in a regression will be efficient. On the other hand if one would like to do it for a managed portfolio, like in our case, the error terms of the regression will tend to be placed above the regression line due to the superior forecasting skills. We therefore construct a regression, at which the forecasting ability is taken into account by estimating the models equation.
(
r r)
u rrp,t − f,t =α +β m,t − f,t + (3)
Moreover, in equation (3) all variables are know apart from α ,which as mentioned above represent the intercept and the Jensen’s alpha estimated, and β which measures the beta value of the portfolio. The total sum of the error term will be equal to 0 and should be ran-dom and normally distributed. If the portfolio manager predicts the forecast on a security well, the intercept will be positive. If the forecasting ability follows index, the intercept is equal to zero and with a worse prediction than index, the intercept will be negative.
Even though we get a positive alpha, it is difficult to judge if it is done by luck or by a greater skill to pick the winners. Therefore should a least square regression be made in order test if the results of alpha from equation (3) is statistical significant.
As mentioned above will both rp,tand rm,tbe calculated from historical performances of the
mutual fund and the comparing market index. The payoff will be calculated as follow:
t t t t t V V D V R =( +1 − + 0 )/ (4)
5 Interest rates from treasury bills will be collected from http://www.riksbanken.se 6 The reason for discount with 250 days is due to the number of trading days.
7 Comparable indices will be assembled with daily observations from http://www.msci.com and
http://www.standardandpoors.com . Alfred Berg’s Nordic Portfolio Index is provided by SIX and will there-fore be retrieved from by request from http://www.six.se
where Rt is the portfolio return at time t, Vt+1stands for the portfolio value at the end of the
investment period, Vtfor value in the beginning of the period and D0t stands for dividends
paid out during the period t.
5.2 Correlation
As mentioned in previous chapters, the correlation of different assets is a measure of how they contribute to the total risk of the portfolio. The coefficient is between +1 and -1 and shows how two assets move together. If the coefficient is +1 between the two variables, the variables move exactly in the same way and if it is -1 the move exactly in the opposite direc-tion. There are possibilities for diversification as long as there are not perfect correlation be-tween the two variables. A correlation of 0 means that there is no connection bebe-tween the two variables.
The correlation coefficient (ρx,y) is calculated from the covariance between the two
vari-ables (in this case x and y) divided with the standard deviation (σ) of x and y.
[
]
y x y x y x y x Y X E Y Xσ
σ
µ
µ
σ
σ
ρ
, =cov( , )= ( − )( − ) (5)6 Data
In this chapter the Jensen index will be explained further and adjusted to suited standard for the implementation. Also in this section each mutual fund and its comparable index will be explained and described.
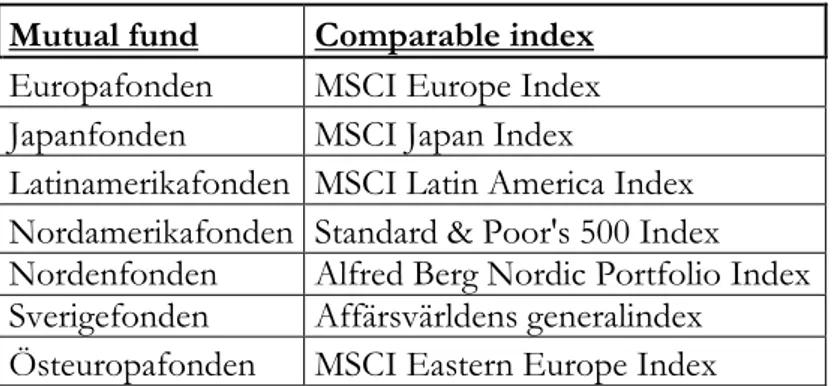
The data is collected daily from six international mutual funds and their comparable indices from 2000-01-01 to 2005-12-31 and studied in two time spans. All funds are actively man-aged and have a target of beating the index. All funds are presented in table 1 along with the comparable index for each fund.
Mutual fund Comparable index Europafonden MSCI Europe Index Japanfonden MSCI Japan Index
Latinamerikafonden MSCI Latin America Index Nordamerikafonden Standard & Poor's 500 Index Nordenfonden Alfred Berg Nordic Portfolio Index Sverigefonden Affärsvärldens generalindex
Östeuropafonden MSCI Eastern Europe Index
Table 1 Mutual funds and its comparable indexes
Europafonden is an equity fund which invests in the stock markets is Europe with focus on the major markets; Great Britain, Germany, France and Switzerland. The fund invests mainly in the large-cap and mid-cap segment where value companies with market leading products
and strong financial status are important criteria. In the end of year 2005 were the main holdings focused on raw material (Total, BP and Statoil), consumer goods (LVMH and Nestlé) and finance (UBS, Axa and Prudential).
Japanfonden invests exclusively in companies listed on the Japanese stock market without limitation of the size of the company or sector. Top sectors and top holdings for the fund is the car manufacturer Toyota Motor, companies in the financial sector (Mitsubishi Tokyo Fi-nancial, Mizuho, Nomura and Sumitomo Mitsui) and electronics (Hitachi, Nikon and Sharp, even the telecommunication firm NTT DoCoMo can be included in this group).
Latinamerikafonden holds mainly assets in Brazil, Mexico and Chile, which are the economic trendsetters in Latin America. Investments can also be made on the smaller and less devel-oped markets in e.g. Colombia, Peru, Argentina and Venezuela. Latin America is an emerg-ing market which has in the last years both been economical and political stabilized but is still partly affected by high inflation and large budget deficits.
Nordamerikafonden is a mutual fund which has its main part of its holdings in US compa-nies and small holdings in Canadian and Mexican firms. Investments can be made in all sec-tors, but has a focus on profitable, market leading large-cap firms. USA is the world largest industrial and manufacturing nation and the stock market value is half of the worlds total. This does not directly shows in the construction of portfolio where the companies from the financial sector dominate (Citigroup, Merrill Lynch, Wachovia and Aflac) together with the energy sector (Schlumberger and Suncor Energy). Among other major holdings can Eli Lilly (Healthcare) and Pepsico (consumer goods) be found.
Nordenfonden invests in listed companies on the Nordic stock markets. Country’s weight in portfolio varies depending on how the different markets develop but the main point is to be overweighed in Swedish stocks. The fund is without limitation when it comes to of the size and sector of the targeting companies. Oil, offshore and shipping are the main sectors on the Norwegian market and is a counterpart to the Danish where healthcare, consumer goods, groceries and services weights heavily. The Finish market is highly dependent on Nokia and other small IT and telecommunication firms. Sweden contribute also with telecommunica-tion firm and with a strong manufacturing sector and growing cluster of biotech firms. The portfolio is mainly compounded with firms in the energy sector (Norsk Hydro, Fortum and Statoil), telecommunication (Ericsson and Nokia) and finance (Danske bank, Nordea, Sampo and Handelsbanken).
Sverigefonden targets mainly Swedish large-cap firms with an international direction. As mentioned above, the market mainly consists of telecommunication, manufacturing and bio-tech. The composite of the mutual fund is mainly focused on manufacturing (Volvo and At-las Copco), telecommunication (Ericsson and Telia Sonera) and finance (Nordea, Investor, SEB and Handelsbanken).
Östeuropafonden focuses on the East European markets which mainly consist of Poland, the Czech Republic, Hungary and Russia. Investments can also be made in stocks emitted in other countries which have a significant part of its business or market in East Europe. Top holdings for the fund are Russian energy firms (Lukoil, Surgutneftegaz and Gazprom) and prospectors for raw materials (Norilsk Nickel).
According to the regulation of how investment funds should act, written in “Lagen om in-vesteringsfonder” (SFS 2004:46) 5th chapter. Swedish based mutual fund is not allowed to
have more than 10 percent of its total wealth in a single investment. None of the comparable indices have a company weighted more than 10 percent, which makes it possible to use a capital weighted index for which have a free float adjustment. By capital weighted means that every company’s stock price is weighted along with its market value (price times issued shares). Free-float adjusted means that all shares which is owned by a strategic owner and not available on the market is not included. This is the most common type and most fre-quently used index in international portfolio management.
Engström (2001) use in his research over 299 international mutual funds, based in Sweden and Europe, both a single index and a five index model as a benchmark. He uses for exam-ple MSCI Europe for the Europe fund and construct a customized weighted index in geo-graphical regions where it is not possible to employ a standard from MSCI. This thesis there-fore, in line with his study use the comparable regional indices retrieved from MSCI, Alfred Berg, Affärsvärlden and Standard and Poor’s.
Treasury bills issued by the Swedish central bank, with a time to maturity of 90-days will serve as the risk free rate and will be calculate on a daily basis as presented in the previous chapter.
Jensen’s index
The implementation of Jensen’s index requires that regression (3) is ran between the excess payoff of the portfolio and the excess payoff of the market. The regression is concluded be-low and Y is the dependent variable and X the explanatory:
X
Y =α +β
where Y =rp,t −rf,t,X =rm,t −rf,tand α is the Jensen’s alpha. If the mutual fund follows
the index, alpha will be equal to zero and if the performance differ from the comparable in-dex will alpha differ from zero. The hypothesis will therefore be:
0 : 0 : 1 0 ≠ =
α
α
H HThe discussion can be expanded further by saying that if the alpha is positive, the mutual fund manager generates higher return than its comparing index and is a result of superior portfolio management and below zero is a result of poor management and a lower return than index. The test will be performed at a level of 5 percent level of significance.
The second test is to analyze if the mutual fund takes a more risky position when the market changes. Beta is a measure for the systematic risk for a portfolio. Considering different value of β, whereas values below 1 is considered to be more risk averse and value above 1 is as-sumed to be risk preferring. In a successful active portfolio should the β be high in order to beat the market. The manager should contrarian take a more defensive position when the market goes up. A t-tests will therefore be done of the β for each mutual fund at the signifi-cance of 5 percent and a null hypothesis be constructed as followed:
1 : 1 : 1 ≠ =
β
β
H Hoβ
β
β
ˆ ˆ SE tobs = −where
β
ˆ is the coefficient estimated from the model,β
the beta-value for which one tests the null hypothesis for (in our case; 1) and SEβˆis the calculated standard error. Due to thenumber of observations is the critical value in this two tailed regression -1.96 and 1.96. When the t-test is done and it is known whether the estimated
β
is significant different from one or not. It is the interesting to find evidence if the estimatedβ
for the fund differ be-tween period one and two. To find evidence for the difference is a two tailed test con-structed. The null and alternative hypotheses for the test are:0 ˆ ˆ : 0 ˆ ˆ : 2 1 1 2 1 ≠ − = − period period period period o H H
β
β
β
β
where
β
ˆperiod1 andβ
ˆperiod2is the estimated beta value for period one and two. The value ofthe test will be calculated as followed:
2 2 2 1 2 1 2 1 / / 0 ˆ ˆ period period period period period period n n z
σ
σ
β
β
+ − − = (6)where
σ
period1 andσ
period2 is the standard deviation for period one and two. The standarddeviation will be calculated with the figures from the standard error and the square root of the number of observation:
σ
=( n)S.E.Moreover, nperiod1 and nperiod2 stands for the number of observations in period one and two.
The critical value is -1.96 and 1.96 at 5 percent level of significance.
7 Empirical analysis
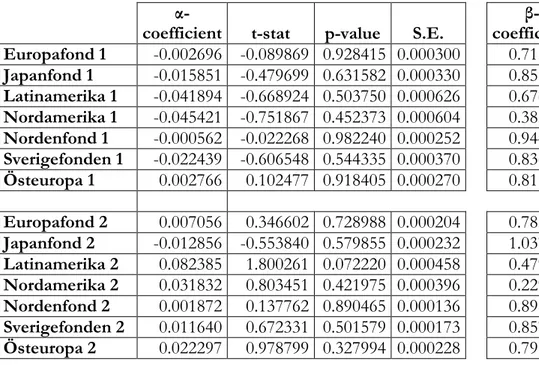
All results are presented in table 2 and Jensen’s index and all other figures are calculated and presented in absolute numbers per day at five percent level of significance.
The time period is divided into two sub periods called 1 and 2. The first period is between 2000-01-01 to 2002-12-31 when the market bears and the second between 2003-01-01 to 2005-12-31 when the market bulls.
The constant and coefficient for each fund is presented horizontal. For the constant α-value is the t-statistics, p-value and Standard Error presented and for the β-coefficient will the Standard Error be revealed.
α-coefficient t-stat p-value S.E.
β-coefficient t-stat S.E. Europafond 1 -0.002696 -0.089869 0.928415 0.000300 0.715596 -14.119083 0.020143 Japanfond 1 -0.015851 -0.479699 0.631582 0.000330 0.855590 -6.137804 0.023528 Latinamerika 1 -0.041894 -0.668924 0.503750 0.000626 0.676742 -6.624739 0.048796 Nordamerika 1 -0.045421 -0.751867 0.452373 0.000604 0.385845 -15.186540 0.040441 Nordenfond 1 -0.000562 -0.022268 0.982240 0.000252 0.944121 -3.473630 0.016087 Sverigefonden 1 -0.022439 -0.606548 0.544335 0.000370 0.836184 -8.254284 0.019846 Östeuropa 1 0.002766 0.102477 0.918405 0.000270 0.811358 -12.998551 0.014513 Europafond 2 0.007056 0.346602 0.728988 0.000204 0.785838 -9.520036 0.022496 Japanfond 2 -0.012856 -0.553840 0.579855 0.000232 1.037375 1.711803 0.021834 Latinamerika 2 0.082385 1.800261 0.072220 0.000458 0.479854 -11.175705 0.046543 Nordamerika 2 0.031832 0.803451 0.421975 0.000396 0.229649 -16.241236 0.047432 Nordenfond 2 0.001872 0.137762 0.890465 0.000136 0.898453 -6.384574 0.015905 Sverigefonden 2 0.011640 0.672331 0.501579 0.000173 0.857609 -7.802604 0.018249 Östeuropa 2 0.022297 0.978799 0.327994 0.000228 0.791199 -12.191908 0.017126
Table 2 Regression results
The estimated model of the regression Y =
α
+β
X shows that the t-values for the intercept α, is not significant from zero at the level of 5 percent for any of the funds in the first time period. This means that we can not reject H0: α=0 and we can not say with certainty that αis different from zero.
The results in the second time period are similar to the first period. None of the funds were significant at 5 percent level of significance. The result for Latinamerika 2 is on the edge with a p-value of 0,072 and would have been significant at 10 percent.
None of the funds shows statistical significant excess payoff or poor performance. The coef-ficient is insignificant and should be considered as approximately zero. The outcome of this is that we can reject our first hypothesis which was stated in the introduction: “Investors in mu-tual funds receives higher return on closely located markets compared with its corresponding index then on dis-tanced markets” because it cannot be statistically proved that investors get higher return.
z-value Europafond -2.32620 Japanfond -5.66343 Latinamerika 2.91973 Nordamerika 2.50587 Nordenfond 2.01916 Sverigefonden -0.79469 Östeuropa 0.89802 Table 3 Results from equation (6)
The second test is to analyze if the mutual fund increases or decreases the beta towards the market when the market goes up/down. In the first period did all indices go down and was a consequence from many highly valued technological companies. Every one of the seven beta
values was highly significant different from 1 at a level of 5 percent which concludes that we can strongly reject the null hypothesis. All funds took as the theory suggests defensive posi-tions with lower risk than the index as a result. Nordamerikafonden turned out to have the outstanding lowest beta value at 0.386 followed by Latinamerikafonden, 0.6767 and Europa-fonden, 0.7156. SverigeEuropa-fonden, Japanfonden and Östeuropafonden have all similar beta val-ues at 0.8-0.85. Highest does Nordenfonden have at 0.9441 which says that for every percent the index goes up, will Nordenfonden goes up with 0.9441 percent and when the index goes down will the fund decrease less.
The key question is whether the β’s are different between the two periods and an investor should according to the theory, increase the β above one when the market goes up to the market in order gain the multiplier effect. The results shows that none of the funds which turned out to be significant, increased their beta value to above one in the second period (Ja-panfonden was the only fund which increased its beta to above 1 but was not statistical sig-nificant with a t-value of 1.712 and the critical value 1.96. We can therefore not reject
0
H :β=1). From table 3, one can observe that the beta values for Europafonden and Japan-fonden turned to have a significant lower beta value in period one compared to period two. Latinamerika, Nordamerika and Nordenfonden turned out to have a significant higher beta value in the second period compared the first. The beta values for Sverigefonden and Östeu-ropafonden did not show any evidence to be significant different between period one and two. One should have in mind that we do not know the exact exposure to the market due to the fact that we do not have the knowledge of how the funds are constructed and what secu-rities they contains.
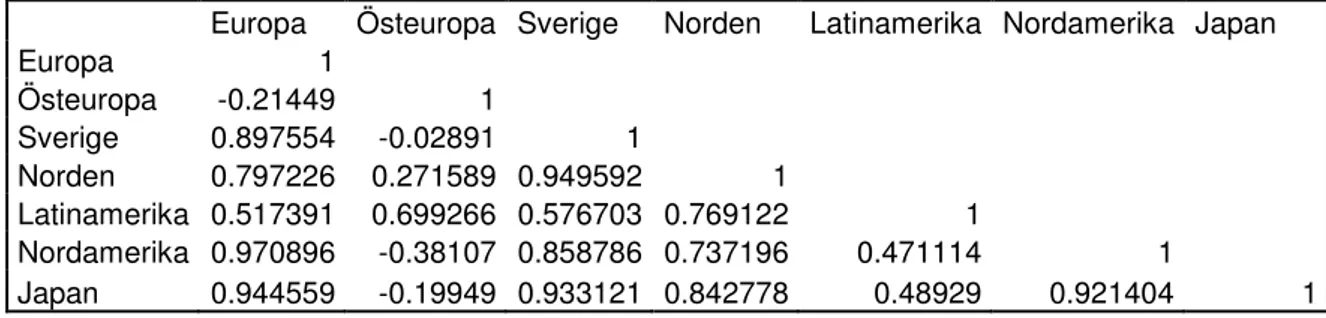
Since there is no evidence of either superior or poor performance from the mutual funds will the correlation coefficient play a more important role and it has been shown that a portfo-lio’s risk can be calculated without knowing the correlation and how it can contribute to a well-diversified portfolio. One should have in mind that the expected payoff is not depend-ent on the correlation and is therefore unchanged over time. The risk, measures with the Standard Error falls however along with the correlation. A lower correlation between the funds results always to lower risk in the portfolio.
Europa Östeuropa Sverige Norden Latinamerika Nordamerika Japan
Europa 1 Östeuropa -0.21449 1 Sverige 0.897554 -0.02891 1 Norden 0.797226 0.271589 0.949592 1 Latinamerika 0.517391 0.699266 0.576703 0.769122 1 Nordamerika 0.970896 -0.38107 0.858786 0.737196 0.471114 1 Japan 0.944559 -0.19949 0.933121 0.842778 0.48929 0.921404 1 Table 4 Correlation matrix
The correlation coefficient between each fund is presented in table 3. One can see that inte-grated, developed and also closely located markets which is represented by Europafonden, Nordenfonden and Sverigefonden correlates highly with each other with coefficients be-tween 0.8 and 0.97. This could depend on similar composition of the portfolio. For the case of Sverigefonden and Nordenfonden it is highly truly because both funds have its main fo-cus on the Swedish stock market. This makes them not appropriate as tools for increased di-versification and lower portfolio risk. The same holds for Nordamerikafonden and Japan-fonden which both are acts on financial markets which is considered as the largest and third
largest in the world. The coefficient between these two markets are 0.92 and almost consid-ered as perfectly correlated.
Östeuropafonden on the other hand is negatively correlated to Europafonden, Nordameri-kafonden and Japanfonden which is interesting because it is not common that investments correlates negatively. Sverigefonden and Östeuropafonden have almost zero in correlation and one can assume that they act independently.
If one looks at the diagram from chapter 2, one can see that both funds who invests on what is classified as an emerging markets managed the financial recession in the first period well and even managed to increase in some individual intervals when the overall world stock market trend fell.
Latinamerikafonden is somewhere in between with values at in the region of 0.5 with Eu-ropafonden, Sverigefonden, Nordamerika and Japan. The first two funds could more easy to explain why they do not correlate higher and it is due to both the geographical distance and the different construction of companies for each fund. Nordamerikafonden and Japanfon-den is different, both hold assets in some of the largest companies in the world and should therefore affect the entire world market. The third fund which it will be hard to find theo-retical evidence for is the relatively strong correlation with Nordenfonden. The funds totally consists of different companies which acts in different sectors. In contradiction will it be less problematic to explain the relationship between the two funds investing on emerging mar-kets, Östeuropafonden and Latinamerikafonden. Both funds have major holdings in raw ma-terial and the petroleum industry which both are traded on a world market and therefore corresponds similar to price changes.
8 Conclusion
The main objective of this paper has been to analyse and find empirical evidence for the de-vice that mutual funds perform better on closely located markets. The concluding remarks from this thesis is that there is no empirical evidence which indicates that managers seize su-perior stock selection skills when investing locally. Only one of the seven funds had signifi-cant results or very close to significance is the first of two hypothesises from chapter 1; “In-vestors in mutual funds receives higher return on closely located markets compared with its corresponding in-dex then on distanced markets” , only supported partially.
Since index represents the average result from all investors is the condition that some of these should systematic exceed the index while some should systematic underperforms com-pared to the index. The main part of the investors on a stock market is often professional traders and the entire group of portfolio managers can not be expected to accomplish a posi-tive result. It can in general only be done if there is a group of managers which constitutes of any reason by non-profit maximizes.
In line with previous studies is it hard to find significant empirical results with a low quantity of funds. Due to non-significant values of superior performance and previous studies as sup-port, it is truly that the average fund has underperformed or at least have grave problems of beating the index on both stages of the business cycle. Parallels can be drawn to Cumby and Glen’s comparison and evaluation between a small sample of international funds and of
do-mestic U.S. equity funds where they did not find any significant evidence of superior per-formance for either U.S. domestic or international funds. This goes also in line with Blake and Timmermann who also found similarly poor performance both domestically and inter-nationally. Engström’s results goes towards the same results but with the difference that closely located funds perform better than distantly but still with a poor performance.The re-sults of this study does not find any significant rere-sults that locals can take advantage of in-formation when investing locally and consequently do better than investing on a distant market.
For the second hypothesis; “Fund managers decreases/increases the exposure to the market when the market bears/bulls”, is there evidence that two out the seven funds followed the theory and in-creased its beta towards the market. Even though, they did not inin-creased above 1 and it can only to some extent be said that the fund managers tend to be risk averse and prefer to take positions in stable “value” companies and prefer to deliver a lower absolute payoff to a lower risk. Their attitude to risk is probably the main factor for why three out of seven funds chooses to lower the risk towards the market due to the large recession on the stock market in 2000-2002.
Finally, this thesis have showed that the introduction of the emerging markets creates further possibilities for diversification. More developed markets appear to have high levels of inte-grations and move together. This integration have reduced the opportunities of geographical diversification due to the fact that the different stock markets reacts similarly. The fund con-centrated on holdings in Eastern Europe does even have negatively correlation coefficient and they intend to move in opposite directions during the examined time period. This is rare and is something a rational investor should have in mind.
8.1 Further Studies
Further studies can be continue the discussion of performance differences with use some of the other measurements provided by Sharp or Treynor. The other two measurements have other properties which could be interesting for investigation. One of the weaknesses of Jen-sen’s index is that if it is due to luck or skill. Many of the studies published can be seen as complex and statistical simplification could be of ones interest.
It would be interesting to study to what extent foreign investors tend to exceed or underper-form the index on a chosen market (e.g. the Swedish) because this result will, with the oppo-site sign, be an active result for domestic portfolio managers.
Finally could it be of one interest to include the administration cost and compare funds from this point of view. Lately have the competition increased and many new low cost funds have been introduced. Does the funds with higher fees perform better then low cost funds?
References
Blake, D., Timmermann, A., (1998) Mutual fund performance: Evidence from the UK. European Finance Review2, 57–77.
Cumby, R.E., Glen, J.D., (1990) Evaluating of international mutual funds. The Journal of Finance 45 (2) 497-521.
Engström, S., (2003) Costly information, diversification and international mutual fund per-formance. Pacific-Basin Finance Journal 11 (2003) 463–482
Fondbolagen, retrieved 2006-04-29 from www.fondbolagen.se
Grossman, S., Stiglitz, J., (1980) On the impossibility of informationally efficient markets. The Ameri-can Economic Review 70, 393-408.
Grubel, H., (1968) “International Diversified Portfolios: Welfare Gains and Capital Flows”, American Economic Review, 58(1968) pg. 1299- 13 14.
Huberman, G., (2001) “Familiarity Breeds Investments” ,The Review of Financial Studies 2001 vol 14 nr 3
Jensen Michael C., (1968) “The performance of mutual funds in the period 1945-1964“,Journal of Finance 1968 vol 23 s 389-416
Markowitz H., (1952) “Portfolio Selection”., John Wiley & Sons Inc, Oxford, U.K Sharpe, W.,(1966) “Mutual Fund Performance”, Journal of Business; 1966 Jan
Shukla, R.K., van Inwegen, G.B., 1995. Do locals perform better than foreigners: An analysis of UK and USmutual fund managers. Journal of Economics and Business 47, 241– 254.
Sjöberg, E and Gavelin, L. (2006) Finansiell ekonomi för rådgivare Finans kompetens: Stockholm Solnik, B., (1974) “Why not diversify internationally?”, Financial Analysts Journal, July- August 1974, pg. 48-54.
Solnik, B. (1996) International investments, Addison Wesley: Boston
Solnik, B. and McLeavey, D. (2003) International investments, Addison Wesley: Boston
Treynor, J.L. (1966) "Can Mutual Funds Outguess the Market", HarvardBusiness Review, 44 131 -136.
Data retrieved from:
Affärsvärlden, http://www.affarsvarlden.se Alfred Berg, by request from http://www.six.se MSCI, http://www.msci.com
Nordea, by request