This is the published version of a paper published in BMC Public Health.
Citation for the original published paper (version of record):
Ahacic, K., Kennison, R., Kåreholt, I. (2014)
Alcohol abstinence, non-hazardous use and hazardous use a decade after alcohol-related
hospitalization: registry data linked to population-based representative postal surveys.
BMC Public Health, 14(874): 1-13
http://dx.doi.org/10.1186/1471-2458-14-874
Access to the published version may require subscription.
N.B. When citing this work, cite the original published paper.
Open Access journal: http://www.biomedcentral.com/bmcpublichealth/
Permanent link to this version:
R E S E A R C H A R T I C L E
Open Access
Alcohol abstinence, non-hazardous use and
hazardous use a decade after alcohol-related
hospitalization: registry data linked to
population-based representative postal surveys
Kozma Ahacic
1,2*, Robert F Kennison
3and Ingemar Kåreholt
4,5Abstract
Background: Although there is evident association between alcohol-related hospitalization and alcohol use, the relationship has not been well examined. This study analyzed the extent of alcohol abstinence, non-hazardous use and hazardous use among people who had experienced alcohol-related hospitalization during the preceding decade.
Method: Registry data concerning alcohol-related hospitalizations between 1996 and 2007 were linked to two representative surveys, in 2006 and 2007, of residents of Stockholm County. Relevant contrasts were modeled, using logistic regression, in the pooled sample (n = 54 955). Ages were 23–84 years at follow-up.
Results: Among persons previously hospitalized (n = 576), half reported non-hazardous use. Non-hazardous use was less prevalent than in the general population– and the extent of non-hazardous use did not change over time following hospitalization. There were no significant age differences, but non-hazardous use was less frequent among people with repeated episodes of care. One in six was abstinent. Abstinence was more common among the old, while hazardous use (exceeding 14 drinks per week for men, and 9 drinks per week for women) decreased with age. Abstinence also increased over time; among persons hospitalized ten years ago, the abstinence rate was twice that of the general population. Associations with hazardous use over time were less conclusive. Hazardous use among those previously hospitalized decreased over time in one sample but not in the other. After pooling the data, there were indications of a decrease over time following hospitalization, but more prevalent hazardous use than in the general population.
Conclusions: Following alcohol-related hospitalization, abstinence increased, and there was no evidence of regression towards the mean, i.e., towards non-hazardous use. Abstinence was also more widespread among previously hospitalized persons of older ages. With advancing age, changing hazardous alcohol habits among previously hospitalized appears to yield a trend towards promotion of abstinence.
Keywords: Treatment, Rehospitalization, Alcohol use disorder (AUD), Controlled drinking, Alcohol dependence, Harmful use of alcohol
* Correspondence:Kozma.Ahacic@ki.se
1
Department of Public Health Sciences, Karolinska Institutet, Tomtebodavägen 18A, 171 77 Stockholm, Sweden
2
Centre for Epidemiology and Community Medicine, Health Care Services, Stockholm County Council, Box 1497, 171 29 Solna, Sweden
Full list of author information is available at the end of the article
© 2014 Ahacic et al.; licensee BioMed Central Ltd. This is an Open Access article distributed under the terms of the Creative Commons Attribution License (http://creativecommons.org/licenses/by/2.0), which permits unrestricted use, distribution, and reproduction in any medium, provided the original work is properly credited.
Background
Excessive use of alcohol is one of the leading causes of morbidity and mortality worldwide [1]. It is the fifth most important modifiable health behavior, having con-sequences not only for the individual but also for family and friends. Society incurs a great cost from the behav-ioral and medical effects of alcohol use, amounting to several percent of gross domestic product [2].
Approximately 15% of the Swedish population has been estimated to exhibit hazardous alcohol use, where hazardous use is defined as an average consumption ex-ceeding 14 drinks per week for men, and 9 drinks per week for women [3]. Urban areas, such as Stockholm, have been associated with slightly higher estimates of al-cohol consumption [4]. And it has been estimated that about one percent of members of the Swedish popula-tion have more severe alcohol use disorders, i.e., indica-tions of harmful use and alcohol dependence. These disorders are associated with numerous behavioral, cog-nitive, and physiological symptoms.
In order to assess the potentially negative conse-quences of alcohol use, yearly rates of alcohol-related hospitalizations are monitored, both in Sweden and else-where. During an average year, approximately one per-cent of Stockholm’s population is hospitalized with an alcohol-related diagnosis [5]. People who have experi-enced alcohol-related hospitalization represent an at risk group that includes the most severe cases of alcohol use disorders.
Among those previously hospitalized, there is a high degree of recidivism, i.e., return to alcohol-related care, which is likely to be associated with continuing exces-sive alcohol use [6]. An analysis of follow-up data indi-cates that, over a ten-year period, approximately two thirds of people hospitalized for alcohol-related issues returned for further inpatient care, while one third never returned [6].
Of those who received alcohol-related inpatient care in Stockholm in 1997, 62 percent were identified as being alcohol dependent, and 18 percent as harmful users [6]. Yet, it should be noted that there is no medical diagnosis that specifically identifies hazardous use as a distinct cat-egory separate from harmful use or alcohol dependence. Also, it is possible for a single episode of excessive alco-hol use to result in hospitalization. For example, minors may be forcibly admitted to hospital by police for detoxi-fication and observation. A large portion of those who are hospitalized for inpatient care are recidivists, which is why the identification of harmful use and dependence predict recurrent care episodes [6].
By studying the alcohol-related behavior of people with previous alcohol-related hospitalization, it is pos-sible to derive measures of the efficacy of treatment. Such information may be useful for the creation of best
practices related to interventions for those in need of care. Currently, for hazardous users, education and brief counseling are the recommended interventions; for harmful use, education and counseling with follow-up to monitor future behavior are recommended [7,8]; and, for alcohol dependency, more advanced treatments, such as detoxification and inpatient care, are recommended. All inpatients are offered alcohol treatment, but the ex-tent to which these patients follow through with their prescribed treatment remains unclear. While some alco-hol users require elaborate interventions from health care providers, most heavy users recover naturally with-out formal treatment [9-13]. For people who have al-cohol behavior issues, a hospitalization may represent “a teachable moment.”
There is a clear need to study alcohol habits among those with prior hospitalizations, and this is the first study to provide prevalence estimates for this population. Other issues that remain unanswered are whether there are gender and age differences in the prevalence of non-hazardous use and abstinence following hospitalization [6,14], and whether alcohol consumption habits change with the passage of time following hospitalization.
This study aims to report on the extent of alcohol ab-stinence, non-hazardous use, and hazardous use among people who experienced alcohol-related hospitalization during the preceding ten years of their lives.
Methods
Stockholm County had 1.4 million inhabitants in 1997, which was the baseline year for the study, and is an expanding metropolitan region. During 1997 the County registered approximately 5,400 patients with at least one alcohol-related inpatient care episode [6]. The public health care programs offered at the time included de-toxification and specialized treatment. The County pro-vides two specialized emergency units for addictive diseases to care for patients with acute substance-related conditions. Although some patients may be the responsi-bility of other hospitals and emergency departments, most patients with an urgent alcohol-related need for medical or psychiatric attention are served by or trans-ferred to these specialized units.
One of two 24-hour outpatient units is likely to pro-vide alcohol-related treatment for people suffering from intoxication in the Greater Stockholm area. These pa-tients may be transferred from urgent care following medical clearance, self-admission, or being brought in by police. Patients who require close supervision, or more than 6 hours to achieve sobriety, are transferred to an in-patient unit. Patients with a high risk of neuropsychological conditions, such as withdrawal seizure or alcohol-withdrawal delirium, may also be transferred to a desig-nated inpatient unit for medical care and observation.
Admission records and treatment data were obtained from the Stockholm County Inpatient Care Register for the time period 1997 to 2007. These registry data are considered reliable, and have been previously used to track time trends in alcoholic disorders [15-17].
The sample
The study sample was based on the combined data from two mail-in surveys carried out in 2006 and 2007; they were each representative of the population of Stockholm County (n = 58 506, response rate 55.3 percent). The 2006 survey (n = 34 707, response rate 61.3 percent) was a cross-sectional study, while the 2007 survey (n = 23 797, response rate 49.7 percent) was a follow-up to a longitudinal study initiated in 2002. The respondents from the baseline testing in 2002 were re-recruited in 2007, excluding those who had moved or died. The baseline response rate was 62.5 percent in 2002, while the follow-up response rate was 79.6 percent in 2007. The 2006 survey included persons born between 1922 and 1988, while the 2007 survey included those born between 1918 and 1984. To get the same age span at baseline, i.e., 13–74 years, the 1921–1983 birth cohorts (n = 32 626) were included from the 2006 survey, and the 1922–1984 birth cohorts (n = 23369) from the 2007 survey. From among these respondents, three percent (n = 1735) were excluded from the analysis because they failed to respond to one or more of the items concern-ing alcohol use, which was necessary for categorization of the outcome variables.
In responding to the surveys, respondents consented to have their survey data linked to health registers. The surveys were administered by Statistics Sweden. Linking the survey responses to national registers gave informa-tion about the respondents’ alcohol-related hospitaliza-tions. The study was approved by the local ethical committee in Stockholm of the Central Ethical Review Board (diary number: 2010/704).
Measures
Alcohol consumption
Alcohol consumption during a typical week was measured using a beverage-specific grid from the 2006 survey. It is a period-specific normal week (PSNW) measure [18,19]. The grid has four rows, with a single row comprising the first four days of the week, and with separate rows for the weekend days, Friday, Saturday, and Sunday. Different col-umns correspond to the types of beverages: spirits, fermented wine, wine, beer, and low-alcohol beer. The responders filled in the estimated volume they had consumed by day of the week and beverage. In 2007, the AUDIT-C instrument [20,21] was used instead of the grid. Both measures identified abstainers, hazardous alco-hol users, and non-hazardous users. Hazardous use in the
PNSW is defined as alcohol consumption in excess of 14 (men), or of 9 (women), normal glasses (equivalent to 12 g of pure alcohol) per week (which corresponds to scores of 8+ for men and 6+ for women in AUDIT-C) [22]. Con-sumption less than that was defined as non-hazardous.
Alcohol-related hospitalizations
The diagnoses used in the register follow the International Classification of Diseases (ICD-10) [23]. All care episodes in 1997–2006 and in 1998–2007, respectively, were exam-ined for the following alcohol-induced or -related diagno-ses: alcohol intoxication, corresponding to F10.0; acute intoxication due to alcohol, or T51 toxic effect of alcohol; harmful use of alcohol F10.1; alcohol dependence F10.2; alcohol-induced chronic pancreatitis K86.0; alcoholic liver disease K70; alcohol-induced pseudo-Cushing's syndrome E24.4; degeneration of nervous system due to alcohol G31.2; alcoholic polyneuropathy G62.1; alcoholic myopathy G72.1; alcoholic cardiomyopathy I42.6; alcoholic gastritis K29.2; maternal care for (suspected) damage to fetus from alcohol O35.4; fetus and new-born affected by maternal use of alco-hol P04.3; fetal alcoalco-hol syndrome Q86.0; blood alcoalco-hol level Y90; alcohol intoxication Y91; alcohol rehabilitation Z50.2; alcohol abuse counseling and surveillance Z71.4; mental and behavioral disorders due to use of alcohol (F10), including withdrawal state F10.3, delirium F10.4, psychotic disorder F10.5 & F10.7, amnesic syndrome F10.6, and other mental and behavioural disorders F10.8 & F10.9.
Four different variables were created to capture hospitalization history: a dichotomous outcome that referred to whether people had been hospitalized with any of the above diagnoses or not; the number of years since last hospitalization; the number of hospitalization sodes; and, the number of years with hospitalization epi-sodes. The last two, the number of episodes and the number of years with episodes, were needed to control for the second variable, the number of years since last hospitalization, in order to enable more reasonable com-parisons within the models. These variables were assumed to be continuous in the reported regression models, but are presented as grouped measures in Tables 1 and 2.
Analysis
First, bivariate relationships were estimated in the entire sample for the variables: hospitalization, survey, gender, and age group. Then, bivariate relationships were esti-mated separately among the hospitalized for the vari-ables: survey, gender, age group, number of years since hospitalization, number of hospitalizations during a year, and number of years with hospitalization.
The first regression model included the independent variables for hospitalization, survey, gender, and age group for the entire sample, while the second model considered the same variables for the previously hospitalized. As well
as survey, gender, and age group, the second model for the previously hospitalized included: number of years since last hospitalization, number of hospitalizations dur-ing a year, and number of years with hospitalization.
In a third model, all the estimated variable categories from the first two models were included. The contrasts for the variable categories among those with previous hospitalization were changed and set to show relevant interaction terms, i.e., whether the odds ratios between
the variable categories among the hospitalized differed significantly from the corresponding odds ratios among the non-hospitalized.
Finally, to find possible deviations between survey pat-terns, the third model was estimated separately for the two surveys. If needed, suitable interaction terms for these possible deviations were then modeled. This was the case for the outcome, hazardous use, where results differed significantly between the two survey samples on
Table 1 Descriptive data
All With previous alcohol-related hospitalizations
Percent n Percent n Alcohol use Abstinent 11.1 6087 16.3 94 Non-hazardous use 73.3 40260 51.6 297 Hazardous use 15.7 8608 32.1 185 100.0 54955 100.0 576 Previous hospitalizations 1.3 576 100.0 576 No hospitalizations 98.7 54379 0.0 0 Survey 2006 58.8 32331 64.6 372 2002/2007 41.2 22624 35.4 204 Gender Men 44.6 24534 62.0 357 Women 55.4 30421 38.0 219 Age group 23-34 17.6 9672 12.5 72 35-44 21.1 11549 12.9 74 45-54 18.4 10114 20.2 116 55-64 20.9 11453 30.7 176 65-84 22.0 12035 23.7 136
Years since last hospitalization
Last hospitalized: 99.0 54379 - 0
The same year 0.2 125 21.7 125
2-4 years ago 0.4 210 36.5 210
5-7 years ago 0.2 137 23.8 137
8-10 years ago 0.2 104 18.1 104
Number of years with hospitalizations
0 99.0 54379 - 0 1 0.7 370 64.2 370 2 0.2 100 17.4 100 3+ 0.2 106 18.4 106 Number of hospitalizations 0 99.0 54379 - 0 1 0.5 276 47.9 276 2 0.2 104 18.1 104 3+ 0.4 196 34.0 196
the variable that measured change in odds over time since hospitalization.
The models were fitted to each of the three outcome measures: 1) abstinence in comparison with non-hazardous use or hazardous use, 2) hazardous use in comparison with non-hazardous use or abstinence, and 3) non-hazardous use in comparison with abstinence or hazardous use.
Logistic regression models using Proc Logistic in SAS 9.2 [24] were used to assess the relationships.
Results
Just over one percent of the population was hospitalized during the ten-year follow-up period. Table 1 shows the prevalence of abstainers, non-hazardous users, and haz-ardous alcohol users combined, and of persons with pre-vious alcohol-related hospitalizations separately. For the
entire sample, 11% were abstainers, while 16% were abstainers among those with previous hospitalization. The corresponding figures for non-hazardous use were 73% and 52%; and, for hazardous use, 16% and 32%.
Among the previously hospitalized, respondents from the 2006 survey were overrepresented in comparison with the 2007 survey. Similarly, there were fewer persons in the younger age groups 23–34 and 35–44, and more in the 55–64 age group among the previously hospital-ized in comparison with the general population. Men were overrepresented in comparison with women.
A less frequent outcome was having recently been hospitalized. Among those previously hospitalized, one fifth had been hospitalized during the preceding year, two fifths had been hospitalized during the three years before that, and two fifths had been hospitalized more
Table 2 Percentage of abstainers, non-hazardous, and hazardous alcohol users by the subcategories of the independent variables for the entire sample and among the persons with previous alcohol-related hospitalizations
All With previous alcohol- related hospitalizations
Abstinence Non-hazardous use Hazardous use Abstinence Non-hazardous use Hazardous use Survey 2006 12.4 66.9 20.7 16.4 49.7 33.9 2002/2007 9.2 82.3 8.5 16.2 54.9 28.9 Gender Men 8.0 74.8 17.1 15.1 53.8 31.1 Women 13.5 72.0 14.5 18.3 48.0 33.8 Age group 23-34 10.9 71.6 17.5 4.2 51.4 44.4 35-44 9.8 75.5 13.8 23.0 41.9 35.1 45-54 9.2 72.3 18.5 17.2 44.0 38.8 55-64 8.8 73.3 17.9 18.2 51.1 30.7 65-84 16.0 72.3 11.7 16.2 64.0 19.8 No hospitalization Last hospitalized: 11.0 73.5 15.5
The same year 8.0 53.6 38.4
2-4 years ago 15.7 49.0 35.2
5-7 years ago 20.4 51.1 28.5
8-10 years ago 22.1 54.8 23.1
Number of years with hospitalizations
0 11.0 73.5 15.5 1 14.6 52.4 33.0 2 19.0 57.0 24.0 3+ 19.8 43.4 36.8 Number of hospitalizations 0 11.0 73.5 15.5 1 13.4 52.5 34.1 2 15.4 53.8 30.8 3+ 20.9 49.0 30.1
than four years ago (including one fifth who had been hos-pitalized between seven and ten years ago). Half had been hospitalized more than once during follow-up. A third had been hospitalized during two or more separate years.
Table 2 shows the distribution of percentages of alcohol use in the different categories of the independent vari-ables. The bivariate analyses shown in Tables 3, 4 and 5 give the corresponding relative probabilities and signifi-cance levels.
Abstinence
The bivariate associations are expressed as relative odds in Table 3. They indicate that the prevalence of abstin-ence was higher among hospitalized than among non-hospitalized respondents, lower in 2007 than in 2006, and higher for women than for men. Abstinence rates were also generally higher for the youngest age group in comparison with the older age groups. The one excep-tion was the oldest age group (65–84), which had the highest prevalence.
Among the previously hospitalized, the odds for ab-stinence did not differ significantly between the two sur-veys or by gender. In comparison with the youngest age group (23–34), the odds of abstinence were higher in all the other older age groups. Odds for abstinence also in-creased significantly with number of years since last hospitalization.
Models 1 and 2 showed that including all variables in the same models attenuated the estimates some-what, but the overall pattern in the results remained the same.
Model 3 showed the results corresponding to models 1 and 2 when variables from both the models were in-cluded in the same model, but with alternative contrasts for the hospitalized. The first block of rows in Table 3 corresponds to the relative odds among the non-hospitalized. That is, in comparison with Model 1, the estimated odds ratios can now be said to exclude the hospitalized. In comparison with Model 2, the last rows for the hospitalized show contrasts reflecting the inter-action terms. Relative odds are given for the non-hospitalized in comparison with the non-hospitalized. That is, the estimated odds ratios show whether the odds ra-tios for the hospitalized deviate significantly from the odds ratios for the non-hospitalized for the different categories of the independent variables. The interaction terms in Model 3 indicate that the odds ratios for ab-stinence did not differ significantly for the hospital-ized in comparison with the non-hospitalhospital-ized for the survey and gender variables, but they were signifi-cantly different among the hospitalized with regard to age group.
Models 2 and 3 also showed that the odds for abstinence increased with number of years since last hospitalization,
even when adjusted for survey, gender, age group, years with hospitalization, and number of hospitalizations.
Non-hazardous use
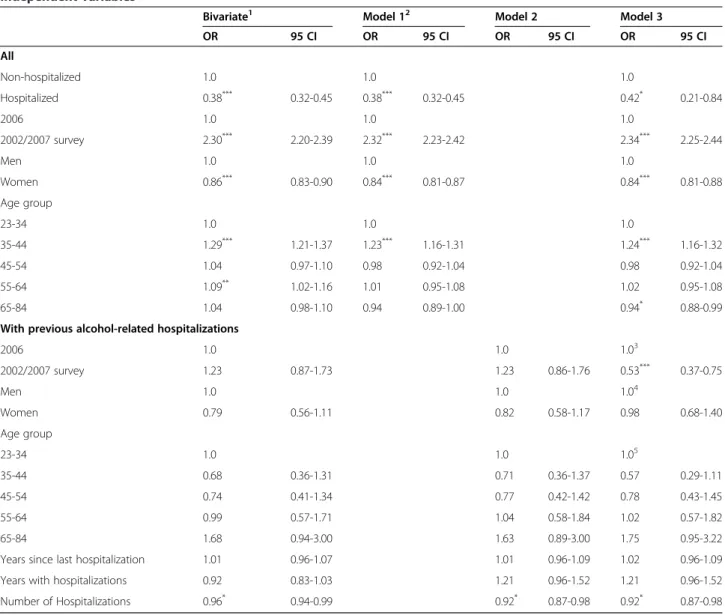
The bivariate associations in Table 4 indicate that the odds for non-hazardous use were lower among hospital-ized than among non-hospitalhospital-ized respondents, higher in the 2007 study than in the 2006 study, and lower for women than for men. The odds for non-hazardous use were similar across the different age groups, with the ex-ception of the 35–44 and 55–64 groups, which were as-sociated with somewhat higher prevalence.
Model 1, for the outcome, non-hazardous use, showed that including all variables in the same model attenuated the bivariate estimates for the non-hospitalized, although the overall pattern of results remained the same.
As shown in Table 4, Model 2 indicated that, among the previously hospitalized, the odds for non-hazardous use did not differ significantly between surveys, by gender, or by age group. The odds for non-hazardous use decreased with an increasing number of hospitalizations.
Model 3 showed only one significant interaction term for the hospitalized in comparison with the non-hospitalized. It indicated that the higher estimate for non-hazardous use in the 2002/2007 survey in com-parison with the 2006 survey deviated significantly for the hospitalized. The odds ratio of 1.23 between the surveys (from Model 2) among the hospitalized was significantly lower (0.53 times lower) than the corre-sponding odds ratio of 2.32 (from Model 1) for the non-hospitalized.
Hazardous use
In Table 5, the bivariate associations, and also Model 1, indicated that the odds for hazardous use were higher among hospitalized than among non-hospitalized re-spondents, lower in the 2007 study than in the 2006 study, and lower for women than for men. The odds for hazardous use were similar in the youngest age group compared with the older age groups, with the exceptions of the 35–44 and 65–84 age groups, which had some-what lower prevalence rates.
Among the previously hospitalized, both the bivariate associations and Model 2 indicated that the odds for hazardous use did not differ significantly between sur-veys or by gender. Older age groups were associated with lower odds for hazardous use, significantly so for the 55–64 and 65–84 age groups. The odds for hazard-ous use decreased with increasing number of years since last hospitalization. A comparison of the estimates for models 1 and 2 with the bivariate results suggests that, although the inclusion of additional variables in models 1 and 2 attenuated the estimates, the pattern in the re-sults remained similar.
The significant interaction terms for the hospital-ized in Model 3 indicated that the survey and age group relationships deviated significantly between the hospitalized and the non-hospitalized. The age group relationships were significantly different, and the OR of 0.84 between the surveys (from Model 2) among
the hospitalized was significantly higher (2.36 times larger) than the OR of 0.35 (from Model 3) among the non-hospitalized.
The bivariate odds for hazardous use decreased with number of years since last hospitalization. As models 2 and 3 indicated, this was true even after adjustment for
Table 3 Odds ratios (OR) for abstaining from alcohol from logistic regression models with previous alcohol-related hospitalization, gender, age group, and interactions between hospitalization and; gender, age group, numbers of years after hospitalization, number of hospitalizations during a year, and number of years with hospitalizations as independent variables
Bivariate1 Model 12 Model 2 Model 3
OR 95 CI OR 95 CI OR 95 CI OR 95 CI All Non-hospitalized 1.0 1.0 1.0 Hospitalized 1.58*** 1.26-1.96 1.75*** 1.39-2.19 0.11*** 0.03-0.73 2006 1.0 1.0 1.0 2002/2007 survey 0.72*** 0.68-0.76 0.69*** 0.65-0.73 0.69*** 0.65-0.73 Men 1.0 1.0 1.0 Women 1.79*** 1.69-1.90 1.84*** 1.74-1.95 1.85*** 1.74-1.96 Age group 23-34 1.0 1.0 1.0 35-44 0.89*** 0.81-0.97 0.92 0.84-1.01 0.90* 0.83-0.99 45-54 0.83*** 0.76-0.91 0.87** 0.79-0.95 0.86** 0.78-0.94 55-64 0.80*** 0.73-0.87 0.84*** 0.77-0.92 0.83*** 0.75-0.91 65-84 1.57*** 1.45-1.70 1.69*** 1.56-1.83 1.68*** 1.55-1.82
With previous alcohol-related hospitalizations
2006 1.0 1.0 1.03 2002/2007 survey 0.98 0.62-1.56 0.94 0.58-1.52 1.37 0.84-2.22 Men 1.0 1.0 1.04 Women 1.25 0.80-1.96 1.41 0.88-2.27 0.76 0.47-1.23 Age group 23-34 1.0 1.0 1.05 35-44 6.86** 1.91-24.59 8.51** 2.33-31.10 9.41*** 2.57-34.49 45-54 4.79* 1.37-16.76 6.18** 1.72-22.24 7.22** 2.00-26.06 55-64 5.11** 1.51-17.27 6.99** 2.00-24.40 8.45*** 2.41-29.62 65-84 4.44* 1.28-15.38 6.67** 1.85-24.05 3.97* 1.10-14.34
Years since last hospitalization 1.13** 1.04-1.22 1.19*** 1.09-1.30 1.19*** 1.09-1.30
Years with hospitalizations 1.05 0.92-1.21 1.11 0.89-1.38 1.11 0.89-1.38
Number of Hospitalizations 1.01 0.99-1.04 1.01 0.97-1.04 1.01 0.97-1.04
*p < .05 **p < .01 ***p < .001.
1
First bivariate relationships for the variables hospitalization, survey, gender and age groups were estimated in the entire sample, then bivariate relationships were estimated separately for the hospitalized including the three additional variables, i.e., number of years since hospitalization, number of hospitalizations during a year, and number of years with hospitalizations.
2
In Models 1 and 2 the variables hospitalization, survey, gender, and age group were included in the first model for the entire sample, while the second model estimated relationships among previously hospitalized. Besides gender and age group, the second model for the previously hospitalized also included the three variables: number of years since the last hospitalization, the number of hospitalizations during a year, and the number of years with hospitalizations.
3
In Model 3 contrasts among those with previous hospitalizations show the interaction terms, i.e., whether the OR between surveys among the hospitalized differ significantly from the corresponding OR for the non-hospitalized. In this case OR was 1.37 times larger than 0.69.
4
The contrast shows the interaction term, i.e., OR was 0.76 times that of 1.85.
5
The contrasts show the interaction terms. Since age group 23–34 is the reference category its deviation corresponds to OR between the hospitalized and the not hospitalized in general. Thus, for age group 23–34 OR for the hospitalized was 0.11 times that of the hospitalized (because the corresponding OR for the non-hospitalized in this age group is 1.0).
survey, gender, age group, years with hospitalization, and number of hospitalizations.
Further analysis indicated that, while the proportion of hospi-talized decreased over time in one sample, there was a non-significant change in the other sample over time. A comparison between the samples indicated that they showed different
trends, yet when pooled, the two samples indicated a significant decrease in hazardous use over time following hospitalization.
Discussion
Our results show that previously hospitalized persons are characterized by a lower probability of non-hazardous use;
Table 4 Odds ratios (OR) for non-hazardous alcohol use from logistic regression models with previous alcohol-related hospitalization, gender, age group, and interactions between hospitalization and; gender, age group, numbers of years after hospitalization, number of hospitalizations during a year, and number of years with hospitalizations as independent variables
Bivariate1 Model 12 Model 2 Model 3
OR 95 CI OR 95 CI OR 95 CI OR 95 CI All Non-hospitalized 1.0 1.0 1.0 Hospitalized 0.38*** 0.32-0.45 0.38*** 0.32-0.45 0.42* 0.21-0.84 2006 1.0 1.0 1.0 2002/2007 survey 2.30*** 2.20-2.39 2.32*** 2.23-2.42 2.34*** 2.25-2.44 Men 1.0 1.0 1.0 Women 0.86*** 0.83-0.90 0.84*** 0.81-0.87 0.84*** 0.81-0.88 Age group 23-34 1.0 1.0 1.0 35-44 1.29*** 1.21-1.37 1.23*** 1.16-1.31 1.24*** 1.16-1.32 45-54 1.04 0.97-1.10 0.98 0.92-1.04 0.98 0.92-1.04 55-64 1.09** 1.02-1.16 1.01 0.95-1.08 1.02 0.95-1.08 65-84 1.04 0.98-1.10 0.94 0.89-1.00 0.94* 0.88-0.99
With previous alcohol-related hospitalizations
2006 1.0 1.0 1.03 2002/2007 survey 1.23 0.87-1.73 1.23 0.86-1.76 0.53*** 0.37-0.75 Men 1.0 1.0 1.04 Women 0.79 0.56-1.11 0.82 0.58-1.17 0.98 0.68-1.40 Age group 23-34 1.0 1.0 1.05 35-44 0.68 0.36-1.31 0.71 0.36-1.37 0.57 0.29-1.11 45-54 0.74 0.41-1.34 0.77 0.42-1.42 0.78 0.43-1.45 55-64 0.99 0.57-1.71 1.04 0.58-1.84 1.02 0.57-1.82 65-84 1.68 0.94-3.00 1.63 0.89-3.00 1.75 0.95-3.22
Years since last hospitalization 1.01 0.96-1.07 1.01 0.96-1.09 1.02 0.96-1.09
Years with hospitalizations 0.92 0.83-1.03 1.21 0.96-1.52 1.21 0.96-1.52
Number of Hospitalizations 0.96* 0.94-0.99 0.92* 0.87-0.98 0.92* 0.87-0.98
*p < .05 **p < .01 ***p < .001.
1
First bivariate relationships for the variables hospitalization, survey, gender and age groups were estimated in the entire sample, then bivariate relationships were estimated separately for the hospitalized including the three additional variables, i.e., number of years since hospitalization, number of hospitalizations during a year, and number of years with hospitalizations.
2
In Models 1 and 2 the variables hospitalization, survey, gender, and age group were included in the first model for the entire sample, while the second model estimated relationships among previously hospitalized. Besides gender and age group, the second model for the previously hospitalized also included the three variables: number of years since the last hospitalization, the number of hospitalizations during a year, and the number of years with hospitalizations.
3
In Model 3 contrasts among those with previous hospitalizations show the interaction terms, i.e., whether the OR between surveys among the hospitalized differ significantly from the corresponding OR for the non-hospitalized. In this case OR was 1.37 times larger than 0.69.
4
The contrast shows the interaction term, i.e., OR was 0.76 times that of 1.85.
5
The contrasts show the interaction terms. Since age group 23–34 is the reference category its deviation corresponds to OR between the hospitalized and the not hospitalized in general. Thus, for age group 23–34 OR for the hospitalized was 0.11 times that of the hospitalized (because the corresponding OR for the non-hospitalized in this age group is 1.0).
they are, however, not only more likely to be hazardous users but also more likely to become abstainers as time passes following hospitalization. Evidence of continuing excessive alcohol use has also been indicated previously by their high rate of return to alcohol-related care [6].
Of persons with previous alcohol-related morbidity, one in six reported abstinence, and half non-hazardous use. While non-hazardous use was found to be less prevalent than in the general population, our estimate is considerably higher than in previous studies of other
Table 5 Odds ratios (OR) for hazardous alcohol use from logistic regression models with previous alcohol-related hospitalization, gender, age group, and interactions between hospitalization and; gender, age group, numbers of years after hospitalization, number of hospitalizations during a year, and number of years with hospitalizations as independent variables
Bivariate1 Model 12 Model 2 Model 3
OR 95 CI OR 95 CI OR 95 CI OR 95 CI All Non-hospitalized 1.0 1.0 1.0 Hospitalized 2.58*** 2.16-3.08 2.41*** 2.01-2.89 6.12*** 2.97-12.62 2006 1.0 1.0 1.0 2002/2007 survey 0.36*** 0.34-0.38 0.36*** 0.34-0.38 0.35*** 0.34-0.37 Men 1.0 1.0 1.0 Women 0.82*** 0.78-0.86 0.83*** 0.79-0.87 0.83*** 0.79-0.87 Age group 23-34 1.0 1.0 1.0 35-44 0.75*** 0.70-0.81 0.78*** 0.73-0.85 0.79*** 0.73-0.85 45-54 1.07 0.99-1.15 1.13** 1.05-1.21 1.13** 1.05-1.22 55-64 1.02 0.96-1.10 1.09* 1.01-1.17 1.10** 1.03-1.19 65-84 0.62*** 0.58-0.67 0.67*** 0.62-0.72 0.68*** 0.63-0.73
With previous alcohol-related hospitalizations
2006 1.0 1.0 1.03 2002/2007 survey 0.79 0.55-1.15 0.84 0.57-1.23 2.36*** 1.59-3.49 Men 1.0 1.0 1.04 Women 1.13 0.79-1.62 1.01 0.69-1.48 1.22 0.83-1.80 Age group 23-34 1.0 1.0 1.05 35-44 0.68 0.35-1.32 0.60 0.30-1.18 0.76 0.38-1.50 45-54 0.79 0.44-1.44 0.64 0.34-1.19 0.56 0.30-1.06 55-64 0.55* 0.32-0.97 0.44** 0.24-0.80 0.40** 0.22-0.73 65-84 0.31*** 0.16-0.58 0.25*** 0.13-0.49 0.37*** 0.19-0.72
Years since last hospitalization 0.91** 0.85-0.97 0.88*** 0.82-0.94 0.88***6 0.82-0.94
Years with hospitalizations 1.06 0.94-1.18 0.88 0.72-1.08 0.88 0.72-1.08
Number of Hospitalizations 1.02 1.00-1.04 1.04 0.99-1.08 1.04 0.99-1.08
*p < .05 **p < .01 ***p < .001.
1
First bivariate relationships for the variables hospitalization, survey, gender and age groups were estimated in the entire sample, then bivariate relationships were estimated separately for the hospitalized including the three additional variables, i.e., number of years since hospitalization, number of hospitalizations during a year, and number of years with hospitalizations.
2
In Models 1 and 2 the variables hospitalization, survey, gender, and age group were included in the first model for the entire sample, while the second model estimated relationships among previously hospitalized. Besides gender and age group, the second model for the previously hospitalized also included the three variables: number of years since the last hospitalization, the number of hospitalizations during a year, and the number of years with hospitalizations.
3
In Model 3 contrasts among those with previous hospitalizations show the interaction terms, i.e., whether the OR between surveys among the hospitalized differ significantly from the corresponding OR for the non-hospitalized. In this case OR was 1.37 times larger than 0.69.
4
The contrast shows the interaction term, i.e., OR was 0.76 times that of 1.85.
5
The contrasts show the interaction terms. Since age group 23–34 is the reference category its deviation corresponds to OR between the hospitalized and the not hospitalized in general. Thus, for age group 23–34 OR for the hospitalized was 0.11 times that of the hospitalized (because the corresponding OR for the non-hospitalized in this age group is 1.0).
6
treatment populations [25]. As expected, hazardous use was found to be more prevalent than in the general population. The extent of hazardous use in the general population in this study is in line with previous popula-tion estimates [4].
The likelihood of non-hazardous use decreases with number of hospitalizations. This is in line with the general finding that prior hospitalization is one of the strongest predictors of further hospitalization [26].
In line with a previous study, we found the level of hazardous use to be higher for men than for women among people in general [4]. Among the previously hos-pitalized, there seem to be no significant gender differ-ences in non-hazardous use, abstinence, and hazardous use. This finding contradicts some earlier treatment studies, which suggest that women fair better following treatment [6,14,27].
Almost half were found to be hazardous users in the youngest age group among the previously hospitalized. This percentage decreased gradually with age, and one fifth were hazardous users in the oldest age group (65–84). Although abstinence was lower in the youngest age group among the previously hospitalized, there were no signifi-cant age differences in non-hazardous use. The greater ex-tent of hazardous use in younger ages appears to contradict the previous finding that they are less likely to return for further alcohol-related hospital care [6,28]. How-ever, people in the youngest age group are at the beginning of their alcohol-usage history, which may account for their lower probability of receiving further care despite their greater extent of hazardous use.
The proportion of persons who did not change (32 percent with hazardous use at follow-up) lies within the range of estimates indicated by previous studies on other treatment populations [29-32]. However, previous esti-mates vary widely, probably due to variations in inclusion criteria, study design, and measurement differences– be-sides divergences in treatment effects. For example, in a larger American population-based study with retro-spective data, 28 percent of the treated individuals, compared with 24 percent of those who were never treated, were still dependent on alcohol one year later when assessed using DSM-IV criteria [33]. According to another study, between 17 and 79 percent of the per-sons who went through treatment had not recovered when assessed at follow-up [29]. In a treatment-outcome study in Stockholm County, 63 percent were still heavy users after one year, while the corresponding estimate in a US study sample was 46 percent [34].
Abstinence has historically been recognized as the suc-cessful treatment outcome for people with alcohol-use disorders [25,35-40], although some high consumers have periods of abstinence followed by relapse. The esti-mated abstinence rate following treatment ranges from
34 to 64 percent [30,31,36,41]. Some of the persons diagnosed as alcohol dependent develop non-hazardous use following treatment, where estimates have ranged from 3 to 32 percent [25,41]. In the previously men-tioned treatment-outcome study of hospitalized inhabi-tants of Stockholm, 23 percent reported non-hazardous use, while 14 percent were abstinent one year after treatment [34].
The current results are in line with the suggestion of some treatment-programs, e.g., Alcoholics Anonymous, that abstinence may be necessary to change hazardous habits among some persons [25,31,32]. In our study, pre-viously hospitalized persons appeared to drift towards ab-stinence, whereas the aggregated extent of non-hazardous use after the hospitalization event remained similar over time and lower than among persons who had not been hospitalized. Previous treatment studies have indicated a mixed picture [29-32,42-50]. Although some data support the notion of an increased abstinence rate over time after treatment [29], no study has formally addressed this par-ticular issue. The closest is a study that has proposed that development over time may be best characterized as an increase in stochastic change in behavior [45]. This is an issue that deserves further study.
It seems reasonable that alcohol-related behaviors as-sociated with this particular at-risk group tend to be more unstable. Repeated changes in alcohol behavior are likely to contribute to lower estimates of hazardous use. Given the high risk of returning to alcohol-related in-patient care, our estimates of hazardous use may actually be quite low.
Registry data in its current form provide valuable infor-mation, but such data can be of greater value if additional information is collected. Additional information on alco-hol consumption and a classification into types of behav-ioral treatment provided would be beneficial. Follow-up data would also be informative. For example, records of six-month post-treatment visits, or a telephone or internet survey of alcohol use, could provide important time-based information that would potentially enable monitoring of treatment outcomes and provide information for future reforms (e.g., changes in treatment protocols). Such evalu-ation should cover all registered cases. More restrictive in-clusion criteria are likely to affect success rates negatively. Such follow-up may require increased efforts to reach the targeted population, possibly in mixed modes or even with proxy reports, since previously hospitalized persons are known to be more likely to become non-responders.
Despite rather high recidivism, reflected in a high rate of return to alcohol-related inpatient care, a majority of people hospitalized for alcohol-related issues report non-hazardous alcohol use or abstinence. This information is important to bear in mind when treating hospitalization as a negative outcome of excessive alcohol use. There is a
need for future research that enables overtime comparison between people who receive inpatient care and those who receive other forms of treatment or no treatment at all.
Limitations
In epidemiological monitoring, measures of self-reported alcohol consumption are a necessity. Without such data, it would not be possible to study distributions and trends among subpopulations and risk groups. Nonetheless, it is well-known that all self-reports underestimate consump-tion in comparison with sales figures. The data-collecconsump-tion mode, e.g., web, mail, telephone, or face-to-face interview, seems to play only a minor role [51,52]. Still, even if preva-lence estimates may be skewed, trends should be un-biased, given that under-reporting probably remains the same over time.
This study was based on a mixed cohort; even among the hospitalized, a substantial proportion were without an alcohol-disorder diagnosis (e.g., harmful use or de-pendence). Differences in inclusion criteria suggest that our results may not be comparable with those of other studies that use treatment samples. In particular, in the current study, brief therapy and prior assessment by health care personnel may have affected the estimated rates of hazardous use among people without a depend-ence or harmful-use diagnosis.
Another limitation of this study is that it is unclear what hospitalization involved in terms of treatment. Al-though the effects of counseling are well understood, not all patients will have chosen to receive such treat-ment. Studies have indicated that even being questioned at an ordinary health care reception may be related to decreased alcohol use [53]. Earlier research has indicated that outpatient care following hospitalization decreases the risk of re-hospitalization [14]. Our results suggest that it may be important to perform follow-ups with pa-tients over a longer time period to monitor changes in alcohol use and treatment effects.
While it may be presumed that the hospitalized had hazardous use at the time of their hospitalization, this may not necessarily have been the case. The current study was not able to control for this possibility because there was no measurement of their alcohol use at this time. Also, the measurement instruments used may have been poor at capturing the alcohol habits of this particu-lar population. The instruments require that respon-dents assess their average habit, something that may be difficult for persons whose consumption varies consider-ably. The PSNW measure asks for the consumed volume of alcohol a typical week, and AUDIT for the average daily, weekly, or monthly number of glasses during the preceding year.
The group of hazardous users in the longitudinal study sample delimited by AUDIT-C was smaller, suggesting
stricter selection of participants. However, this might be deceptive because the lower rate of hazardous use may also have been caused by the selective attrition associ-ated with longitudinal studies.
The sampling frames for both studies were similar, but one was cross-sectional, whereas the other was a follow-up to a baseline study. The follow-follow-up study had attrition, so its non-response rate was higher than in the cross-sectional study. Potential bias associated with the higher non-response rate for the follow-up study may have af-fected our results. It is well-known that attrition, as well as initial non-response, is related to alcohol use. At the same time, it seems less plausible that attrition explains the finding of decreased hazardous use over time in just one of the two samples.
In general, non-response together with selective mor-tality is likely to skew results towards healthier behaviors. A previous study has shown that persons who have been hospitalized for alcohol-related reasons are more than two times more likely to become non-responders [54]. Future analyses of selection effects could be made, possibly by linking registry data in longitudinal designs, with repeated-measurements samples, including data on persons who die or move between baseline and follow-up.
There is also a need to validate registry data concern-ing the alcohol-related diagnoses. For example, there may be underreporting due to the social stigma associ-ated with these diagnoses.
Another study limitation is inherent in its design. It is a limitation shared with most longitudinal studies. In our case, the influences due to the passage of time since last hospitalization were potentially confounded by the changes in health care between 1996 and 2007. This also means that there are competing interpretations of the results. The decreasing abstinence rate may have been the result of a gradually diminishing treatment ef-fect during the follow-up period. Alternatively, it may have come about through changes in the selection of people who received treatment during the follow-up period; that is, the characteristics of patients changed in such a way that abstinence after treatment decreased continuously during the decade under study. It should be noted that the number of persons who underwent alcohol-related hospitalization during any one year in-creased in Stockholm between 1997 and 2007 [5]. Such interpretations, however, seem implausible to us, but they cannot be dismissed on grounds of the present data.
In sum, differences in measures and design between the surveys, random variability between years, and se-lective mortality may all have affected the results in general and the differences in results between the two samples. Overall, a decrease in hazardous use was ob-served over time.
Our investigation focused on alcohol-related hospitalization. Its findings should not be generalized to minor and more common consequences of hazardous drinking.
Conclusions
Half the group with previous morbidity reported non-hazardous alcohol use. Still, non-hazardous use was found to be more prevalent among persons with previous morbid-ity, particularly in the youngest age group. In the years fol-lowing alcohol-related hospitalization, people seem to drift towards sobriety. Although the changes in hazardous use are inconclusive, the pooled results indicate a decrease in hazardous use over the time following an episode of alcohol-related hospitalization. This result implies that ex-tended follow-up may be needed adequately to capture changes in alcohol use after treatment. Targeted interven-tions, such as individual health care surveillance, focusing, for example, on abstention over a longer period of time among younger persons who have received alcohol-related hospital care, may prove beneficial.
Competing interest
The authors declare that they have no competing interests. Authors’ contributions
KA conceived the study, performed the statistical analysis, and wrote the draft of the manuscript. RK and IK revised it critically for important intellectual content, and all the authors read and approved the final manuscript.
Acknowledgements
The study was made possible by the Swedish National Institute of Public Health and Stockholm County Council.
Author details
1
Department of Public Health Sciences, Karolinska Institutet,
Tomtebodavägen 18A, 171 77 Stockholm, Sweden.2Centre for Epidemiology
and Community Medicine, Health Care Services, Stockholm County Council, Box 1497, 171 29 Solna, Sweden.3Department of Psychology, California State
University, Los Angeles, California.4Aging Research Centre (ARC), Karolinska Institutet and Stockholm University, Gävlegatan 16, 113 30 Stockholm, Sweden.5Institute of Gerontology, School of Health Sciences, Jönköping University, Jönköping, Sweden.
Received: 10 June 2013 Accepted: 18 August 2014 Published: 24 August 2014
References
1. Lim SS, Vos T, Flaxman AD, Danaei G, Shibuya K, Adair-Rohani H, Amann M, Anderson HR, Andrews KG, Aryee M, Atkinson C, Bacchus LJ, Bahalim AN, Balakrishnan K, Balmes J, Barker-Collo S, Baxter A, Bell ML, Blore JD, Blyth F, Bonner C, Borges G, Bourne R, Boussinesq M, Brauer M, Brooks P, Bruce NG, Brunekreef B, Bryan-Hancock C, Bucello C, et al.: A comparative risk assessment of burden of disease and injury attributable to 67 risk factors and risk factor clusters in 21 regions, 1990–2010: a systematic analysis for the Global Burden of Disease Study 2010. Lancet 2012, 380(9859):2224–2260. 2. Rehm J, Mathers C, Popova S, Thavorncharoensap M, Teerawattananon Y,
Patra J: Global burden of disease and injury and economic cost attributable to alcohol use and alcohol-use disorders. Lancet 2009, 373(9682):2223–2233.
3. Alkolholprofilen. [http://www.alkoholprofilen.se/#14]
4. Damstrom-Thakker K, Ahacic K, Cannertoft C, Larsson N, Ramstedt M, Snidare K: Alkohol och andra droger– utveckling och åtgärder. Stockholm: Karolinska Institutet/Karolinska Institutets folkhälsoakademi; 2012.
5. Ahacic K, Damström-Thakker K: Alkohol- och narkotikarelaterad vårdkonsumtion och dödlighet i Stockholms län: Rapport 2008. Stockholm: Centrum för folkhälsa; 2008.
6. Ahacic K, Damstrom-Thakker K, Kareholt I: Recurring alcohol-related care between 1998 and 2007 among people treated for an alcohol-related disorder in 1997: A register study in Stockholm County. BMC Public Health 2011, 11:574.
7. Babor TJ, Higgins-Biddle JC: Brief Interventions for Hazardous and Harmful Drinking: a Manual for Use in Primary Care. Geneva: World Health Organization, Department of Mental Health and Substance Dependence; 2001.
8. Babor TJ, Higgins-Biddle JC, Saunders JB, Monteiro MG: AUDIT. The alcohol Use Disorders Test. Guidelines for Use in Primary Care. Geneva: World Health Organization. Department of Mental Health and Substance Dependence; 2001. 9. Klingemann H, Sobell MB, Sobell LC: Continuities and changes in self-change
research. Addiction 2010, 105(9):1510–1518.
10. Sobell LC, Dum M, Garcia-Rodriguez O: Natural recovery from alcohol and drug problems: a methodological review of the literature from 1999 to 2005. In Promoting self-change from addictive behaviors: practical implications for policy, prevention, and treatment. Edited by Klingemann H, Sobell LC. New York: Springer; 2007:87–101.
11. Sobell LC, Ellingstad TP, Sobell MB: Natural recovery from alcohol and drug problems: methodological review of the research with suggestions for future directions. Addiction 2000, 95(5):749–764.
12. Smart RG: Spontaneous recovery in alcoholics: a review and analysis of the available research. Drug Alcohol Depend 1976, 1(4):277–285. 13. Blomqvist J, Cunningham J, Wallander I, Collin L: Att förbättra sina
dryckesvanor - om olika mönster för förändring och vad vården betyder [Improving one’s drinking habits - on different patterns of change and on the role of alcohol treatment]. In FoU-rapport. Volume 2007:6. Stockholm: SoRAD; 2007.
14. Romelsjo A, Palmstierna T, Hansagi H, Leifman A: Length of outpatient addiction treatment and risk of rehospitalization. J Subst Abuse Treat 2005, 28(3):291–296.
15. National Board of Health and Welfare: Sjukdomar i sluten vård 1987–2005. In-patient diseases in Sweden 1987–2005. In Sveriges officiella statistik. Stockholm: National Board of Health and Welfare; 2007:68 s.
16. Leifman H, Romelsjo A: The effect of changes in alcohol consumption on mortality and admissions with alcohol-related diagnoses in Stockholm County. A time series analysis. Addiction 1997, 92(11):1523–1536. 17. Romelsjo A: Decline in alcohol-related problems in Sweden greatest
among young people. Br J Addict 1987, 82(10):1111–1124.
18. Romelsjo A, Leifman H, Nystrom S: A comparative study of two methods for the measurement of alcohol consumption in the general population. Int J Epidemiol 1995, 24(5):929–936.
19. Stockholms Läns landsting. Centrum för folkhälsa: Folkhälsorapport 2007 [Public health report 2007]. Stockholm: Stockholms Läns landsting. Centrum för folkhälsa; 2007.
20. Dawson DA, Grant BF, Stinson FS, Zhou Y: Effectiveness of the derived Alcohol Use Disorders Identification Test (AUDIT-C) in screening for alcohol use disorders and risk drinking in the US general population. Alcohol Clin Exp Res 2005, 29(5):844–854.
21. Meneses-Gaya C, Zuardi AW, Loureiro SR, Hallak JE, Trzesniak C, de Azevedo Marques JM, Machado-de-Sousa JP, Chagas MH, Souza RM, Crippa JA: Is the full version of the AUDIT really necessary? Study of the validity and internal construct of its abbreviated versions. Alcohol Clin Exp Res 2010, 34(8):1417–1424. 22. Bergman H, Källmén H: Alcohol use among Swedes and a psychometric
evaluation of the alcohol use disorders identification test. Alcohol Alcoholism 2002, 37(3):245–251.
23. National Board of Health and Welfare: Klassifikation av sjukdomar och hälsoproblem 1997. Systematisk förteckning [Classification of Diseases and Health Problems 1997. A Systematic List]. 1st edition. Stockholm: National Board of Health and Welfare: Fritze; 1996.
24. SAS Institute Inc.: SAS 9.2. Cary, NC, USA: SAS Institute Inc.; 2002–2009; . 25. Heather N, Robertson I: Controlled drinking. 2 rev. edition. London: Methuen; 1983. 26. Storbjörk J, Room R: The two worlds of alcohol problems: Who is in
treatment and who is not? Addict Res Theory 2008, 16(1):67–84. 27. Romelsjo A: Treatment of alcohol and drug abuse in drug treatment
centers. How is the outcome for patients? Lakartidningen 2007, 104(13):1050–1055.
28. Fillmore KM, Midanik L: Chronicity of drinking problems among men: a longitudinal study. J Stud Alcohol 1984, 45(3):228–236.
29. Finney JW, Moos RH: The long-term course of treated alcoholism: I. Mortality, relapse and remission rates and comparisons with community controls. J Stud Alcohol 1991, 52(1):44–54.
30. Bischof G, Freyer-Adam J, Meyer C, John U, Rumpf HJ: Changes in drinking behavior among control group participants in early intervention studies targeting unhealthy alcohol use recruited in general hospitals and general practices. Drug Alcohol Depend 2012, 125(1–2):81–88.
31. Timko C, Moos RH, Finney JW, Lesar MD: Long-term outcomes of alcohol use disorders: comparing untreated individuals with those in alcoholics anonymous and formal treatment. J Stud Alcohol 2000, 61(4):529–540. 32. de Bruijn C, van den Brink W, de Graaf R, Vollebergh WA: The three year
course of alcohol use disorders in the general population: DSM-IV, ICD-10 and the Craving Withdrawal Model. Addiction 2006, 101(3):385–392. 33. Dawson DA, Grant BF, Stinson FS, Chou PS, Huang B, Ruan WJ: Recovery
from DSM-IV alcohol dependence: United States, 2001–2002. Addiction 2005, 100(3):281–292.
34. Witbrodt J, Romelsjo A: Treatment seeking and subsequent 1-year drinking outcomes among treatment clients in Sweden and the U.S.A.: a cross-cultural comparison. Addict Behav 2012, 37(10):1122–1131. 35. Prendergast ML, Podus D, Chang E, Urada D: The effectiveness of drug
abuse treatment: a meta-analysis of comparison group studies. Drug Alcohol Depend 2002, 67(1):53–72.
36. Moos RH, Finney JW, Ouimette PC, Suchinsky RT: A comparative evaluation of substance abuse treatment: I. Treatment orientation, amount of care, and 1-year outcomes. Alcohol Clin Exp Res 1999, 23(3):529–536. 37. Edwards G: Paradigm shift or change in ownership? The conceptual
significance of D.L. Davies’s classic paper. Drug Alcohol Depend 1985, 15(1–2):19–34.
38. Vaillant GE: The natural history of alcoholism revisited. Cambridge: Harvard University Press; 1995.
39. Categories, careers, and outcomes of alcoholism. Lancet 1986, 1(8483):719–720. 40. Editorial: Absolutism and alcoholism. Lancet 1975, 1(7899):152–153. 41. Miller WR, Walters ST, Bennett ME: How effective is alcoholism treatment
in the United States? J Stud Alcohol 2001, 62(2):211–220.
42. Dawson DA, Goldstein RB, Ruan WJ, Grant BF: Correlates of recovery from alcohol dependence: a prospective study over a 3-year follow-up interval. Alcohol Clin Exp Res 2012, 36(7):1268–1277.
43. Maisto SA, McKay JR, O’Farrell TJ: Twelve-month abstinence from alcohol and long-term drinking and marital outcomes in men with severe alcohol problems. J Stud Alcohol 1998, 59(5):591–598.
44. McKay JR, Weiss RV: A review of temporal effects and outcome predictors in substance abuse treatment studies with long-term follow-ups. Preliminary results and methodological issues. Eval Rev 2001, 25(2):113–161.
45. Skog OJ, Duckert F: The development of alcoholics’ and heavy drinkers’ consumption: a longitudinal study. J Stud Alcohol 1993, 54(2):178–188. 46. Mann K, Schafer DR, Langle G, Ackermann K, Croissant B: The long-term course of
alcoholism, 5, 10 and 16 years after treatment. Addiction 2005, 100(6):797–805. 47. Schutte KK, Byrne FE, Brennan PL, Moos RH: Successful remission of
late-life drinking problems: a 10-year follow-up. J Stud Alcohol 2001, 62(3):322–334.
48. Edens EL, Glowinski AL, Grazier KL, Bucholz KK: The 14-year course of alcoholism in a community sample: do men and women differ? Drug Alcohol Depend 2008, 93(1–2):1–11.
49. Gual A, Bravo F, Lligona A, Colom J: Treatment for alcohol dependence in Catalonia: health outcomes and stability of drinking patterns over 20 years in 850 patients. Alcohol Alcohol 2009, 44(4):409–415.
50. Weisner C, Ray GT, Mertens JR, Satre DD, Moore C: Short-term alcohol and drug treatment outcomes predict long-term outcome. Drug Alcohol Depend 2003, 71(3):281–294.
51. Kallmen H, Sinadinovic K, Berman AH, Wennberg P: Risky drinking of alcohol in Sweden: A randomized population survey comparing web- and paper-based self-reports. Nord Stud Alcohol Dr 2011, 28(2):123–130. 52. Link MW, Mokdad AH: Effects of survey mode on self-reports of adult
alcohol consumption: a comparison of mail, web and telephone approaches. J Stud Alcohol 2005, 66(2):239–245.
53. Ahacic K, Allebeck P, Thakker KD: Being questioned and receiving advice about alcohol and smoking in health care: Associations with patients’
characteristics, health behavior, and reported stage of change. Subst Abuse Treat Prev Policy 2010, 5:30.
54. Ahacic K, Kareholt I, Helgason AR, Allebeck P: Non-response bias and hazardous alcohol use in relation to previous alcohol-related hospitalization: comparing survey responses with population data. Subst Abuse Treat Prev Policy 2013, 8:10.
doi:10.1186/1471-2458-14-874
Cite this article as: Ahacic et al.: Alcohol abstinence, non-hazardous use and hazardous use a decade after alcohol-related
hospitalization: registry data linked to population-based repre-sentative postal surveys. BMC Public Health 2014 14:874.
Submit your next manuscript to BioMed Central and take full advantage of:
• Convenient online submission
• Thorough peer review
• No space constraints or color figure charges
• Immediate publication on acceptance
• Inclusion in PubMed, CAS, Scopus and Google Scholar
• Research which is freely available for redistribution
Submit your manuscript at www.biomedcentral.com/submit