The Environmental Impact of an
Automotive Plastic Component
A lifecycle approach of a deco panel scenario analysis of two different
plas-tics
Miljöpåverkan av en plastkomponent i ett fordon
En jämförelse av två plaster i en dekorpanel ur ett livscykelperspektiv
Paula Ackerstierna
Faculty: Health, Science and Technology: Environmental and Energy Systems Subject/Degree course/Educational program: Master of Science in Energy and Environmental Engineering Points/Credits: 30 ECTS Supervisors: Venkatesh Govindarajan, Jonas Berghel Examiner: Roger Renström Date: June 2019© 2019 – Paula Ackerstierna – (f. 1994) The Environmental Impact of an Automotive Plastic Component [Miljöpåverkan av en plastkomponent i ett fordon] Master thesis for Master of Science in Energy and Environmental Engineering at Karlstad University http://kau.se The author, Paula Ackerstierna, has made an online version of this work available. http://diva-portal.org
I
Abstract
The transport sector is a major end-user of energy. As consumers are becoming aware and conscious of their environmental footprint making the enviromental footprint of automobile components one of the requirements in new product design development.
The purpose of the study is to identify environmental impacts of a plastic panel. The main objective of the study is to perform an environmental life cycle as-sessment (E-LCA) of an existing panel regarding four scenarios with a nonbio-based plastic and a bio-nonbio-based plastic. The first two scenarios have the same production and use phase, but different end-of-life treatments. The plastic in these scenarios is non-biobased. The last two scenarios have the same bio-based plastic and use phase, but different end-of-life-treatments. The first three scenarios have a surface material covering the plastic. The environmental im-pacts analyzed are global warming potential, acidification potential, eutrophi-cation potential, photochemical ozone creation potential, primary energy de-mand and particulate matter.
The analysis is carried out according to the ISO14040/44 with the four steps of LCA: 1) Goal and Scope Definition, 2) Inventory Analysis, 3) Impact Assessment, and 4) Interpretation. The functional unit of the anaysis is a plastic panel. The inventory was collected by literature, the LCA software GaBi, and the commissoner of the study. The environmental impact assessment was conducted in GaBi 8 with the method of CML2015, Primary Energy, and IMPACT2002+. A dominance and a contribution analyses were applied to identify the hotspots of the life cycle. The hotspot of the life cycle was identified to be the production phase.
The main contributor within the scenarios was the plastic production, specifi-cally the granulates and the fiber fillings. The bio-based plastic reduced the impacts compared to the non-bio-based in five out of six cases. However, the photochemical ozone creation potential for both plastics were the same. The bio-based plastic reduced the GWP 16%, AP by 1%, EP by less than 1%, and PED by 19%. If the surface cover in aluminum was removed, the GWP was reduced by 46%, AP by 35%, EP by29%, POCP by 36%, PED by 42%and PM by 40%. The transportation contributed most to impacts in the acidification potential, eutrophication potential, and particulate matter. The transportation’s impacts were greater in the bio-based plastic than the non-bio-based.
The granulates of the plastic along with the injection molding are the main contributors due to usage of coal-based electricity for the injection molding and oil for the plastic production. The values used in the study are based on
II
country averages which may differ depending on geographic location and its development as China is a country with a large area. The GWP is the highest value of the impacts analyzed, but even though the other are small fractions these may cause great damages. These damages can irritate eyes, damage lungs and destroy photosynthesis.
By using recycled material for products instead of new materials, as done in the study, the impacts could be lower. As some previous studies agrees, the usage of bio-plastics lowers the environmental impact by a few percentages. The bioplastic is an environmentally sustainable option to the current plastic as the location of the panel is not sensitive to excessive heat.
III
Sammanfattning
Transportsektor står för en stor del av världens energianvändning. Konsumentmedvetenheten kring klimatpåverkan ökar som således sätter prägel på bilindustrins klimatpåverkan och dess produktutveckling.
Syftet med studien är att identifiera en plastpanels klimatpåverkan i en bil. Målet är således att utföra en livscykelanalys på en plastpanel och jämföra mellan en biobaserad och en icke-biobaserad plast i fyra olika scenarion. Det första scenariorna är av en icke-biobaserad plast och har samma produktion- och användningsfas men olika typer av end-of-life. Det sista scenariorna är av en biobaserad plast och har samma användningsfas och olika end-of-life. Det tre första har även ett metallytskick. Miljöpåverkan beräknas i global
uppvärmningspotential, försurningspotential, övergödningspotential,
marknära ozon potential, energianvändning och partikelutsläpp.
Analysen gjordes enligt ISO14040/44 där fyra steg tillämpades: 1) mål och omfattning, 2) inventeringsanalys, 3) miljöpåverkan, 4) resultattolkning. Den functionella enheten är en plastpanel. Indata samlades med hjälp av litteratur, LCA databaser i GaBi och beställaren av studien. Miljöpåverkan beräknades med hjälp av metoderna CML2015, Primary Energy och IMPACT2002+ integrerade i LCA verktyget GaBi. Miljöpåverkan kategorierna analyserades och jämfördes för att identifiera var mest påverkan i livscykeln var.
Plastproduktionen i panelen bidrog med mest klimatpåverkan, däribland plast granulatet, formsprutningen och fiberfyllningen. Den biobaserade panelen minskar GWP med 16 %, försurnings potential och övergödnings potential med mindre än 1 % och energianvändningen med 19 %. Om aluminium ytmaterialet tags bort reduceras GWP med 46 %, försurning-, övergödning- och marknära ozon potentialerna med 29-36%, energianvändningen med 42 % och partiklar med 40 %. Transporten i produktionsfasen bidrog mest till försurningspotentialen, övergödningspotentialen och partikelutsläppet. Påverkan av transporten var större i bioplastens fall än icke-bioplast.
Plastproduktionen påverkar mest då mycket olja används vid produktionen av plast och formsprutningen är endast baserad på elektricitet som är kolbaserad i denna studie. All data är baserad på landmedelvärden som kan vara missvissande då Kina är ett stort land med stor area. Det betyder att olika städer har olika förutsättningar med olika utvecklade teknologier.
GWP gav det högsta värdet av alla miljöfaktorer som analyserades. Däremot kan små mängder visa stor påverkan som kan irritera ögon, skada lungor och förstöra förutsättningar för fotosyntesen.
IV
Genom att använda återvunnet material istället för nytt material eller biobaserad plast minskar klimatpåverkan. Tidigare studier påvisade att utbytet av plast till bioplast gav ett positivt utslag och således lägre miljöpåverkan. Bioplasten är en miljöhållbar plast för en plastpanel som inte utsätts för överdrivet mycket värme.
V
Preface
This thesis work has been presented orally for an audience involved and inter-ested in the subject. Furthermore, the thesis has been discussed at an exclusive seminar. The author has actively participated as an opponent for another thesis project examined at the institution.
VII
Acknowledgement
I would like to express my gratitude towards all persons engaged and involved in this thesis work. This thesis was performed at the Cockpit Department of CEVT AB in Gothenburg, Sweden. I would, especially, like to give thanks to the employees at CEVT for their courtesy.
I give special thanks to the Cockpit Manager Pär Eriksson for giving me the opportunity to carry out this thesis at CEVT. Specifically, I would like to thank my mentors Veronica Berviand and Alexandra Grönberg for their support throughout the work and helping me with connections and contacts.
I want to express my gratitude towards Alexander Fischer and Viviana Carrillo at thinkstep and Maximilian Schüler at Volkswagen Group for their GaBi ex-pertise and for answering all my questions. I would also like to thank Stena Recycling for letting me brainstorm with them about the future of recycling. Finally, I would also like to express my appreciation to Venkatesh Govindarjan and Jonas Berghel, my supervisors at the institution, and Ali Mohammadi for continuous support and advice to finalize the thesis.
IX
Table of Contents
1 INTRODUCTION ... 1
1.1 GLOBAL VEHICLE INDUSTRY ... 2
1.2 AUTOMOTIVE COMPONENTS, DIVERSE SUPPLY CHAIN AND ITS ENVIRONMENTAL AWARENESS ... 3
1.3 LIFE CYCLE ASSESSMENT ... 5
1.3.1 Goal and Scope ... 6
1.3.2 Inventory Analysis ... 6
1.3.3 Environmental Impact Assessment ... 7
1.3.4 Interpretation of Results ... 9
1.4 PREVIOUS STUDIES OF AUTOMOTIVE LCA ... 10
1.5 PURPOSE AND OBJECTIVES OF STUDY ... 13
2 METHODOLOGY ... 14
2.1 CASE STUDY ... 14
2.2 DESCRIPTION OF SYSTEM FOR ASSESSMENT ... 15
2.2.1 Goal and Scope ... 15
2.2.2 Inventory Analysis ... 19
2.2.4 Environmental Impact assessment ... 20
2.2.5 Interpretation of Results ... 21
2.2.6 Modelling in GaBi ... 22
3 RESULTS ... 24
3.1 GLOBAL WARMING POTENTIAL ... 25
3.2 ACIDIFICATION POTENTIAL ... 26
3.3 EUTROPHICATION POTENTIAL ... 27
3.4 THE PHOTOCHEMICAL OZONE CREATION POTENTIAL ... 28
3.5 THE PRIMARY ENERGY DEMAND ... 29
3.6 PARTICULATE MATTER ... 30 3.7 SENSITIVITY ANALYSIS ... 32 4 DISCUSSION ... 34 5 FUTURE STUDIES ... 41 6 CONCLUSION ... 42 REFERENCES ... 43
X
APPENDIX A: SUMMARIZATION OF PREVIOUS STUDIES ... 49
APPENDIX B: INVENTORY DETAILS ... 52
XI
Table of Tables
Table 1 The impact categories for the methodology ReCiPe for impact
assessment ... 8
Table 2 Mandatory and optional portions of impact assessment ... 9
Table 3 Ways of interpretation applied in a LCA ... 9
Table 4 Case study scenarios ... 15
Table 5 Functional unit according to scenarios ... 16
Table 6 System boundaries of material extraction sites ... 17
Table 7 Material properties of the two plastics used in case study ... 17
Table 8 Sources of data of inventory ... 19
Table 9 Material used for parts of functional unit ... 20
Table 10 Total distance travelled by transportation type in the life cycle ... 20
Table 11 Definition of impact categories for assessment ... 21
Table 12 The environmental impacts for the deco panel according to scenario ... 24
Table 13 Sensitivity analysis of aluminum weight ... 32
Table 14 Sensitivity analysis with respect to distance travelled in use phase 33 Table 15 Study reference with region, lifetime and component analyzed ... 49
XIII
Table of Figures
Figure 1 Sustainable development model ... 1
Figure 2 Total delivered energy used worldwide in 2012 ... 2
Figure 3 The life cycle perspective thinking ... 6
Figure 4 A product’s life cycle with three main phases ... 7
Figure 5 Functional unit ... 16
Figure 6 Functional unit inserted on right-handside of the fictional instrumental panel ... 16
Figure 7 GaBi model of life cycle in Scenario 1 through 4 ... 22
Figure 8 Recycling of plastics ... 23
Figure 9 Emission contribution analysis of the life cycle of the deco panel . 25 Figure 10 Contribution analysis of energy resources in life cycle ... 25
Figure 11 Dominance analysis of Global Warming Potential of the study ... 26
Figure 12 Dominance analysis of Acidification Potential of the study ... 27
Figure 13 Dominance analysis of Eutrophication Potential of the study ... 28
Figure 14 Dominance analysis of Photochemical Ozone Creation Potential of the study ... 29
Figure 15 Dominance analysis of Primary Energy Demand of the study ... 30
Figure 16 Dominance analysis of Particulate Matter of the study ... 31
XIV
XV
Abbreviations
Symbol Definition
AP Acidification Potential
AP23 70% Polypropylene and 30% Hemp Fibers
CH4 Methane
CO2 Carbon Dioxide
EIA U.S Energy Information Administration
(E-)LCA (Environmental-) Life Cycle Assessment/Analysis
EOL End-of-life
EP Eutrophication Potential
EQ Equivalents
GHG Greenhouse Gases
GWP Global Warming Potential
IEA International Energy Agency
ISO International Standards Organization
NMVOC Non-Methane VOC
PA 6 Polyamide 6 (Nylon)
PED Primary Energy Demand
PM Particulate Matter
POCP Photochemical Ozone Creation Potential
PP Polypropylene
1
1 INTRODUCTION
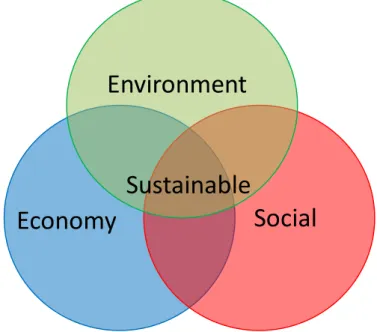
In 1992, 172 countries initiated the process towards a sustainable development throughout the planet (Helmers et al., 2017). To achieve a sustainable development there are three key terms that need to be considered: economy, social and environment. Figure (1) represents the holistic perspective of sustainable development.
Figure 1 Sustainable development model
Within the environmental category, energy is the major contributor accounting for two-thirds of the total greenhouse gases (GHG); and there in, carbon dioxide accounts for 80% (Tharumarajah & Koltun, 2010). These have brought about global warming and associated climate change impacts (Vinodh et al., 2012; Mayyas, 2017). The final energy output may be in the form of heat, electricity or work, depending on the sources of energy (fossil fuels or rewnewable resources); the environmental footprint is not the same (Moro & Helmers, 2017).
In December 2015, the UN held an international summit in Paris to draft a new agreement on how to face the challeneges associated with climate change. (Moro & Helmers, 2017; Calise et al., 2018; International Energy Agency,
2019) About recently, on the 8th of June 2018, a new agreement was established
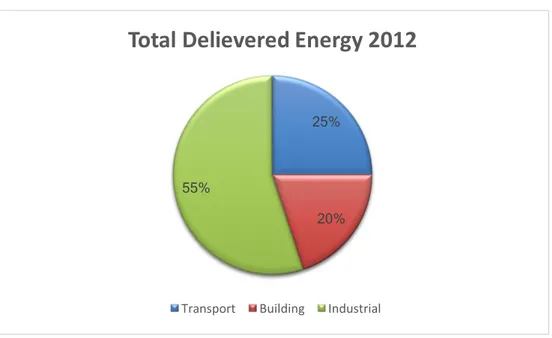
within the EU and its energy policy (International Energy Agency, 2019). Energy in all of its forms can be used for several purposes. Energy use is often referred to when speaking about the end users especially in the building, industrial and transportation sectors (EIA 2016, IEA). According to World
Economy
Social
Environment
Sustainable
2
Energy Demand and Economic Outlook 2016 (EIA, 2016), the building sector accounts for 20%, the industrial accounts for 55% and the transportation sector accounts for 25% of the total delivered energy used worldwide in 2012, see Figure (2).
Figure 2 Total delivered energy used worldwide in 2012
The vehicle industry falls into two of these sectors, the industrial and the transportational sector both of which are projected to increase. The transportation sector is made up of passenger transporations as well as freight means.
1.1 Global Vehicle Industry
Cars, trucks, airplanes and trains are all types of transportation. The automotive industry has not been accorded enough importance, as observed by Herold and Lee (2017). This makes it a sector which has tremendeous potential for improvement in the years to come. It’s also critical as the sector is a major end-user of energy, as many authors ave noted (Sun et al., 2017; Ding et al., 2016; Safdar, 2017).
The automotive industry is an inseparable component of the modern economy, and it has supplied end-users with billions of vehicles, as stated in Hao et al. (2016) and Hao et al. (2017). In 2015, the vehicule production reached 90.8 billions and sales are projected to continue increasing (Qiao et al., 2017; Ding et al., 2016).
China is both the largest manufacturer and consumer of automobile, in the world, as reported in recent publications by Sun et al. (2016) and Qiao et al.
25%
20% 55%
Total Delievered Energy 2012
3
(2017). However, many cars are dissembled illegally according to Li et al. (2016).
The European Commission has stated that 20% of energy consumption and 10% of road vehicles are required to use renewable resources by 2020. Hopefully, due to this and how competitive the vehicle industry is, the vehicle industry will be more energy-efficient with alternative fuels and more efficient engines. (Safdar, 2017; Velazquez et al., 2017)
Sweden is the home of many automotive companies, such as VOLVO AB and Scania, but it’s also assosicated with Volvo Cars and Saab Automobile (GlobalCarBrands, 2015). According to the Swedish Energy Agency (2016), the transport sector has accounted for 25% of Sweden’s energy consumption for the several last years.
Economies in the developing world continue to grow. Therefore, it is necessary to be aware of the impacts caused by a rise in the number of vehicles on energy use and environmental burden (Hao et al., 2016; Ding et al., 2016).
1.2 Automotive Components, Diverse Supply Chain and
its Environmental Awareness
Approximately 28% of the energy the transportation sector consumes,
accounts for 23% of the global CO2 emissions (Ding et al., 2016; Delogu et al.,
2017; The World Bank, 2018), half of which is due to the global and fossil oil consumption (Hao et al., 2016). Energy use in almost all the processes in automotive manufacturing contributes to GHG emissions with global warming potential (GWP) (Xia et al., 2016).
It is also worth noting that China accounted for 28% of the global CO2
emissions in 2013 making it the main contributer in the world according to Han et al. (2017) and Hao et al. (2017).
Consumers are becoming aware and conscious of their carbon footprint and their contribution to other types of environmental impacts. Awareness of the significant enviromental impact of automotive components (not only global warming, but also a host of other environmental impacts) is one of the requirements in new product design development according to Matura et al. (2017), Vinodh et al. (2012) and Gallimore & Cheung (2016). The automotive companies must, therefore, be creative enough and make efforts to reduce their enviornmental footprints, to be competitive in the global market as explained by Gallimore & Cheung (2016).
4
Emissions due to automobiles are deterimental to human health in cities, as pointed out by Helmers et al. (2017) and Jasiński et al. (2016), amongst others, resulting in about 185000 deaths annually attibuted to air pollution. The atmosphere is affected by millions of tons of GHG every year due to the production of vehicles. (Hao et al., 2017; Hao et al., 2016; Miotti et al., 2017) The GHG are highlighted as the major cause of smog, human health problems and congestion in cities amongst. (Helmers et al., 2017) By 2020, the average
CO2 emissions from a passeneger car must be reduced by 27%, to about 257 g
CO2/km, from the value of 352 g CO2/km in 2015 (which is about 95 g
CO2/km). (Kozderka et al., 2017; Gallimore & Cheung, 2016).
The upstream manufacturing of an automobile can be trifurcated into three categories; original component production, consumable component production and the immediate upstream of the end-use phase. The latter are the asssembly operations, where the original and consumable components are assembled together. Original component production refers to components fabricated from steel, aluminum, plastics, and other metals, while consumable component production includes replaceables like tires, lubricated oils and grease, and batteries. (Hao et al., 2017)
Less weight of components can lead to increased usage of plastics (Kozderka et al., 2017) and the recycling rate of plastics are generally very low. According to Avfall Sverige (2019) 49 million ton plastics were used in the EU in 2015 .
Light automotive componenets can be made of all kinds of plastics; polypropylene, polyethylene, acrylonitrile-butadienestyrene, and polyvinyl chloride (Nakano & Shibahara, 2017). Plastics like polyethylene, polyethylene teraphthalate(PET) and high-density polyethylene are more easily recycled than other plastics; which are harder to separate and thus to recycle claims
recycling expert Taina Flink (telephone conversation, 17th of April 2019). The
production of plastics is associated with release of GHGs upstream in the petroleum sector (Xia et al., 2016).
The material used in a car is also depended of physical propeties, such as strength, stiffness and resistance according to engineers Veronica Berviand
and Alexandra Grönberg (conversation, 12th April 2019).
Researchers and engineers have been working with the possibility of replacing metallic components with renewables, instead of plastics. Biocomposites in fashion for the manufacture of automobile components include materials like cotton, hemp, flax, sisal, jute and kenaf or recycled wood and paper (Akampumuza et al., 2017).
5
Throughout a component’s production phase, it goes through many processes. These processes can be different types of heat treatments, cuttings, gluing, amongst many to accomplish and retain desired properties. Injection molding, die-casting, and welding are common for producing the interior of cars that strive towards a specific form of components. These parts have to be carefully designed, and the properties of the molding machine, the material and shape of the component must be considered. The injection molding process is very complex and partly available within datasets due to individuality of each part (Hesser, et al., 2017).
The end-of-life (EoL) of a vehicle has limitations in the different directives and waste management regulations around the World. Currently, the most common waste treatments are incineration or landfill (Poulikidou et al., 2016). According to EU regulations, 95% of a car needs to be recyclable (10% of energy recovered and 75% material recycled), says recycling expert Taina
Flink (telephone conversation, 17th of April 2019). The average lifespan of a
car in China is eight to nine years which has a direct relationship with the esti-mation of the number of vehicles needed to be recycled. Despite the large num-ber of cars in China, few cars are recycled. (Li et al., 2016)
As the three main phases, production, use and EoL account for the impacts, the environmental impact must be calculated from a life cycle perspective with the help of a life cycle software. (Moro & Helmers, 2017; Qiao et al., 2017; Cecchel et al., 2016; Delogu et al., 2016a) These studies are referred to as LCA, meaning life cycle analysis. Air, soil and water emissions amongst others are considered in a LCA by their mass proportion and energy requirements (Vinodh et al., 2012).
1.3 Life Cycle Assessment
Every product has a life-cycle. An environmental life cycle assessment (E-LCA or sometimes referred to as (E-LCA) is a tool to estimate the environmental impacts of a product throughout its life cycle. E-LCA enables manufacturers to improve the environmental footprints of their products, and thereby their sustainability profile (Sun et al., 2017). A complete life-cycle includes raw material extraction, manufacturing, usage and EoL of a product and also the inter-stages of transportations (Moro & Helmers, 2017; Delogu et al., 2016a; Jasiński et al., 2016; Tharumarajah & Koltun, 2010).
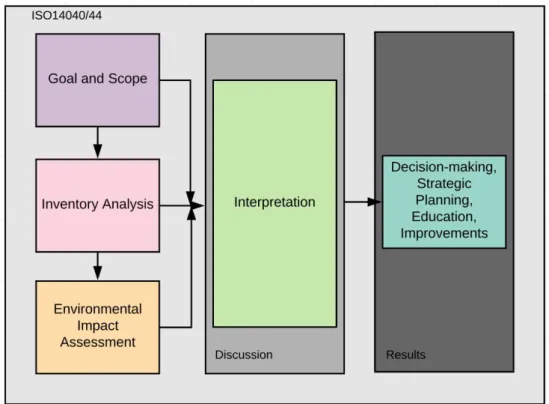
According to the ISO 14040/14044, a LCA is a four-step process: 1) Goal and Scope Definition, 2) Inventory Analysis, 3) Impact Assessment, and 4) Interpretation. (Cecchel et al., 2016; Poulikidou et al., 2016; Miotti et al., 2017;
6
Sun et al., 2016; Sun et al., 2017; Ding et al., 2016; Fuc at al., 2016; Boland et al., 2016; Delogu et al., 2016ab; Delogu et al., 2017; Keoleian, 1998). Figure (3) describes how the different steps are integrated inspired by Govindarajan (2016).
Figure 3 The life cycle perspective thinking
1.3.1 Goal and Scope
Step one includes the goal and scope of the LCA, which are significant as the goal of the study is determined in this section. The goal and scope define the requirements for the modelling and thus specifications of the study. According to the ISO standard 14041, the goal is to “unambiguously state the intended application, the reason for carrying out the study and the intended audience” as stated in Baumann & Tillman (2004). The scope includes what the functional unit is, and the choice of impact factors along with methodology for impact assessment and the system boundaries.
1.3.2 Inventory Analysis
Step two includes the inventory analysis, in other words, total data collection and is similar to a material flow analysis, where the inputs and outputs are significant for the system. The inventory analysis consists of all the materials used to produce the functional unit studied and follows the functional unit to
7
the grave. The inventory includes the flows in the life cycle steps of the prod-uct. It also includes transportation and processes.
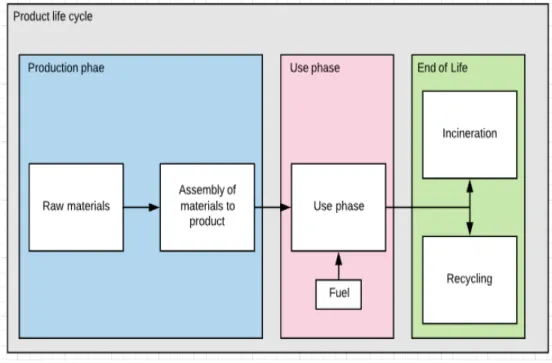
Figure (4) shows a schematic the life cycle thinking illustration of a use phase containing fuel consumption. The first box is the production phase including extraction of raw material and and assembly of materials to product. The pink box is the use phase. The final box is the EoL which in this case is incineration or recycling.
Figure 4 A product’s life cycle with three main phases
1.3.3 Environmental Impact Assessment
Step three is the environmental impact assessment, influenced by the method chosen in the goal and scope definition. The method indicates if the environ-mental impacts are midpoint and/or endpoint indicators/damage indicators. These describe the inventory’s environmental impact into categories. The impacts can be ‘midpoint’ with damage pathways leading to endpoint indicators, but what impacts are implicated depends on chosen method for impact assessment and definition of goal and scope.
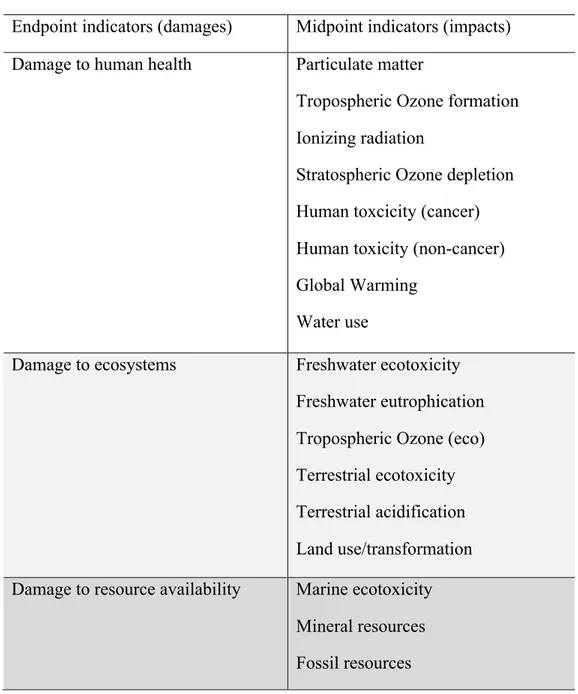
Table (1) defines the different midpoint indictors associated with the three endpoint indicators: damage to human health, damage to ecosystems, and damage to resource availability. This particular method is reffered to as the ReCiPe method and is useful when studying LCA in greater detail. (Go-vindarajan, 2016; RIVM, 2018)
8
Table 1 The impact categories for the methodology ReCiPe for impact assessment
Endpoint indicators (damages) Midpoint indicators (impacts)
Damage to human health Particulate matter
Tropospheric Ozone formation Ionizing radiation
Stratospheric Ozone depletion Human toxcicity (cancer) Human toxicity (non-cancer) Global Warming
Water use
Damage to ecosystems Freshwater ecotoxicity
Freshwater eutrophication Tropospheric Ozone (eco) Terrestrial ecotoxicity Terrestrial acidification Land use/transformation
Damage to resource availability Marine ecotoxicity
Mineral resources Fossil resources
In excess of the impacts stated and defined above, there are mandatory and optional elements in this section of the LCA. There are three mandatory ele-ments and four optional eleele-ments. The mandatory eleele-ments contain the impact category definition, classification, and characterization. The latter two are in-tegrated in LCA softwares. The optional elements contain the normalization, grouping, weighting, and data quality analysis.
The mandatory and the optional elements are defined and described in Table (2) per definitions by Baumann & Tillman (2004).
9
Table 2 Mandatory and optional portions of impact assessment
Mandatory Optional
Impact category definition is the
section in which defines what impact categories are to be analyzed; mid-point and/or endmid-point indicators.
Normalization is by using the
char-acterization and recalculating it ac-cording to a reference value. It an-swers the question ‘Is this product’s impact large in comparison to the country’s total impact?’
Classification is where the inputs
and outputs, e.g. the inventory, are categorized into corresponding
envi-ronmental impact.
Grouping is a way of sorting the
in-dicators according to factors, factors as geographic relevance and priori-ties.
Characterization where the impact
categories sizes are calculated ac-cording to the inventory’s environ-mental impact to one equivalent fac-tor.
Weighting converts the results of
in-dicators into a common unit. This means the impacts are converted into a factor to be comparative to each other.
Data quality analysis identifies the
reliability of impact assessment re-sult.
1.3.4 Interpretation of Results
Step four of a LCA is the interpretation part of the study. It’s where different parameters are adjusted and analyzed. This step is part of the discussion and used when comparing the results, all the analyses defined according to Bau-mann & Tillman (2004) in Table (3), these are optional.
Table 3 Ways of interpretation applied in a LCA Interpretation analyses
Dominance analysis identifies the critical polluting step throughout all
stages of the life cycle
Contribution analysis identifies what environmental loads/emissions
con-tribute to the environmental impact
Uncertainty analysis checks the effect of uncertain data Sensitivity analysis checks the effect of changes in the data
10
1.4 Previous Studies of Automotive LCA
According to Hao et al. (2017) and Gallimore & Cheung (2016) most of the earlier published E-LCA studies about automobiles focus on the use phase, as it is clearly the one which dominates the life-cycle’s GWP. Reports concerning automotive LCA usually use the driving distances of 100,000 – 200,000 km, according to Ecoinvent database, it’s 150,000 km (Del Duce et al., 2014) and rarely 240,000 km. (Nordelöf et al., 2014).
Moro & Helmers (2017) perform a hybrid well-to-wheel analysis focusing on the fuel being consumed for an electric vehicle. The case is to compare what kind of fuel the vehicle is using and therefore it’s necessary to investigate the GWP, fossil fuels and biofuels different impact factors. The result is compared to an internal combustion engine vehicle and result in a 44-56% savings of GWP. Delogu et al. (2017) performed a material LCA for electric vehicles. The materials were thermoplastic matrix components, fiber reinforced thermoset matric composites, advanced hybrid materials and bio-composites made from renewable energy. These are mainly investigated due to being of lightweight. The new materials, the raw materials specifically, in the production phase contribute the most to the impacts making them unsuitable in comparison to a combustion engine car. Qiao et al. (2017) perform a cradle-to-gate study of electric and internal combustion vehicles to compare the GWP and energy use. Results show that the production phase of the electric vehicle are 50% than the combustion engine vehicle.
Orsi et al. (2016) found when comparing emissions, cost of vehicle and energy use in different regions, compressed natural gas vehicles and electrical vehicles have the potential to reduce oil consumption and therefore emissions in the private transport sector. There are other ways to conduct comparative LCA studies, Hao et al. (2017) conducted a comparative study between China and the US regarding GWP from vehicle production for fuel cell vehicles and electric. It resulted in 54% higher emissions in China than US.This was if the energy was non-fossil for the electricity and the hydrogen production.
Light-weighting of components in vehicles have a direct influence on fuel consumption and emissions as noted in Qiao et al. (2017), Cecchel et al. (2016), Delogu et al. (2016ab), Poulikidou et al. (2016), Sun et al. (2017), Ding et al. (2016), Delogu et al. (2017), Koffler & Rohde-Brandenburger (2010) and Allwood (2018). Del Pero et al. (2017) also state that reducing the weight of materials is important to the vehicle’s performance. The authors conducted a LCA of the use phase of electrical vehicles to assess the environmental impacts of lowering the fuel’s life cycle and vehicle operation emissions by innovative
11
lightweight materials. Similarly, Sun et al. (2017) conducted a cradle-to-grave LCA of reduced weight materials where three deisgns are compared. The alumium design and the AHSS design are suitable for sustainability as they have lower energy use and GWP compared to the carbon fiber design. Cecchel et al. (2016) agrees that the reduction of mass can be achieved by exchanging steel with aluminum. The mass has a direct influence on emissions and performance The fuel consumption will be reduced but the energy for producing the aluminum alloy could essentially be larger making the environmental impact ‘the same’ as it only moves the impact to another process. The results show a negligble result for the first stages, but at the EoL phase 42% of the aluminum is recovered. Ding et al. (2016) considered the impact factors of energy use and GWP for a vehicle. The usage of gasoline decreased by 9% when six parts were replaced by aluminum.
Boland et al. (2016) presents and compares the environmental consequences regarding composite materials in a vehicle. The authors substituted glass fibers with natural cellulose and kenaf to understand bio-based composites in automotive components. When using cellulose instead of glass fiber it reduced the GWP by 19.6% and kenaf reduced the GWP by 10.7%. The energy usage was reduced by 9.2% and 6%, cellulose and kenaf respectively. Pulikidou et al (2016) analyze a truck exterior panel where the current design is a glass fiber reinforced thermoplastic and the new design is self-reinforced polyethylene therephthalate. The new design had a 25% lower environmental impact compared to the existing design.
The environmental performance of an instrument panel was analyzed in Tharumarajah & Koltun (2010). The instrumental panel is made of steel and plastics and is compared to usage of magnesium and the use of bio-plastics. Even though the magnesium panel is lighter, reducing the use phase burden, it has the highest impact of the materials due to manufacturing. The authors also concluded that the impact of a bio-based plastic panel would reduce 11.8% of CO2 eq instead of using a plastic panel. Keoleian (1998) also evaluated the
environmental influences and performance for instrumental panels. The analysis also included a life-cycle cost analysis and with social aspects making it a very comprehensive and complex LCA. The study shows that the use phase is the main contributor phase for energy consumption and air emissions. He claims that removing foam and painting of surfaces could reduce impacts. However, the author is incredulous to the improvement of a near-term positive forecast of innovation.
Gallimore & Cheung (2016) conducted a LCA case study of a manufacturer’s interior trim including the insulation of the engine.The authors found that
12
changing the metal to a high-density polyethylene, the carbon footprint would reduce by 30%, acidification by 24%, eutrophication by 26% and 15% in energy consumption. Mastura et al. (2017) studied the environmental impacts of climate change and human health by conducting a LCA made of the automotive anti-roll bar. The impacts are decided since the component is made of steel and steel has proven to have a great impact on GWP and fossil consumption.
As the EoL is vital, Nakano & Shibahara (2017) perform a comparative assessment of vehicles for two different recycling processes: the whole recycling method versus shredding. Vehicles are dismantled and recycled part by part. They will be shredded, and hazardous materials will be collected. In Japan, they maximize the profits by selling the valuable parts. By reycling 120
kg CO2 eq less were emitted than when using a shredder. Delogu et al (2016a)
include economic aspects as well as environmental in their dashboard LCA. The EoL for their study includes a shredding treatment followed by landfilling or incineration. They state that the use phase is mostly the direct impact on
several of the midpoint indicators. The authors Sun et al. (2016) conduct a LCA
of a passenger vehicle tire in China. The fuel consumption is the main contributor to the impacts investigated but when concerining the human toxicity potential the raw material is the main contributor. The GWP and eutrophication potential are negative in in the EoL due to recycling and producing rubber.
Fuc et al. (2016) considered there to be lack of internal transport in life cycle assessments and conducted a LCA of a forklift operation. The LCA is not a complete analysis but a well-to-wheel. The electric forklift has a significant lower impact than the internal combustion forklift. Forklifts with the liquefied petroleum gas has a higher impact than the use of diesel powered vehicles. The importance of electricity is covered by Helmers et al. (2017) comparing four electricity mixture combinations for two different EoL procedures. These electricities are all concerining the German mixture but with different sources. The lowest impact was the renewable electricity with about 30 % lower impact. Vinodh et al. (2012) performed a LCA of an instrument panel of an
electric car. The highest emission of CO2 eq is when the plastic is injection
molded and the power grid usage. Miotti et al. (2017) also highlights the assumption of electricity and fuel from Europe when investigating fuel cell vehicles. Vehicle production and disposal, use phase, fuel combustion, and maintenance are considered. The environmental impacts assessed are climate change by GWP, terrestrial acidification, human toxicity, photochemical oxidant formation and particulate matter (PM). The results showed that if the
13
hydrogen as a fuel is produced from rewnewable energy the GWP will decrease by 50%.
Delogu et al. (2016a) have four recommendatons for the transportation sector to lower their environmental impacts: reducing the GWP, reducing other toxins resulting in improved air quality, increases of performance and the degree of recyclability and recoverability. The benefits for the environment can include: weight reduction, improved manufacturability, higher material efficiency, fewer waste production, and fewer transportations of final products (Kellens et al. 2017).
The environmental burdens of automotives and their components all differ depending of fuel type, lifetime, region, manufacturing site and freight transporational pathways. Appendix A summerizes the environmental impacts, regions, lifetimes and components investigated in the previous studies above.
1.5 Purpose and Objectives of Study
The purpose of the study is to identify environmental impacts of a plastic com-ponent in a car and to increase the knowledge of LCA within the commissioner company, to assist in decision-making about product development towards a more sustainable vehicle component.
The main objective of the study is to perform an environmental life cycle as-sessment (E-LCA) of an existing panel. The first objective is a scenario anal-ysis of four scenarios regarding four parts made of three different materials. The second objective is to compare the scenarios in respect to the midpoint indicators; global warming potential, acidification potential, eutrophication potential, photochemical ozone creation potential, primary energy demand and particulate matter. The last objective is to conduct a dominance, contribution and sensitivity analyses to identify the hotspots of the life cycle.
14
2 METHODOLOGY
2.1 Case Study
Geely Auto, Lynk & Co, Volvo Cars, Polestar, PROTON, and Lotus are auto-motive brands at least partly owned by Zheijiang Geely Holding Group (Geely 2018). Geely Group founded China Euro Vehicle Technology (CEVT) AB in 2013 to be their internal innovation center (www.cevt.se). CEVT is the com-missioner of the study. CEVT aim to develop innovative world-class, automo-tive technologies for the automoautomo-tive brands owned by the Geely family. As awareness of environmental impacts grow among consumers, manufacturers are driven towards sustainable designs. CEVT is fully aware of these design needs and this study is an outcome of this awareness.
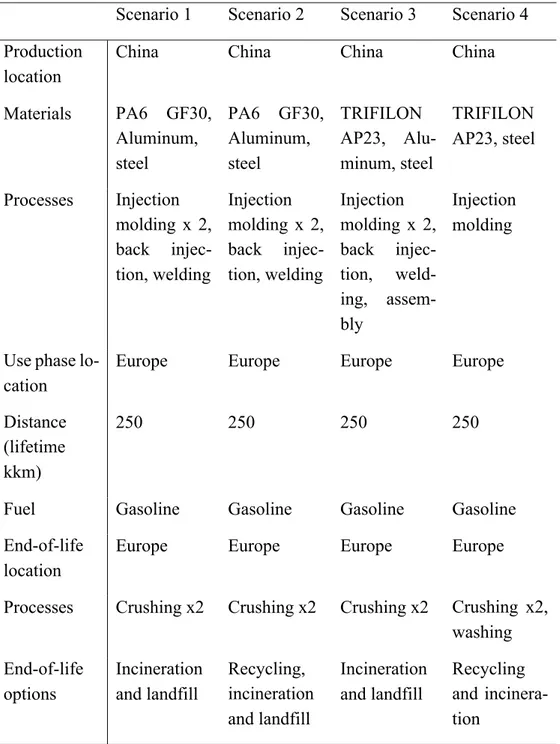
In this thesis, an E-LCA of the automotive component based on a deco panel in a car. The car is currently only sold on the Chinese market, but a similar model will be launched in Europe within a few years. The production phase for all scenarios is in China. The use phase and the EoL have the geographical location of Europe. The study encompasses four different scenarios, see Table (4) below.
Scenario 1 is the reference scenario. The reference scenario contains one type of plastic for two of the four parts of the component. The reference scenario does not include recycling of the panel, making landfilling or incineration the only options. Recycling of these kinds of panels are uncommon due to the ma-terial attached to the plastics. However, Stena Recycling believe there will be significant potential regarding recycling plastics in the future. Therefore, Sce-nario 2 is SceSce-nario 1 including recycling as options for the EoL. SceSce-nario 3 and 4 have a different type of plastic than the previous scenarios. The EoL for Scenario 3 is incineration and landfill and Scenario 4 is recycling and incin-eration. Scenario 4 is without the aluminum foil, the most light-weight scenario of the thesis and is referred to as the ideal scenario.
15
Table (4) summarizes the different scenarios with their assumptions – what variables change and geographic locations of the subsystems.
Table 4 Case study scenarios
Scenario 1 Scenario 2 Scenario 3 Scenario 4
Production location
China China China China
Materials PA6 GF30, Aluminum, steel PA6 GF30, Aluminum, steel TRIFILON AP23, Alu-minum, steel TRIFILON AP23, steel Processes Injection molding x 2, back injec-tion, welding Injection molding x 2, back injec-tion, welding Injection molding x 2, back injec-tion, weld-ing, assem-bly Injection molding
Use phase lo-cation
Europe Europe Europe Europe
Distance (lifetime kkm)
250 250 250 250
Fuel Gasoline Gasoline Gasoline Gasoline
End-of-life location
Europe Europe Europe Europe
Processes Crushing x2 Crushing x2 Crushing x2 Crushing x2,
washing End-of-life options Incineration and landfill Recycling, incineration and landfill Incineration and landfill Recycling and incinera-tion
2.2 Description of System for Assessment
2.2.1 Goal and Scope
Step one is the goal of the LCA, which is to calculate the six midpoint indica-tors: global warming potential, acidification potential, eutrophication potential,
16
photochemical ozone creation potential, primary energy demand, and particu-late matter. The next subsections define the scope.
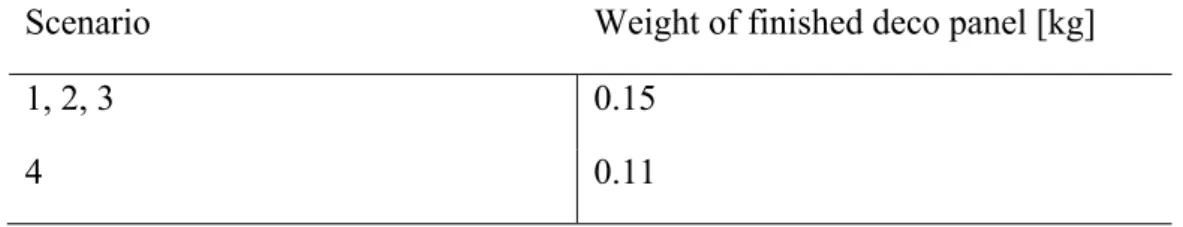
The functional unit for this study is a deco panel in the instrumental panel in a gasoline car. The deco panel is based on data from the commissoner. The reference deco panel is of the materials polyamide 6 glass fiber 30%, aluminum foil and steel clips. The functional unit has different product weight demonstrated in Table (5).
Table 5 Functional unit according to scenarios
Scenario Weight of finished deco panel [kg]
1, 2, 3 0.15
4 0.11
Figure (5) and (6) visualize the functional unit. Figure (5) illustrates the functional unit with reference from CEVT internal powerpoint and Figure (6) is a fictitious image of the instrumental panel retrieved from
https://pixabay.com/sv/photos/bil-bmw-kup%C3%A9n-instrumentbr%C3%A4da-1834279/.
Figure 5 Functional unit
17
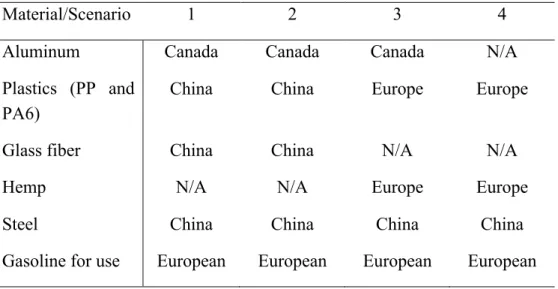
The production of the functional unit and the fuel for internal transportation is China and Chinese respectively. The electricity mixture in the EoL is European. The deco panel is produced in China. Table (6) demonstrates where the different materials are from.
Table 6 System boundaries of material extraction sites
Material/Scenario 1 2 3 4
Aluminum Canada Canada Canada N/A
Plastics (PP and PA6)
China China Europe Europe
Glass fiber China China N/A N/A
Hemp N/A N/A Europe Europe
Steel China China China China
Gasoline for use European European European European
The production of aluminum is at the producer primary production. The mining of bauxite, transportation and processing of aluminium oxide (alumina) before another transporation and electrolys before end production of aluminum ingot is considered. The aluminum sheet production considers the transformation and recycling of extrusion scrap.
Table (7) states the given material properties of the two plastics used in the case study. The first plastic is composed of 70% polyamide 6 (PA6) and 30% glass fiber (GF) and is the current plastic the commissioner uses for this type of panel. The second plastic might be of potential for future use in components and is called TRIFILON AP23 manufactured by the company TRIFILON. It’s a composition of 70% polypropylene (PP) with 30% hemp fibers.
Table 7 Material properties of the two plastics used in case study
Material Tensile Modulus
[MPa]
Density [kg/m3]
Heat deflection temperature [℃]
PA6 GF30 9500 1360 220
TRIFILON AP23
18
The granulate PA6 is made with process water, nitrogen, caprolactam, electricity and steam. The hemp fibers’ manufacturing regards purification, breaking, pressing of hurds, condensing, and cleaning out short fibers. There is also transport considered in this process using diesel as fuel. The plastic con-sidered in this study is assumed to be polychlorinated biphenyl (PCB)-free and therefore is not landfilled. The hemp and polypropylene in Scenario 3 and 4 are assumed to be produced in Germany but the production of the plastic com-position AP23 is in Sweden.
The material with glass fiber has a higher tensile modulus than the one with hemp fibers. This means the material is more stiff and tougher, making the material more acceptable for higher temperatures. The glass fibers’ production considers the batch materials for making up glass fiber and then melting and conditioning with energy sources such as electricity, natural gas, lubricants and silicone fluids.
The raw material extractions are based on the percentile share in the given ma-terial used for plastics.
The area and volume of material pieces are not considered for the injection molding processes. The energy required for the injection molding is control, heating and drive obtained from literature.
The steel clips are produced by energy from electricity and thermal energy. It considers the iron mining and the processes for manufacturing a steel cast part. The system boundaries for the raw materials are detailed but the processes used throughout the study are mainly based on electricity and weight.
The plastic’s heat deflection temperature is not considered based on the current location of the deco panel and the requirements for climate zones in cars. The injection molding process is carried out at very high temperatures and due to this the substrate in Scenario 3 is not injection molded to the back of the alu-minum foil. The foil is assumed to be ‘clipped’ onto the substrate.
The gasoline is assumed to be oil refined as European fuel as the car is used in Europe. The module for fuel consumption is based on literature, on an average light-weight component. The driving distance for the lifetime of the car is 250,000 km with a yearly lifetime of eight years, due to future goals of share/taxi cars. The use phase is not modeled as an entire car driving but a component driving by itself.
The assembly of the deco panel into the car is not accounted for, and therefore not the seperation of the car and the deco panel. However, the seperation of materials of the panel in the EoL is assumed to be of complete seperation.
19
2.2.2 Inventory Analysis
Step two, the inventory analysis is based on datasets from GaBi 8.7 (www.gabi-software.com), but also collected data at CEVT and articles/litera-ture. It included raw material production, energy consumption collections, transportations calculations and types, and processes as well as relevant data for the steps in the EoL.
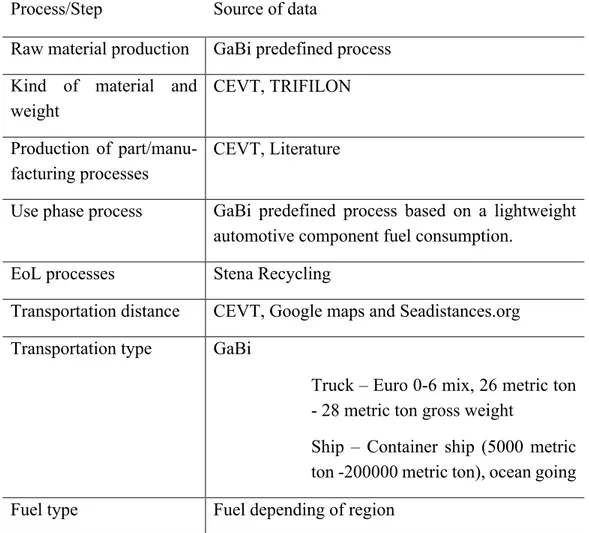
Table (8) briefly summarizes the source of data for the inventory used based on steps in the life cycle.
All the relevant input and output flows of the processes are specified in detail in Appendix B.
Table 8 Sources of data of inventory
Process/Step Source of data
Raw material production GaBi predefined process Kind of material and
weight
CEVT, TRIFILON
Production of part/manu-facturing processes
CEVT, Literature
Use phase process GaBi predefined process based on a lightweight
automotive component fuel consumption.
EoL processes Stena Recycling
Transportation distance CEVT, Google maps and Seadistances.org
Transportation type GaBi
Truck – Euro 0-6 mix, 26 metric ton - 28 metric ton gross weight
Ship – Container ship (5000 metric ton -200000 metric ton), ocean going
Fuel type Fuel depending of region
Table (9) below illustrates the final material used in the panel with its weight and in which scenario they are used in.
20 Table 9 Material used for parts of functional unit
Part/Name Material Weight [kg]
Substrate PA6 GF30 0.0804
Substrate TRIFILON AP23 0.0804
Bracket PA6 GF30 0.0294
Bracket TRIFILON AP23 0.0294
Foil Aluminum 0.04
Clip Steel 0.00068
The table (10) below explains the material distances travelled through the dif-ferent scenarios with which type of fuel.
Table 10 Total distance travelled by transportation type in the life cycle
Scenario Type of transport Fuel Distance [km]
1, 2 Truck Diesel 1659
Ship Heavy fuel 2646
3 Truck Diesel 1631
Ship Heavy fuel 81146
4 Truck Diesel 1327
Ship Heavy fuel 81146
2.2.4 Environmental Impact assessment
Step three is the environmental impact assessment. The midpoint indicators are calculated per CML2015, Impact 2002+ and Primary Energy Demand inte-grated in the LCA software GaBi 8. GaBi classifies the emissions into corre-sponding characterization factors, converting them into an equivalent factor to be summarized in relevant impact category. An example would be GHG con-verted into CO2 equivalents (eq).
Table (11) states the indicators’ definition, in which unit they are measured, and which characterization factors. The impact categories definitions are taken and defined in Baumann & Tillmann (2004), Sauar (2017) and EPA (2018).
21 Table 11 Definition of impact categories for assessment
Impact category Definition Unit
Global warming potential
Climate change due to GHG, which have the characteristic to absorb infrared radia-tion, which heats the atmosphere.
kg CO2 eq
Acidification potential
Reveals the acidification potential of a sub-stance. The acidifying substances form
acidifying H+ ions which effect the soil and
water.
kg SO2 eq
Eutrophication potential
Reflects the maximum potential of eutroph-ication of a substance. It includes emissions of nitrogen and phosphorus to air and water together with organic matter.
kg phos-phate eq
Photochemical ozone creation potential
Regional impacts of photo-oxidant formed in the lower atmosphere from sunlight with
NOx and hydrocarbons.
kg ethene eq
Primary energy demand
Nonrenewable and renewable energy sources. Examples are hard coal, hydro-power and such.
MJ
Particulate matter
The mixture of particles of solid and liquid form in the air, also called particle pollu-tion.
kg PM2.5
2.2.5 Interpretation of Results
Step four, the interpretation of the result, which a dominance analysis and a contribution analysis were conducted to identify the hotspots of the life cycle regarding the chosen midpoint indicators. The dominance analysis was carried out according to the contribution of each impact on a percentage basis for the production phase. The contribution analysis was conducted according to emis-sion categories of groups and broken down further into specific contributing emissions.
Due to uncertainties regarding collected data, a sensitivity analysis of alumi-num and use phase were conducted. Sensitivity analysis was carried out to compare the different scenarios. The constant increase and decrease of 10%
22
was compared between the scenarios. The parameters with the most uncer-tainty data are the aluminum and the use phase. They are uncertain due to the aluminum production based on European production with Chinese electricity and the use phase is regarding a different car than the actual model.
2.2.6 Modelling in GaBi
The modelling of the life cycle was made up of three main parts: 1) Production, 2) Use, and 3) EoL. The life cycle of this thesis is not circular but linear, see Figure (7), but it has open loop recycling. The open loop recycling is for the steel scrap and the scenarios when the plastic is made into new products. The output of the production was the finalized component, the deco panel (the func-tional unit), and this was also the input of the use phase.
Figure 7 GaBi model of life cycle in Scenario 1 through 4
The foil was modeled with the raw material aluminum ingot extraction in Can-ada which was shipped to China, and then transported by truck to the manu-facturing of aluminum sheet site.
For the substrate of Scenario 1 and 2, glass fiber and PA6 granulate was com-bined through injection molding which was transported by truck to the supplier site. The bracket of Scenario 1 and 2 was modeled similarly as it consisted of the same material as the substrate.
The substrate in Scenario 3 and 4, consisted of hemp fibers and PP granulates which were joined by injection molding in Europe and transported by ship and truck to the destination in China.
When the substrate and foil productions were finalized, they were assembled and welded together with the bracket. The steel raw material was extracted in China and the clips were manufactured and transported by truck to supplier before attachment to the welded panel of the substrate, foil and bracket. When assembly of the deco panel was completed, it was transported by truck to the assembly factory.
The use phase was based on a GaBi predefined fuel consumption process for a light-weight component in an automobile. However, the deco panel is first
23
transported to Europe, as the use phase is in Europe. This transportation is by truck to the harbor and by sea.
In the EoL, the steel clips are removed in the scenarios. The plastic parts (the welded panel) are placed in a grinder machine where it is crushed twice sepa-rating the plastic from the aluminum (this is in Scenario 1 through 3). The aluminum is melted, but unable to be recovered and therefore is placed in a landfill as slag. The plastic is incinerated, and energy is recovered into thermal energy credits and electricity credits to the grid.
In Scenario 3, the bracket is separated from the substrate and foil and recycled. It’s done by crushing and grinding into new granulates, and sometimes con-verted into pellets for the cement industry. For Scenario 4, all the plastic is recycled and modeled according to Figure (8).
24
3 RESULTS
Despite Scenario 2 being more recyclable than Scenario 1, Scenario 2 contrib-utes more than Scenario 1 in six out of the six impacts analyzed. Scenario 3 has a higher acidification potential than Scenario 1 and 2 and is consistently higher than all the impacts of Scenario 4.
Table (12) summarizes the impacts of the life cycle scenarios according to main phase.
Table 12 The environmental impacts for the deco panel according to scenario
Impact Scenario 1 Scenario 2 Scenario 3 Scenario 4
GWP, kg CO2 2.75 2.77 2.30 1.48 Production 1.35 1.35 0.81 0.49 Use 1.33 1.33 1.33 0.98 EoL 0.07 0.08 0.15 -0.001 AP, g SO2 eq 6.64 6.68 6.70 4.30 Production 4.5 4.5 5.0 2.9 Use 1.98 1.98 1.98 1.50 EoL 0.20 0.18 -0.15 0 EP, g Phosphate eq 0.69 0.70 0.68 0.50 Production 0.39 0.39 0.44 0.30 Use 0.27 0.27 0.27 0.20 EoL 0.04 0.05 -0.03 0 POCP, g Ethene eq 0.70 0.70 0.65 0.45 Production 0.40 0.40 0.36 0.24 Use 0.30 0.30 0.30 0.21 EoL 0.008 0.009 -0.012 0 PED, MJ 44.5 44.4 35.9 25.8 Production 25.2 25.2 17.9 11.3 Use 19.7 19.7 19.7 15.5 EoL -0.43 -0.47 -1.68 0 PM, g PM2.5 eq 1.49 1.50 1.40 0.91 Production 1.09 1.09 1.10 0.65 Use 0.36 0.36 0.36 0.26 EoL 0.04 0.05 -0.03 0
Emissions for all impacts can be divided into several groups, Figure (9) display the emissions per group and specific emission per life cycle. Figure (10)
illus-trates the energy main energy resources used in the scenarios. The GHG CO2
25
energy resource used the most throughout the scenarios is crude oil and which has the highest amount in Scenario 1.
Figure 9 Emission contribution analysis of the life cycle of the deco panel
Figure 10 Contribution analysis of energy resources in life cycle
3.1 Global Warming Potential
Scenario 1 and 2 contribute the highest to the GWP out of all the scenarios, see Figure (11). Scenario 3 is about 16% less than Scenario 1. Scenario 4 is almost 46% less than Scenario 1.
The total GWP for the life cycle of Scenario 1 is 2.75 kg CO2 eq. 49% of the
life cycle’s contribution is due to the production of the panel, see Table (12).
The GHG contributing to GWP are mostly CO2 (92% of all the emissions) and
0 1 2 3 4 5 6
CH4 CO2 (kg) PFC N2O NOx PM SOx VOC HAP
g em is si on s p er li fe cy cl e
Emissions throughout life cycle
Scenario 1 Scenario 2 Scenario 3 Scenario 4
0 5 10 15 20 25
Scenario 1 Scenario 2 Scenario 3 Scenario 4
MJ p er li fe cy cl e
Energy from resource (net cal. value)
Energy from hard coal Energy from crude oil Energy from natural gas Energy from renewable26
N2O as well as some VOC mainly due to Methane and other Halogenated
or-ganic emissions, see Figure (8) for contribution analysis. The use phase and the EoL contributes with 48.4% (due to incineration of plastic) and 2.53% (due to fuel consumption) respectively.
Scenario 2’s GWP is slightly higher with 2.77 kg CO2 eq. due to higher impact
in the EoL. The second main contributor (9.5%) is due to production of the aluminum foil, see Figure (11) for dominance analysis. The main contributors are the incineration of the plastics and the melting of the aluminum sheet.
The GWP contributions for Scenario 3 are a total of 2.3 kg CO2 eq. The
pro-duction phase contributes 35.3%, the use phase contributes 58.1% and the EoL contributes 6.6%. The aluminum foil contributes with 11.4%, the substrate with 12%, the bracket with 4.3% and the clips with less than 1%.
The total GWP for Scenario 4 is 1.48 kg CO2 eq. see Table (12). The GHG for
Scenario 4 are displayed in Figure (9) and are primarily CO2. The use phase is
the main contributor due to fuel consumption and fuel type being gasoline. The production phase only accounts for 33.5% in this scenario. The EoL has a pos-itive effect of -0.0744% which can be assumed to be zero.
Figure 11 Dominance analysis of Global Warming Potential of the study
3.2 Acidification Potential
The acidification potential for Scenario 1, 2 and 3 are similar. The difference is less than 1 %. However, Scenario 4 differs by 35% with Scenario 1, see Figure (12). 0% 10% 20% 30% 40% 50% 60% 70% 80% 90% 100%
Scenario 1,2 Scenario 3 Scenario 4
GWP of Production phase
27
In Scenario 1’s total acidification potential of the life cycle, the production
contributes with 70% of the total of 6.6 g SO2 eq, see Table (12). This is due
to the inorganic emissions to air, see Figure (8) for contribution analysis. Scenario 2’s acidification potential has the same total as Scenario 1 but the EoL is slightly higher. However, it’s negligible at it being 0.1% of the total.
The total acidification potential of Scenario 3 is 6.7 g SO2 eq. In Scenario 3,
the production phase contributes more and the EoL has a positive effect (neg-ative value). The main contributors from the plastic production are the injec-tion molding and the electricity used to assemble the part producinjec-tion. Another contributing factor is the shipping between Europe and China, see Figure (11). In Scenario 4, 66.3% of the total acidification potential is due to the production of the plastic parts. The total amount is 4.30 g SO2 equivalents. 40.2% due to the substrate and 14.7% due to the bracket. The use phase accounts for 33.7% of the total. Within the production phase, transportation freight contributes by 52.0%, see Figure (12), due to shipping from Europe.
Figure 12 Dominance analysis of Acidification Potential of the study
3.3 Eutrophication Potential
Scenario 1,2 and 3 follow the same trend for eutrophication potential as the acidification potential with similar contribution to the life cycles of the deco panels in the scenarios. Scenario 4 contributes with 29% less than Scenario 1, see Figure (13). The transportation freight of the scenarios contributes more to eutrophication potential than acidification potential, see Figure (13).
0% 10% 20% 30% 40% 50% 60% 70% 80% 90% 100%
Scenario 1,2 Scenario 3 Scenario 4
AP of Production phase
28
0.699 g phosphate eq measuring the eutrophication potential in Scenario 1 and the production phase accounts for 55.3% of the contributions. 75% of the total is due to inorganic emissions mainly as NOx, see Figure (9). Emissions to fresh water contributes 25.0% as organic emissions like oil play a major role,
but also inorganic emissions to fresh water due to NO, P and PO4. The use
phase and EoL contributes with 38.7% and 6.0%.
The total eutrophication potential of Scenario 2 is similar to Scenario 1 but differs decimals in the EoL. This is due to that more material is being inciner-ated and therefore higher amounts of NOx.
In Scenario 3, the deco panel contributes with 0.68 g phosphate eq. The main contributor in the production phase is the substrate production and the alumi-num manufacturing. The EoL has the impact of -4.55% due to electricity and thermal energy credits gained.
The EoL of Scenario 4 a higher positive effect of the total contributions due to the recycling of plastic parts. The transportation freight contributes with ap-proximately 30% in the production phase, see Figure (13).
Figure 13 Dominance analysis of Eutrophication Potential of the study
3.4 The Photochemical Ozone Creation Potential
The photochemical ozone creation potential does not have a significant differ-ence between Scenario 1 and 2. Scenario 3 is about 7% less than Scenario 1 and Scenario 4 is 36% lower than Scenario 1, see Figure (14).
0% 10% 20% 30% 40% 50% 60% 70% 80% 90% 100%
Scenario 1,2 Scenario 3 Scenario 4
EP of Production phase
29
In Scenario 1, inorganic emissions to air like SO2, NOx and CO contribute with
52% of the total of 0.70 g ethene equivalent of Scenario 1’s life cycle. Organic emissions such as methane and NMVOC contribute the most. The production phase represents 58% of the total photochemical ozone creation potential, mak-ing it the main contributmak-ing phase. This is mainly due to the high inorganic
emission of SO2. The EoL contributes with 1.12%.
The photochemical ozone creation potential for Scenario 2 of the EoL has the contributions of 1.24% of the total amount making it higher than Scenario 1, see Table (12). The transportation freight contribution is lower out of a percen-tile perspective than the eutrophication potential and the acidification potential. The total photochemical ozone creation potential for Scenario 3 is 0.65 g eth-ene eq. The production phase accounts for 57.2% and the EoL contributes with a positive effect of -1.9%.
In Scenario 4, the production phase accounts for 53.3% of the total of 0.45 g ethene eq. in the life cycle. The impact of the clips in Scenario 3 and 4 can be seen in Figure (14), see red mark.
Figure 14 Dominance analysis of Photochemical Ozone Creation Potential of the study
3.5 The Primary Energy Demand
The energy demand for Scenario 1 and 2 differ with less than 1%. Scenario 3 is 19% less than Scenario 1, which is 42% larger than the contributions of Sce-nario 4, see Figure (15).
0% 20% 40% 60% 80% 100%
Scenario 1,2 Scenario 3 Scenario 4
POCP of Production phase
30
The Primary Energy Demand throughout the life cycle of Scenario 1 has the total of 44.4 MJ, 89 % of nonrenewable energy resources and 11% of renewa-bles. The EoL has a positive impact, see Table (12). The nonrenewable energy resource with the most contribution is hard coal, natural gas and crude oil. The renewable energy resource with highest contribution is the primary energy from hydropower when aluminum is extracted. The EoL has a negative value (-0.96%).
The PED for Scenario 2 has a more positive effect on the life cycle than what it has in Scenario 1. This is due to the gained thermal energy credit obtained through the incineration process in the EoL.
The energy resources in Scenario 3 is 36 MJ, 31 nonrenewable and 5 renewable energy. The production phase contributes with 18 MJ, which is about 50% of the total, mainly due to production of the substrate and the bracket but also the aluminum extraction, see Figure (15).
The total amount of Primary Energy for Scenario 4 is 25.8 MJ, in which 94% is nonrenewable and 6% is renewable. The oil for the fuel is a large part, but also in the production stages of the plastics, oil is used due to the injection molding.
Figure 15 Dominance analysis of Primary Energy Demand of the study
3.6 Particulate Matter
The particles involved in the dust and thus the Particulate Matter follow a sim-ilar pattern in difference as the previous impact categories for Scenario 1, 2
0% 10% 20% 30% 40% 50% 60% 70% 80% 90% 100%
Scenario 1,2 Scenario 3 Scenario 4
PED of Production phase
31
and 3, see Figure (16). Scenario 4 contributes about 40% less than Scenario 1. The production phase is also the main contributor to the PM.
73.2% of the total of 1.49 g PM2,5 eq. for Scenario 1 is the production phase. The use phase and EoL are smaller with 24.0% and 2.76%. Particles to air(dust) supply 48.0% of the total due to extraction and production of aluminum ingot. Scenario 2 has a higher negative effect on the life cycle than Scenario 1. There are higher amounts of dust released throughout the EoL stage of Scenario 2. The processes contribute the most to the production phases of Scenario 1 and 2, see Figure (16).
The respiratory effects of Scenario 3 are 1.40 g PM2.5 eq. and in which 0.0011 kg occur in the aluminum extraction. The injection molding for the plastic and the production of the plastic are main contributors within the substrate and the bracket productions.
The impact of Scenario 4 regarding PM is 40% lower than Scenario 3. This is due to the production not having aluminum as surface material. However, it’s also due to the EoL being a positive value as the inorganic emissions and the dust particles to air are very small.
Transportation freight provide a larger role when speaking of PM than PED. NOx, NO2 and SO2 and particles to air (dust) are due to fuel consumption.
Figure (16), below, displays the PM for the production phases in the scenarios.
Figure 16 Dominance analysis of Particulate Matter of the study 0% 10% 20% 30% 40% 50% 60% 70% 80% 90% 100%
Scenario 1,2 Scenario 3 Scenario 4