A METHODOLOGY TO QUANTIFY PEDESTRIAN CRASH RATES
AGAINST STATEWIDE AVERAGES FOR ROADWAYS AND
INTERSECTIONS
Hatem Abou-Senna, PhD., P.E.
Assistant Professor
Center for Advanced Transportation Systems Simulations (CATSS) Department of Civil, Environmental and Construction Engineering (CECE)
University of Central Florida, Orlando, Florida 32816 Phone (407) 823-0808, E-mail: habousenna@ucf.edu
Essam Radwan, PhD., P.E., F. ASCE, Professor and Director, Center for Advanced Transportation
Systems Simulations (CATSS), Department of Civil, Environmental and Construction Engineering (CECE), University of Central Florida, Orlando, Florida 32816-2450, E-mail: Ahmed.Radwan@ucf.edu
Ayman Mohamed, PhD., P.E., PTOE, Senior Transportation Engineer / Adjunct Professor, AECOM /
UCF Civil Engineering Department, Orlando, FL. 32801, E-mail: Ayman.Mohamed@aecom.com
ABSTRACT
To date there are no clear or uniform standards for a method to measure pedestrian crash rates and compare it against a statewide average. In this paper, a novel methodology to measure pedestrian crash rates along roadways and intersections were quantified. The main objective is to identify critical pedestrian crash locations that are operating above its corresponding statewide average. It was crucial to address the pedestrian-vehicular conflict as the State of Florida currently tops the list in the “Dangerous by Design” report as having the highest four pedestrian incident locations in the Country. The main challenge was to identify a practical and correct exposure measure. In most cases, the exposure measure is either unavailable or can be obtained at a greater cost. The methods and procedures explained in this paper are considered detailed, practical and provide a broad depiction of the main factors that directly contribute to pedestrian crashes. The main parameters used in calculating pedestrian crash rates along roadways included functional classification, number of lanes, area type, AADT and the total length of the roadway category. Conversely, main parameters for computing pedestrian crash rates for intersections included daily pedestrian volumes, distance crossed and the AADT in addition to the number of pedestrian crashes either along the studied roadways or intersections. The pilot studies conducted for the roadways and intersections revealed several critical safety locations within District 5 when compared to the developed statewide average rates which required further investigation to identify main causes and emphasize mitigation improvements.
1.
INTRODUCTION
Pedestrian safety has become more prevalent for governmental agencies to address and prioritize for strategic constructing. With the transition to the mobility of people, to date there are no clear or uniform standards for a method to measure pedestrian incidents against a statewide average. However, the Florida Department of Transportation (FDOT) has developed vehicular crash rates that resulted in hypothesis that geometrics and traffic characteristics influence vehicle incidents and corresponding crash rates. Therefore, research is needed to evaluate / identify crash rates for pedestrians that would result in the
2
ability to identify locations within regions for higher than or above a statewide average on pedestrian crash rates.
Between 2006 and 2009, pedestrian fatalities in the United States declined from 4795 to 4109. However, the downward trend had halted and there were 4302 pedestrian deaths in 2010, increasing to 4457 in 2011 and 4743 in 2012 (1). The state of Florida has consistently ranked as one of the worst states in terms of pedestrian crashes, injuries and fatalities according to the National Highway Traffic Safety data (2). Ernst (2011) also indicated that four metro areas in Florida (Orlando-Kissimmee, Tampa-St. Petersburg-Clearwater, Jacksonville, Miami-Fort Lauderdale-Pompano) were considered the most dangerous for pedestrians among all the United States (3). Therefore, pedestrian safety is of particular concern to Florida.
Several studies used several methods and surrogate measures to estimate pedestrian crashes. In general, population, pedestrian volumes, time and distance are examples of the most studied surrogate measures for pedestrian exposure. The methods used in estimating pedestrian hot spot crash locations included density methods, clustering methods and other GIS-related methods. However, the main challenge in analyzing pedestrian crashes is to identify a practical and correct exposure measure as in the case with vehicular crashes. In most cases, the exposure measure is unavailable or can be obtained at a great cost. In this paper, statewide averages for pedestrian crash rates were quantified to identify critical pedestrian crash locations, thus evaluating locations that are operating beyond statewide averages and therefore emphasizing mitigation improvements.
2.
LITERATURE REVIEW
There have been numerous studies that were devoted to investigate and evaluate pedestrian safety at the national level as well as Statewide and local levels. Several studies also attempted to identify significant factors related to pedestrian accidents. The main factors discussed in this section include environmental factors, roadway characteristics factors, human factors, and vehicle characteristics factors.
Ernst et al. (2011) in the “dangerous by design” national report conducted for the Transportation for America examined the pedestrian fatalities for each state from 2000 to 2009 to identify the common thread on the roads. Using ten years of pedestrian fatality data, they used a Pedestrian Danger Index (PDI) to rank the country’s largest metropolitan areas according to their relative risk to walkers. The analysis concluded that Orlando tops the list of most dangerous places due to its high pedestrian fatality rate of 3 per 100,000 people, followed by Tampa, Jacksonville and Miami areas (3). Chang (2008) utilized the Fatality Analysis Reporting System (FARS) to analyze the trends in pedestrian fatalities and identify the probability of different contributing factors (4). He found that 26% of pedestrian crashes occurred from 3 p.m. to 6 p.m. in Chicago, which was the period with most occurrences. However, NHTSA found that 24.7% percent of pedestrian deaths were between 6 p.m. and 9 p.m. which was the highest number of pedestrian deaths during the whole day. Weather and lighting condition factors were also of common concern. Clifton (2009) and Mohamed et al. (2013) showed that poor lighting conditions lead to increase the likelihood of pedestrian injuries (5, 6). However, weather was not a significant factor in Dai (2012) findings (7). Ukkusuri et al. showed that a greater fraction of residential land use decreased pedestrian crashes compared to the industrial, commercial and open land use types in New York City (8). They also found that more pedestrian crashes were associated with larger road width. Other similar studies concluded that low density residential areas were more dangerous than compact areas (9, 10).
Lee and Abdel-Aty (2005) used four years of vehicle-pedestrian crashes data from 1999 to 2002 in Florida to identify roadway characteristics that were correlated with high pedestrian crashes using a log-linear model (11). They found that undivided roads with a greater number of lanes were more dangerous than divided roads with fewer lanes. Hanson (2013) also studied roadway characteristics which included the presence of sidewalks, buffers between the road and the sidewalk, number of travel lanes and presence of medians, traffic control at intersections, and posted speed limits with a database of pedestrian casualties (12). The results showed that lack of buffers between the road and the sidewalk and higher speed limits were found to be associated with higher pedestrian severe causalities and fatality rates. Chidester and Isenberg (2001) developed the Pedestrian Crash Data Study (PCDS) in 1994. The data were collected through on-scene crash investigations (or within 24 hours) of pedestrian crashes using two techniques, video camera recording and contour gauge, to collect 521 pedestrian crashes at six sites which were selected from around the nation (13). The study concluded that 68% of the involved vehicles were passenger cars and 32% were other light vehicles, including light trucks, vans, and utility vehicles. Brustman (1999) utilized two main databases to analyze pedestrian and bicyclist accident rates (14). One was “Hospitalizations Due To Bicyclist and Pedestrian Injuries” from the Department of Health (DOH), which was more reflective of the actual injury situation. The other was “Summary of Bicycle and Pedestrian Accidents on State Highways” from the Department of Transportation (DOT), which looked for clusters of accidents on state highway routes. They found that municipal streets had a higher probability of accidents involving a pedestrian compared to state roads, county roads, town roads and limited access highways. Thomas et al. (2009) used five years of state crash data and the perception data from 400 intercept survey respondents to identify the general trends in characteristics of people and the high risk locations in North Carolina (15). They used kernel density analysis method through GIS to identify high risk locations and exploited Ripley’s K-function test to decide whether crashes were clustered randomly.
An age-specific study of death rates due to pedestrian-car accidents in the city of Montreal was conducted in which the inner city was compared to the outer parts of the cities in four contiguous areas. They found that the rates are highest in downtown and decrease progressively in the outlying areas (16). Dumbaugh et al. (2012) mainly focused on the relationship between the built environment and pedestrian crash accidents in Texas (17). Negative binomial regression models were fitted to the data and it was concluded that the environmental factors associated with a vehicle-pedestrian crash were a combination of traffic conflicts and the vehicle speed. Dewey et al. (2003) pointed out why pedestrian fatality rates in Florida were higher than other states (18). A multivariate regression model was used to analyze specific factors that could relate to the pedestrian fatality, including environmental factors and accidents locations. They found that Florida residents walk more often in places that are exposed to traffic compared to other U.S. residents because of warm winters and the natural timing of summer and winter sunlight. Besides, there were millions of tourists visiting Florida every year, which led to more exposure to traffic. In another FDOT pedestrian safety study, Alluri et al. (2013) analyzed 6434 pedestrian crashes on roads during 2008-2010 in Florida (19). A mixed logit model was developed to identify factors contributing to pedestrian injury severity at signalized and non-signalized locations. Several countermeasures at both non-signalized and signalized locations were suggested to reduce pedestrian crash frequency and severity. Based on the literature review and previous studies, it can be seen that majority of the exposure measures used are either in an aggregate form and not accurate enough to represent a clear picture of the safety situation, or not practical enough to collect the data needed or do not indicate an overall level of the transportation activity. Very few studies in previous research that incorporated the product of P × V
4
(pedestrian and vehicular traffic) as a measure of exposure. Others included the pedestrian miles travelled. The proposed approach focuses on the level of pedestrian activity and the potential conflict between pedestrians and motor vehicles expressed in the amount of walking while at risk of being involved in a motor vehicle accident. Majority of the pedestrian-vehicle crashes occur while crossing the street whereas insignificant percentage of crashes occur while walking along the street. Therefore, it is believed that the pedestrian miles crossed (PMC) parameter is more representative of the risks associated with pedestrian exposure. Furthermore, since the exposure measure should directly reflect the amount of walking in areas shared with vehicles, the vehicular traffic volume is another significant factor that should be included in the equation. Based on that, the three (3) main significant parameters that were used in the exposure measure calculations in this paper are:
1- Pedestrian traffic 2- Distance crossed 3- Vehicular traffic
3.
METHODOLOGY
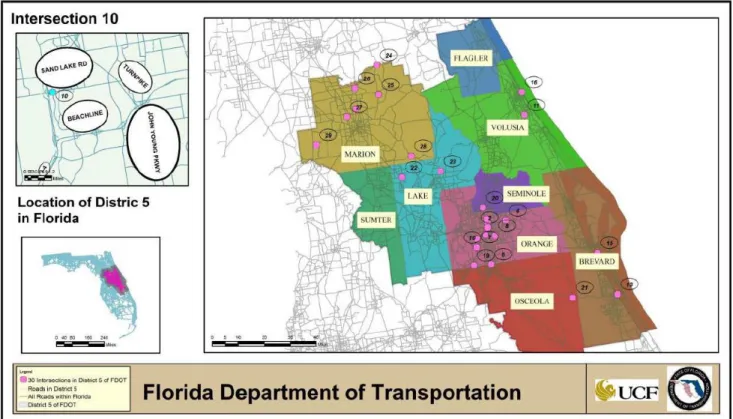
The methodology designed to arrive at the statewide averages for pedestrian crash rates involved two types of analyses; roadways and intersections. Statewide RCI data was collected from the GIS layers and classified according to their functional classification, area type and number of lanes as well as their annual average daily traffic (AADT) and total lengths. Intersection data was classified according to several parameters including their total entering traffic, total crossing distance, total daily pedestrians and type of control. Furthermore, the total statewide number of crashes over the 5-year period (June 2009 to May 2014) was identified for all the roadways and intersections. In addition to the intersection GIS data, sample intersection data was collected based on a pilot study within the nine (9) counties of FDOT District Five as shown in Figure 1. The purpose of the pilot study is to identify the critical pedestrian safety locations within the District and correlate this against safety locations based on statewide averages. The methodology is summarized into the following steps:
Roadways:
1- Identify statewide roadway categories and characteristics
2- Assemble statewide pedestrian crashes along roadways
3- Develop statewide average pedestrian crash rates along roadways
4- Determine critical segment locations within District 5
Intersections:
1- Identify statewide intersections and characteristics
2- Identify pedestrian crashes at signalized intersections
3- Pilot study for District 5 intersections
4- Estimation of intersection pedestrian volume
5- Intersection classification
6- Establish statewide average pedestrian crash rates at intersections
7- Determine critical hotspot locations within District 5
4.
ROADWAYS
4.1. Identify Statewide Roadway Categories and Crashes
FDOT roadway GIS layers were spatially joined to categorize the roadways according to their functional classification, area type, AADT, number of lanes and total lengths. The GIS layer from Signal Four Analytics database for the most recent 5-year period (June 2009- May 2014) was utilized to identify statewide pedestrian crashes along the roadways (20). The statewide data showed a total of 35,287 pedestrian related crashes. The crash layer was spatially joined with the roadways layer and a 15 feet buffer was used to identify the crashes that occurred specifically on the roadway segments. A total of 14,451 pedestrian related crashes were located along roadways involving the state highway system. There were 9,552 pedestrian crashes on the divided roadways while 4,899 crashes on the undivided roadways.
4.2. Develop Statewide Ped Average Crash Rates along Roadways
The exposure measure used to calculate pedestrian crash rates along the roadways included the total length in miles, total number of crashes and the AADT for each roadway category over the 5-year study period. The average number of daily pedestrians for each roadway category is not applicable in this case due to the fact that pedestrians are less confined to paths of travel than motor vehicles and that they often travel in closely spaced groups in specific areas. There will be numerous locations along the roadway with no pedestrians or no designated crossings except at intersections or mid-blocks which are addressed in the intersections’ section. Therefore, it is difficult to define an average number of pedestrians that are always using a 2-lane urban major arterial or 4-lane rural minor collector and generalize it statewide for the entire roadway type. Reliable data is necessary for measuring trends in facility use and for putting crash data into context. Accordingly, the formula used to calculate average pedestrian crash rates along roadways is:
APCR =
#𝑃𝐶
5∗ 10
85 ∗ 365 ∗ 𝐿
𝑖∗ 𝐴𝐷𝑇
𝑖Where: (1) APCR = Average Pedestrian Crash Rate per 100 million vehicle miles.
#PC5 = Number of Pedestrian Crashes over 5-year period Li= total length of the roadway category
ADTi= Average daily traffic for the roadway category
Using the above formula, statewide averages for pedestrian crash rates along roadways were established. The analysis resulted in a total of 70 different roadway categories with 70 different statewide average rates.
4.3. Area Type Adjustment Factor (ATAF)
From the analysis, it was found that the statewide average rates for rural roads exhibited very low values especially when compared with the urban rates. This could be attributed to the effect of averaging over the entire state and also due to the fact that rural roadway categories were less than the urban categories but have longer lengths since they connect between urban areas and usually have less AADT volumes than urban roads and with extremely low number of pedestrian crashes. In order to account for the pedestrians at risk on rural roads, an Area Type Adjustment Factor (ATAF) needs to be considered in the exposure measure for the rural areas. The analysis showed that out of the 21,434 miles of rural roads only 431 pedestrian crashes were recorded over the 5-year period. On the other hand, there were 12,233 pedestrian crashes recorded on the 23,145 miles of urban roads. Therefore, an ATAF of 0.04 is needed to
6
adjust for the pedestrians at risk in rural areas when compared to urban areas. Accordingly, the statewide average rates were revised to include the ATAF for rural roads.
APCR =
#𝑃𝐶
5∗ 10
85 ∗ 365 ∗ 𝐿
𝑖∗ 𝐴𝐷𝑇
𝑖∗ 𝐴𝑇𝐴𝐹
(2)
Where ATAF is (1) for urban roads and (0.04) for rural roads.
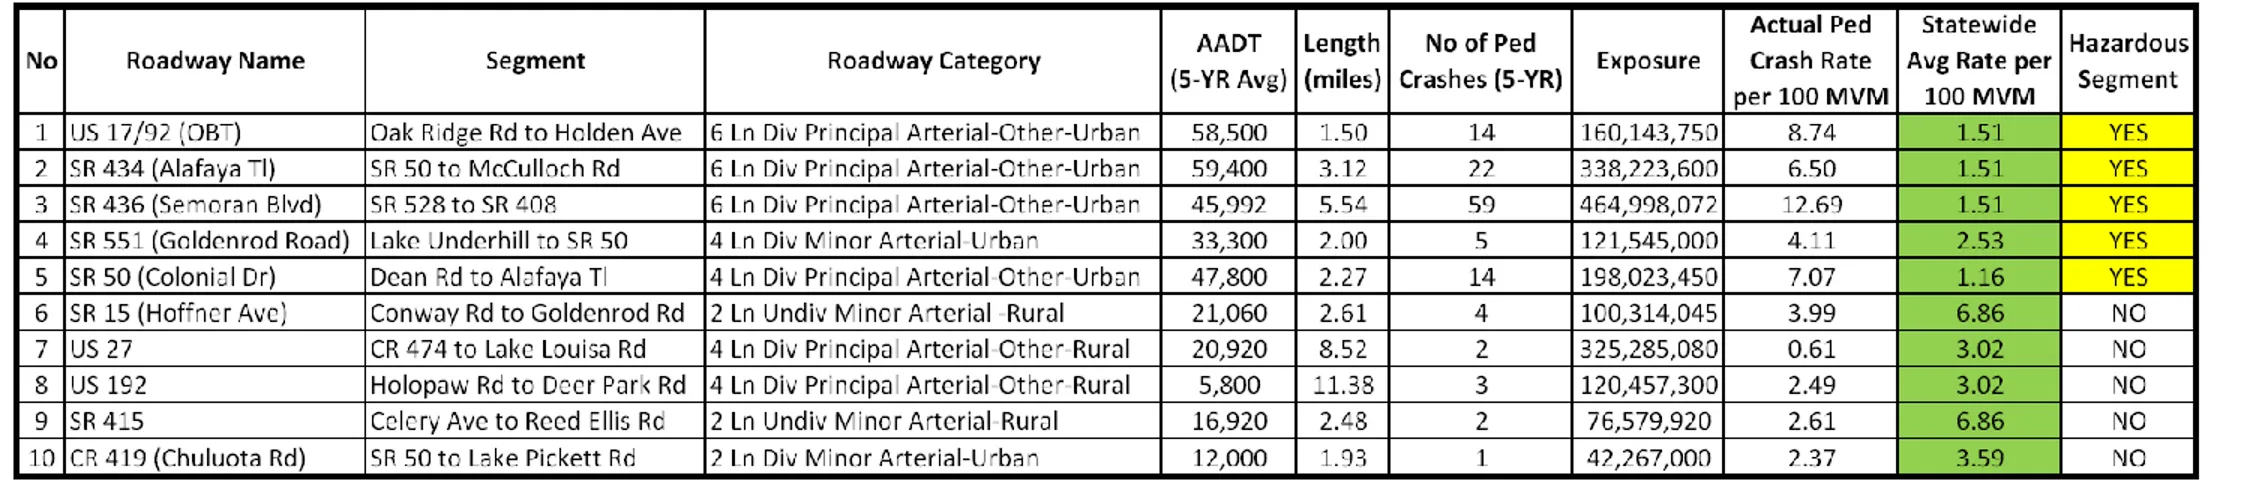
4.4. Determine Critical Segment Locations within District 5
A random sample of 10 segments located within FDOT district 5 jurisdiction were selected to identify critical safety concerns along these facilities and whether they are considered high crash locations. This should be determined by comparing the actual pedestrian crash rates to the developed statewide averages. The results showed that majority of the urban roadway segments within District 5 sample have the actual pedestrian crash rates greater than their corresponding statewide averages which qualifies them to be considered hazardous segments.
8
5.
INTERSECTIONS
5.1. Identify Statewide Intersections and Crashes
The FDOT GIS Portable Traffic Monitoring Sites (PTMS) shapefile along with the AADT layer were overlaid on top of the Intersection layer and a 10 feet buffer surrounding the intersection was used in order to determine the AADT associated with each approach. Conversely, a 250 feet buffer radius was created around each of the signalized intersections to isolate pedestrian crashes located at signalized intersections (within 250 feet) from those located along the roadway segments. A total of 6,684 statewide pedestrian crashes were located within the signalized intersections area of influence.
5.2. Pilot Study for District 5 Intersections
A pilot study was necessary to collect intersection specific data. FDOT District 5 was selected for this purpose out of the 6 districts in Florida due to its relatively high number of crashes compared to other districts. A sample of 52 intersections located within FDOT district 5 jurisdiction were selected to represent sufficient parameter variations to be utilized in the statewide analysis.
5.2.1. Data Collection
The 52 intersections were videotaped for 24 to 48 hours. Then the following data was extracted from viewing and analyzing the recorded tapes in increments of 15 minutes:
a. Number of daily vehicles at each directional approach (ADT)
b. Number of daily pedestrians crossing each directional approach (ADP)
c. In addition, distances crossed (DC) at each directional approach was measured from the aerial maps.
5.2.2. Pedestrian Crash Rates
As explained earlier, three (3) main significant parameters were required to calculate the exposure measure:
1- Average Daily Pedestrian traffic (ADP) 2- Distance Crossed (DC)
3- Average Daily Vehicular traffic (ADT)
The following formula is used to calculate the actual pedestrian crash rate at intersections:
APCR =
#𝑃𝐶
5∗ 5280 ∗ 10
6
5 ∗ 365 ∗ ∑
𝑛𝑖=1𝐴𝐷𝑃
𝑖∗ 𝐷𝐶
𝑖∗ 𝐴𝐷𝑇
𝑖Where: (3) APCR = Actual Pedestrian Crash Rate
#PC5 = Number of Pedestrian Crashes over 5-year period
∑𝑛 𝐴𝐷𝑃𝑖
𝑖=1 ∗ 𝐷𝐶𝑖∗ 𝐴𝐷𝑇𝑖= Sum of cross product of the average daily pedestrians * distance
crossed in feet * average daily traffic for each directional approach (1 to 8).
It was more appropriate to use the sum of the product of the pedestrian miles crossed (PMC) and entering volume (ADT) for each entering and departing approach separately instead of using the cross product of the aggregate sum of each parameter along all approaches as depicted on Figures 2a and 2b. The above parameters were extracted from the sample intersections and pedestrian crash rates per million pedestrian miles crossed per entering vehicle (MPMC/EV) was calculated for each intersection.
5.2.3. Estimation of Intersection Pedestrian Volume
Since statewide pedestrian counts at each intersection are not available and not feasible to collect, it needs to be estimated from existing data. The 52 sample intersections, where pedestrian count data were collected, were utilized for this analysis.
5.2.4. Statistical Analysis
Different data transformations were applied to the parameters and the highest correlation was found between the Distance (DIST), square root of the daily traffic volume (SQRTADT), natural logarithm of Population (LNPOP) and the natural logarithm of pedestrian volume (LNADP) with an adjusted coefficient of determination (R2) of 72.08%.
10 Figure 2a: Pedestrian exposure at eight (8) intersection crossings.
5.3. Intersection Classification
The 3 main parameters required to calculate the exposure measure at intersections are now available especially after applying the above model for estimating pedestrian volume. The next step in the process demanded the classification of the intersections based on these 3 parameters. The sample intersection data was used to examine distributions of total crossed distances as well as the total daily number of pedestrians at each intersection. Based on the total distance crossed for all the approaches, Intersections were classified as:
a. Intersections with total crossing distance less than 200 ft (11 intersections) b. Intersections with total crossing distance between 200 ft and 300 ft (17 Int) c. Intersections with total crossing distance between 300 ft and 400 ft (17 Int) d. Intersections with total crossing distance greater than 400 ft (7)
Similarly, intersections were classified based on the total daily number of pedestrians crossing the intersection approaches to provide similar number of intersections at each pedestrian category as shown in parenthesis from the pilot intersection data:
a. Intersections with total daily pedestrians less than 100 pedestrians per day (16 Int) b. Intersections with total daily pedestrians between 100 and 300 pedestrians per day (17) c. Intersections with total daily pedestrians more than 300 pedestrians per day (19 Int)
On the other hand, statewide total daily number of vehicles at every intersection in the State of Florida was obtained from the data associated with the traffic monitoring sites as explained earlier. The following classification based on the total daily number of vehicles provided similar number of intersections at each AADT category as shown in parenthesis from the statewide intersection data:
a. Intersections with total AADT less than 20,000 vehicles per day (836 Int) b. Intersections with total AADT between 20,000 and 30,000 veh per day (827 Int) c. Intersections with total AADT between 30,000 and 40,000 veh per day (772 Int) d. Intersections with total AADT between 40,000 and 50,000 veh per day (537 Int) e. Intersections with total AADT more than 50,000 vehicles per day (518 Int)
Based on the above classifications, there existed 5*4*3 = 60 different combinations for average values for crash rates at the intersections.
5.4. Establish Statewide Average Pedestrian Crash Rates at Intersections
Based on the intersection classifications and combinations of the different ranges, the statewide averages for pedestrian crash rates at intersections were established. It was found that 47 different averages out of the 60 were generated. The remaining averages for the 13 combinations were not found in the database. Table 2 shows a sample of the developed statewide averages for the intersection crash rates.
5.5. Determine Critical Hotspot Locations within District 5
The final step in the process included the application of the developed statewide average rates to the sample data for the purpose of identifying critical hotspot locations within District 5. The 52 sample intersection actual crash rates based on the data collected from the field were compared against the statewide average rates as shown in Table 3. The results showed that few of the intersections within the urban boundary of District 5 triggered safety concerns as critical locations which require further investigation to identify main causes and emphasize mitigation improvements at those locations.
12 Table 2: Sample Statewide Averages for Pedestrian Crash Rates at Intersections
No
Intersection Classification & Ranges
Statewide
Average Rate per
MPMC/EV
1 < 20,000 vpd & < 100 ped & < 200 ft Average 8.527
2 < 20,000 vpd & < 100 ped & 200 - 300 ft Average 4.214
3 < 20,000 vpd & < 100 ped & 300 - 400 ft Average 2.260
4 < 20,000 vpd & < 100 ped & > 400 ft Average 5 < 20,000 vpd & 100 - 300 ped & < 200 ft Average 3.353
6 < 20,000 vpd & 100 - 300 ped & 200 - 300 ft Average 0.908
7 20,000 - 30,000 vpd & 100 - 300 ped & 300 - 400 ft Average 0.816
8 20,000 - 30,000 vpd & 100 - 300 ped & > 400 ft Average 9 20,000 - 30,000 vpd & > 300 ped & < 200 ft Average 0.199
10 20,000 - 30,000 vpd & > 300 ped & 200 - 300 ft Average 0.161
11 20,000 - 30,000 vpd & > 300 ped & 300 - 400 ft Average 0.174
12 20,000 - 30,000 vpd & > 300 ped & > 400 ft Average 13 40,000 - 50,000 vpd & < 100 ped & < 200 ft Average 9.675
14 40,000 - 50,000 vpd & < 100 ped & 200 - 300 ft Average 1.199
15 40,000 - 50,000 vpd & < 100 ped & 300 - 400 ft Average 1.382
6.
CONCLUSIONS & RECOMMENDATIONS
To date there are no clear or uniform standards for a method to measure pedestrian incidents against a statewide average. In this study, statewide averages for pedestrian crash rates along the roadways as well as the intersections were quantified. The main objective is to identify critical pedestrian crash locations, thus evaluating locations that are operating beyond or above statewide averages, identifying main causes and developing a prioritization tool to emphasize mitigation improvements. It was crucial to address the pedestrian-vehicular conflict as the State of Florida currently tops the list in the “Dangerous by Design” report as having the highest four (4) pedestrian incident locations in the Country. The main challenge in analyzing pedestrian crashes is to identify a practical and correct exposure measure. In most cases, the exposure measure is either unavailable or can be obtained at a greater cost. The methods and procedures explained in this paper are considered detailed, practical and provide a broad depiction of the main factors that directly contribute to pedestrian crashes. The main parameters used in calculating pedestrian crash rates along the different roadway categories which combine the functional classification, number of lanes and area type together were the AADT and the total length of the roadway category. Conversely, the main parameters used for computing pedestrian crash rates for the different intersection classifications were the daily pedestrian volumes, distance crossed and the AADT in addition to the number of pedestrian crashes either along the studied roadways or intersections. The pilot studies conducted for the roadways and intersections revealed several critical safety locations within District 5 when compared to the developed statewide average rates which require further investigation to identify main causes and emphasize mitigation improvements. It is recommended that an annual statewide pedestrian count program be initiated for the intersections as well as roadways which would increase the sample size and help in validating the assumptions provided in this study. The purpose and duration of data collection are essential pieces of information for determining the appropriate data.
14
7.
ACKNOWLEDGEMENT
The work reported is part of an ongoing research project under contract number BDK24-TWO#977-07, which is sponsored by the Florida Department of Transportation (FDOT). The views expressed in this paper do not necessarily reflect those of the sponsors. The authors would like to thank FDOT for their support.
8.
REFERENCES
1. Williams, A. (2013). Pedestrian Traffic Fatalities by State.
2. National Highway Safety Adminstration, N. H. T. S. (2011). Traffic Safety Facts 2011 data. 3. Ernst, M., Lang, M., & Davis, S. (2011). Dangerous by design: solving the epidemic of
preventable pedestrian deaths.
4. Chang, D. (2008). National Pedestrian Crash Report.
5. Clifton, K. J., Burnier, C. V., & Akar, G. (2009). Severity of injury resulting from pedestrian– vehicle crashes: What can we learn from examining the built environment? Transportation
Research Part D: Transport and Environment, 14(6), 425-436. doi: 10.1016/j.trd.2009.01.001
6. Mohamed, M. G., Saunier, N., Miranda-Moreno, L. F., & Ukkusuri, S. V. (2013). A clustering regression approach: A comprehensive injury severity analysis of pedestrian–vehicle crashes in New York, US and Montreal, Canada. Safety Science, 54, 27-37. doi: 10.1016/j.ssci.2012.11.001 7. Dai, D. (2012). Identifying clusters and risk factors of injuries in pedestrian–vehicle crashes in a
GIS environment. Journal of Transport Geography, 24, 206-214. doi: 10.1016/j.jtrangeo.2012.02.005
8. Ukkusuri, S., Miranda-Moreno, L. F., Ramadurai, G., & Isa-Tavarez, J. (2012). The role of built environment on pedestrian crash frequency. Safety Science, 50(4), 1141-1151. doi:
10.1016/j.ssci.2011.09.012
9. Cho, G., Rodriguez, D. A., & Khattak, A. J. (2009). The role of the built environment in
explaining relationships between perceived and actual pedestrian and bicyclist safety. [Research Support, Non-U.S. Gov't]. Accident Analysis Prevention, 41(4), 692-702. doi:
10.1016/j.aap.2009.03.008
10. Zajac, S. S., & Ivan, J. N. (2003). Factors influencing injury severity of motor vehicle–crossing pedestrian crashes in rural Connecticut. Accident Analysis and Prevention, 35(3), 369-379. doi: 10.1016/s0001-4575(02)00013-1
11. Lee, C., & Abdel-Aty, M. (2005). Comprehensive analysis of vehicle-pedestrian crashes at intersections in Florida. Accident Analysis and Prevention, 37(4), 775-786. doi:
10.1016/j.aap.2005.03.019
12. Hanson, C. S., Noland, R. B., & Brown, C. (2013). The severity of pedestrian crashes: an analysis using Google Street View imagery. Journal of Transport Geography, 33, 42-53. doi:
10.1016/j.jtrangeo.2013.09.002
13. Chidester, A. B., & Isenberg, R. A. (2001). Final report: The pedestrian crash data study. Society of Automotive Engineers.
14. Brustman, R. (1999). An Analysis of Available Bicycle and Pedestrian Accident Data: A Report to the New York Bicycling Coalition.
15. Thomas, L., Hamlett, C., Hunter, W., & Gelinne, D. (2009). Identifying Locations for Pedestrian and Bicyclist Safety Improvements in Chapel Hill and Carrboro, North Carolina.
16. Robert Allard, MD, & MSc, a. (1982). Excess Mortality from Traffic Accidents among Elderly Pedestrians Living in the Inner .pdf>. American Journal Of Public Health 72, 853-854. 17. Dumbaugh, E., Li, W., & Joh, K. (2012). Examining the Design and Developmental Factors
Associated with Crashes Involving Pedestrian, Cyclists, and Motorists in Urban Environments. 18. Dewey, J. F., Demslow, D., Lenze, D., Holt, L., & Lotfinia, B. (2003). Transportation issues:
pedestrian safety.
19. Alluri, P., Haleem, K., Gan, A., Lavasani, M., & Saha, D. (2013). Comprehensive Study to Reduce Pedestrian Crashes in Florida.
16
Appendix - Statewide Average Pedestrian Crash Rates for Divided Roadways
Divided Roadway Category
5-YR Number of Ped Crashes 5-YR AADT Total Length (mile) Statewide Crash Rate per
100 MVM
2-Lane - Divided Local - URBAN 89 7443 108.04 6.064 2-Lane - Divided Major Collector - RURAL 5 4380 78.50 19.922 2-Lane - Divided Major Collector - URBAN 967 9647 1153.97 4.760 2-Lane - Divided Minor Arterial - RURAL 15 4051 114.29 44.382 2-Lane - Divided Minor Arterial - URBAN 511 13124 575.79 3.705 2-Lane - Divided Minor Collector (Fed Aid) - URBAN 152 8289 239.61 4.193 2-Lane - Divided Principal Arterial-Other - RURAL 31 9118 152.42 30.558 2-Lane - Divided Principal Arterial-Other - URBAN 199 14652 228.05 3.263 3-Lane - Divided Local - URBAN 3 7367 10.14 3.667 3-Lane - Divided Major Collector - URBAN 108 11173 101.66 5.210 3-Lane - Divided Minor Arterial - URBAN 68 16686 73.03 3.058 3-Lane - Divided Minor Collector (Fed Aid) - URBAN 17 11320 14.05 5.857 3-Lane - Divided Principal Arterial-Other - RURAL 2 8071 102.99 8.240 3-Lane - Divided Principal Arterial-Other - URBAN 21 16482 35.89 1.945 4-Lane - Divided Local - RURAL 1 3850 12.03 29.580 4-Lane - Divided Local - URBAN 49 20295 73.45 1.801 4-Lane - Divided Major Collector - RURAL 2 10025 116.64 5.858 4-Lane - Divided Major Collector - URBAN 748 15434 1089.63 2.437 4-Lane - Divided Minor Arterial - RURAL 4 7451 101.66 9.042 4-Lane - Divided Minor Arterial - URBAN 2043 23835 1858.32 2.527 4-Lane - Divided Minor Collector (Fed Aid) - URBAN 92 13185 187.98 2.034 4-Lane - Divided Principal Arterial-Expressway - RURAL 4 29706 350.22 0.658 4-Lane - Divided Principal Arterial-Frwy and Expwy - URBAN 77 49155 519.58 0.165 4-Lane - Divided Principal Arterial-Interstate - RURAL 8 37999 762.82 0.378 4-Lane - Divided Principal Arterial-Interstate - URBAN 10 51122 508.62 0.527 4-Lane - Divided Principal Arterial-Other - RURAL 30 10755 1264.34 3.022 4-Lane - Divided Principal Arterial-Other - URBAN 1382 28393 2308.33 1.155 5-Lane - Divided Major Collector - URBAN 15 19333 10.14 4.192 5-Lane - Divided Minor Arterial - URBAN 81 30298 66.05 2.218 5-Lane - Divided Principal Arterial-Frwy and Expwy - URBAN 1 28250 21.27 0.456 5-Lane - Divided Principal Arterial-Interstate - URBAN 5 92502 18.03 0.164 5-Lane - Divided Principal Arterial-Other - URBAN 81 41642 65.92 1.617 6-Lane - Divided Local - URBAN 10 38853 1.91 7.372 6-Lane - Divided Major Collector - URBAN 60 30640 35.10 3.057 6-Lane - Divided Minor Arterial - URBAN 371 34409 308.23 1.917 6-Lane - Divided Minor Collector (Fed Aid) - URBAN 10 19248 2.14 13.309 6-Lane - Divided Principal Arterial-Frwy and Expwy - URBAN 42 96328 136.53 0.175 6-Lane - Divided Principal Arterial-Interstate - RURAL 7 48554 520.98 0.379
Divided Roadway Category 5-YR Number of Ped Crashes 5-YR AADT Length (mile) Statewide Crash Rate per 100 MVM
6-Lane - Divided Principal Arterial-Other - URBAN 1154 45934 910.85 1.511 7-Lane - Divided Principal Arterial-Frwy and Expwy - URBAN 6 80900 22.37 0.182 7-Lane - Divided Principal Arterial-Interstate - URBAN 7 183571 28.20 1.852 7-Lane - Divided Principal Arterial-Other - URBAN 37 51604 23.40 1.679 8-Lane - Divided Principal Arterial-Frwy and Expwy - URBAN 6 138421 39.42 1.506 8-Lane - Divided Principal Arterial-Other - URBAN 57 49186 46.29 1.372 9-Lane - Divided Principal Arterial-Interstate - URBAN 2 110250 7.21 0.344 6-Lane - Divided Principal Arterial-Other - URBAN 1154 45934 910.85 1.511 7-Lane - Divided Principal Arterial-Frwy and Expwy - URBAN 6 80900 22.37 0.182 7-Lane - Divided Principal Arterial-Interstate - URBAN 7 183571 28.20 1.852 7-Lane - Divided Principal Arterial-Other - URBAN 37 51604 23.40 1.679 8-Lane - Divided Principal Arterial-Frwy and Expwy - URBAN 6 138421 39.42 1.506 8-Lane - Divided Principal Arterial-Other - URBAN 57 49186 46.29 1.372 9-Lane - Divided Principal Arterial-Interstate - URBAN 2 110250 7.21 0.344
18
Appendix - Statewide Average Pedestrian Crash Rates for Undivided Roadways
Undivided Roadway Category
5-YR Number of Ped Crashes 5-YR AADT Length (mile) Statewide Crash Rate per 100 MVM
1-Lane - Undivided Major Collector - URBAN 5 5500 16.92 2.944 1-Lane - Undivided Minor Collector (Fed Aid) - URBAN 5 6240 5.65 7.776 1-Lane - Undivided Principal Arterial-Other - URBAN 1 33000 5.31 1.565 2-Lane - Undivided Local - RURAL 39 7017 4203.49 1.811 2-Lane - Undivided Local - URBAN 260 5207 1443.28 1.896 2-Lane - Undivided Major Collector - RURAL 79 3131 5231.34 6.608 2-Lane - Undivided Major Collector - URBAN 1464 6664 5273.38 2.283 2-Lane - Undivided Minor Arterial - RURAL 69 5342 2578.46 6.862 2-Lane - Undivided Minor Arterial - URBAN 470 10758 1688.91 1.417 2-Lane - Undivided Minor Collector - RURAL 55 2439 4087.43 7.559 2-Lane - Undivided Minor Collector (Fed Aid) - URBAN 349 5009 1813.10 2.106 2-Lane - Undivided Principal Arterial-Frwy and Expwy - URBAN 1 5925 22.00 2.102 2-Lane - Undivided Principal Arterial-Other - RURAL 77 7153 1740.54 8.473 2-Lane - Undivided Principal Arterial-Other - URBAN 160 12705 730.20 0.945 3-Lane - Undivided Local - URBAN 3 7300 2.73 13.727 3-Lane - Undivided Major Collector - URBAN 75 9620 49.77 8.583 3-Lane - Undivided Minor Arterial - URBAN 102 11590 54.61 8.830 3-Lane - Undivided Minor Collector (Fed Aid) - URBAN 5 3867 5.08 13.945 3-Lane - Undivided Principal Arterial-Other - URBAN 164 19348 63.40 7.325 4-Lane - Undivided Local - RURAL 1 14400 2.35 40.480 4-Lane - Undivided Local - URBAN 5 5981 4.90 9.354 4-Lane - Undivided Major Collector - RURAL 1 10267 3.49 38.230 4-Lane - Undivided Major Collector - URBAN 132 9782 111.80 6.614 4-Lane - Undivided Minor Arterial - URBAN 337 16457 115.43 9.721 4-Lane - Undivided Minor Collector (Fed Aid) - URBAN 18 11285 13.10 6.673 4-Lane - Undivided Principal Arterial-Other - URBAN 160 20184 46.89 9.265