A web-service tool to generate crop rotation management input files for
spatially distributed agroecosystem models
Holm Kipka1, Olaf David, Jim Lyon and Luis A. Garcia
Department of Civil & Environmental Engineering, Colorado State University, Fort Collins, CO
Timothy R. Green and James C. Ascough II
United State Department of Agriculture (USDA) – Agricultural Research Service (ARS), Agricultural Systems Research Unit, Fort Collins, CO
Ken Rojas
United State Department of Agriculture (USDA) – Natural Resource Conservation Service, Fort Collins, CO
Abstract. For water quality assessment, there are currently models available like the Soil and
Water Assessment Tool (SWAT), Agricultural Policy / Environmental eXtender (APEX) and the component-based AgroEcoSystem-Watershed (AgES-W). These models use similar conceptual components to simulate nutrient and chemical transport by water using spatially distributed ecosystem response units (ERUs) and require input data about agricultural management operations for each ERU. The USDA Natural Resources Conservation Service (NRCS) is developing a Land Management and Operation Database (LMOD) which contains input data suitable as potential model input, but LMOD does not provide spatial functionality. A Java-based web-service tool, the Crop Rotation and Management Builder (CRMB), provides the missing spatial information for LMOD by using a spatially enabled data provider, the CropScape web service from the USDA National Agricultural Statistics Service (NASS). The NASS CropScape service offers a remote sensing based raster Crop Data Layer (CDL) for a specific year and a spatial Area of Interest (AOI). The ERUs are represented as a polygon in an ESRI shape file or as a list of
point-coordinates (to shape a geometry) text file. CRMB queries the annual main crop information from the NASS CropScape web-service for available CDL years. After reclassifying crop information within each AOI to adjust the final crop area using NASS CropScape provided accuracy values, CRMB selects the crop information by majority area size. CRMB then detects a sequence of main crops for every AOI and year, matches the crop sequence to actual available crop rotation
information in LMOD, and links the AOI to an actual crop rotation with all available management operation information. Finally, CRMB generates required management input files for the AgES-W model.
1. Introduction
Water is one of the most important natural resources. For water conservation and water quality management it is indispensable to work with innovative management tools, in particular distributed agro-climate-hydrologic modeling tools which simulate complex system interactions in time and space. Using such tools, it is possible to predict agro-hydrologic responses for different climate scenarios to better understand and assess hydrologically related responses. For example, climate impacts driven by high intensity
1 Department of Civil & Environmental Engineering
Colorado State University Fort Collins, CO 80523-1372 Tel: (970) 492-7360
summer rainfall events can cause surface runoff and soil erosion that carry soluble and undissolved nutrients into lakes, streams, and rivers. For preserving water-quality and soils to ensure sustainable agriculture for future generations, it is important to support
management practices with reliable modeling assessments (Ascough et al., 2012; Daggupati et al., 2011; Ghebremichael, 2013; Martin et al., 2005; Resop et al., 2012).
For water quality evaluation, there are currently models available like the Soil and Water Assessment Tool (SWAT) (Arnold et al., 2011; Arnold et al., 1998), Agricultural Policy / Environmental eXtender (APEX) (Williams et al., 2006) and the component-based AgroEcoSystem-Watershed (AgES-W) (Ascough et al., 2012; David et al., 2013). These models are developed to simulate complex system interactions at management (field) to watershed scales. The challenge is to find and to use suitable input data which can describe all system interactions at a high-resolution level. High-resolution modeling is linked to more detailed input data, an increase in input data requirements makes it more difficult to prepare and process data manually. To ease this processing burden, it is necessary to develop and use tools that: (1) access sources of input data either locally on a personal computer or from online data providers; (2) retrieve required data for a geospatial Area of Interest (AOI) by using Geographic Information System (GIS) functionality; (3)
automatically prepare the input data for model use; and (4) create model specific input files (Johnston et al., 2011).
This study presents the CRMB web-service tool to generate crop rotation management input files for spatially distributed agroecosystem models. The focus for developing this tool was to generate input data for field-scale modeling with the AgES-W model. 2. Methods and Materials
2.1. AgES-W
The component-based AgroEcoSystem-Watershed (AgES-W) model is implemented under the Object Modeling System version 3 (OMS3) environmental modeling framework (David et al., 2013). AgES-W simulates hydrological responses, water quality and
agronomic processes across spatially distributed and interconnected ecosystem response units (ERUs). The ERU concept is a further extension of the hydrological response unit (HRU) (Fluegel, 1996). These model units, with homogeneous land use as well as topological, pedological and geological properties, influence hydrologic dynamics. The current hydrological, water quality, and erosion components in AgES-W (Ascough et al., 2010; Ascough et al., 2012) were developed and integrated to model nitrogen dynamics and for soil erosion simulations with time steps ranging from hourly to monthly. AgES-W calculates a surface, two different subsurface (shallow and deep) and a groundwater flow (baseflow) water balance for every ERU. Water can flow laterally and/or vertically to topologically connected neighboring ERU. For water quality modeling, AgES-W needs agricultural management input (e.g., cropping and tillage systems) data for each ERU including the following input files: crop.csv, croprotation.csv, management.csv and tillage.csv file. The crop file (crop.csv) contains plant-specific input parameters required by the AgES-W crop growth component (e.g., radiation-use efficiency, maximum leaf area index, maximum canopy height, etc.). The crop rotation file (croprotation.csv) specifies a sequence of crops for each rotation. Every crop rotation has a Rotation ID (RID) and list of management IDs (MIDs) which are linked to the management file. The tillage file
operation. The management file (management.csv) combines for crop-specific information about management operations for specific dates. This file connects the crop, crop rotation, and tillage files.
2.3. Land Management and Operation Database
The USDA Natural Resource Conservation Service (NRCS) has established a Land Management and Operation Database (LMOD) which contains input data suitable as potential model input such as crop species, dates for planting and harvesting, and details for tillage operations. LMOD contains a comprehensive set of templates for management descriptions. It also supports linkages between management, operations, vegetation types and residues. The LMOD management information schema was originally developed by NRCS for the Revised Universal Soil Loss Equation, Version 2 (RUSLE2) soil erosion model. However, LMOD only provides data for 78 large-scale crop-management zones (CMZs) in the United Sates rather than small-scale data at the individual ERU level as required by AgES-W. For a single CMZ, LMOD provides a comprehensive set of crop management rotations (single-year or multi-year; single crop or multiple crops) and associated tillage operations with date and information about the operation efficiency and depth.
2.4. NASS CropScape Cropland Data Layer
The USDA National Agricultural Statistics Service (NASS) provides the CropScape web service application, a geo-referenced, high accuracy (56m resolution until 2009; 30m from 2010) crop-specific land cover information system (Han et at., 2012). The NASS CropScape data (Daggupati et al., 2011; Han et al., 2012; Johnson, 2013; Stern et al., 2012) are based on United States crop cover type satellite imagery classification from Advanced Wide Field Sensor (AWiFS), Landsat TM 5 and ETM+ 7. In addition NASS uses USDA Farm Service Agency (FSA) Common Land Unit (CLU) data with associated administrative data, NASS June Agricultural Survey (JAS) data and US Geological Survey (USGS) National Land Cover datasets (NLCD) as ground truth for remote sensing data validation. Furthermore, CropScape provides a description table with accuracy values for available crop information in the Cropland Data Layer (CDL) for every available year and every state in the US. CDLs are available for most states starting from the year 2000. For the Colorado test site example in this paper, CDLs are available from 2008-2012. Metadata within the CDLs also contain information about producer and user accuracies for the dominant commodity crops. Depending on the different types of satellites used and the availability of ground truth data, the user accuracy values can be different from year to year and from state to state (Table 1). Thus, CropScape provides a main crop name for a specific year at a specific location (every ERU-polygon or for a complete catchment) in the US.
2.5 Test Site Description
A small watershed in eastern Colorado was selected for the application of the Crop Rotation and Management Builder (CRMB). The watershed is part of an owner operated farm located in eastern Colorado between Fort Collins and Greeley (Figure 1) as described by Green et al. (2011) and McMaster et al. (2012). Using a surface runoff measurement station on the east side of this field (Scott Field) as an outlet point, the watershed size is 56
ha. The annual precipitation is approximately 350 mm and the annual potential evapotranspiration is approximately 1200 mm. The elevation at this small watershed ranges from approximately 1560 m to 1590 m a.s.l., with slopes up to 13% (Green et al., 2009).
Table 1. Producer accuracy (Prod. Acc.) and user accuracy (User Acc.) for fallow/idle cropland and winter wheat as example crops (e.g., Stern et al., 2012), and overall accuracy classification, and the Georeferenced Tagged Image File Format (GeoTIFF) resolution - by year for Colorado NASS Cropland Data Layer (CDL).
Y ear Prod. Acc. Fallo w / Idle Cropland [%] User. Acc. Fallow / Idle Cropland [%] Prod. Acc. Winter Wheat [%] User. Acc. Winter Wheat [%] Ov erall crops Acc. [% ] CDL GeoTIFF resolution [m] 2 008 2 009 2 010 2 011 2 012 82.20 85.27 85.70 83.00 82.80 78.00 92.58 92.20 88.50 86.90 85.40 92.36 92.80 89.90 93.60 86.80 95.08 95.50 94.50 95.00 74. 90 79. 94 83. 50 82. 10 83. 10 56 56 30 30 30
Figure 1. Scott Field watershed land-use information and outlet locations (UTM projection). 2.6 Crop Rotation and Management Builder (CRMB)
The CRMB is a Java-based web-service tool for generating input files for spatially distributed agroecosystem models. CRMB generates these input files for a spatially referenced Area of Interest (AOI). The AOI can be an ESRI shape file or a file with polygon point information. Most geospatial data are available in the Universal Transverse
Mercator (UTM) coordinate system. However, the NASS CDL CropScape server requires polygon information in the Albers Equal Area Conic projection. CRMB transforms spatial information from UTM to Albers Equal Area Conic before sending a web request for every polygon in a shape file. With the required polygon information and the year, the NASS CDL CropScape web server clips the CDL GeoTIFF online and returns a crop name list with a pixel count. Every polygon is linked to a list of main crop pixels for a specific year. For use as model input, it is then necessary to detect the dominant crop for every polygon. NASS provides accuracy values (Table 1) in the metadata for the dominant commodity crops (Han et al., 2012; Stern et al., 2012). CRMB reclassifies the NASS CDL CropScape results by using the provided accuracy values (Figure 2). The crop with the largest area for a specific year will be selected. CRMB tries to detect a crop rotation for every polygon using a list of possible crop rotations. For example, crop rotations could be “Winter Wheat - Fallow”, “Corn - Soybeans” or the same crop year after year in the same field
(continuous cropping). To map the detected crop rotations to the correct LMOD
information, CRMB invokes a UDSA web-service to get the CMZ location information for every polygon. The next step is to query LMOD by using existing web-services. If CRMB finds more than one matching crop rotation with the same crops, CRMB selects the LMOD crop rotation with the highest Soil Tillage Intensity Rating (STIR) value (a higher STIR value indicates traditional cropping). With the mapped crop rotation and management information, LMOD provides management data useful for agroecosystem modeling.
Finally, CRMB restructures the LMOD information to a model-specific input file structure. 3. Results
In the example study, the AOI is a land-use layer (ESRI shape file) from the Scott Field test site in eastern Colorado. To map the three polygons in this shape file to crop rotation management from LMOD, CRMB requires a crop name for every polygon. The annual main crop names for the test site are provided by the NASS CDL in the CropScape web-service for the years 2008 – 2012. Figure 2 demonstrates for Polygon 1 how the NASS CDL CropScape web server clips the 2008 CDL GeoTIFF with the Polygon 1 geometry. The CropScape raw result for Polygon 1 is shown in Table 4. Regarding the NASS
provided user accuracy values, 58% of the Polygon 1 area is misclassified for the 2008 raw result. CRMB reclassifies the area with the user accuracy values to 86.8% of the area to Winter Wheat (Table 2). Available ground truth data for this field and year confirm this result. CRMB (Table 3) detects for Polygon 0 continuous Grassland, for Polygon 1 and 2 for 2008-2009 a 2 year crop rotation “Winter Wheat - Fallow”. Polygon 1 continuous with the 2 year crop rotation, but polygon 2 changes the crop sequence to “Fallow – Winter Wheat”. For Polygon 0 CRMB provides separate input information for agroecosystem models, because “Grassland” land-use is not a crop type. The query results from the LMOD web-service for Polygons 1 and 2 are shown in Table 4. CRMB transforms the LMOD query results to the specific required input file format. Table 5 is related to the AgES-W input file requirement, with the CRMB results for the test site.
Figure 2. NASS CDL CropScape GeoTIFF 2008 overlay by the Scott Field land-use layer (Albers Equal Area Conic projection).
Table 2. Scott Field land-use layer Polygon 1, NASS CDL CropScape response raw result and after CRMB reclassification.
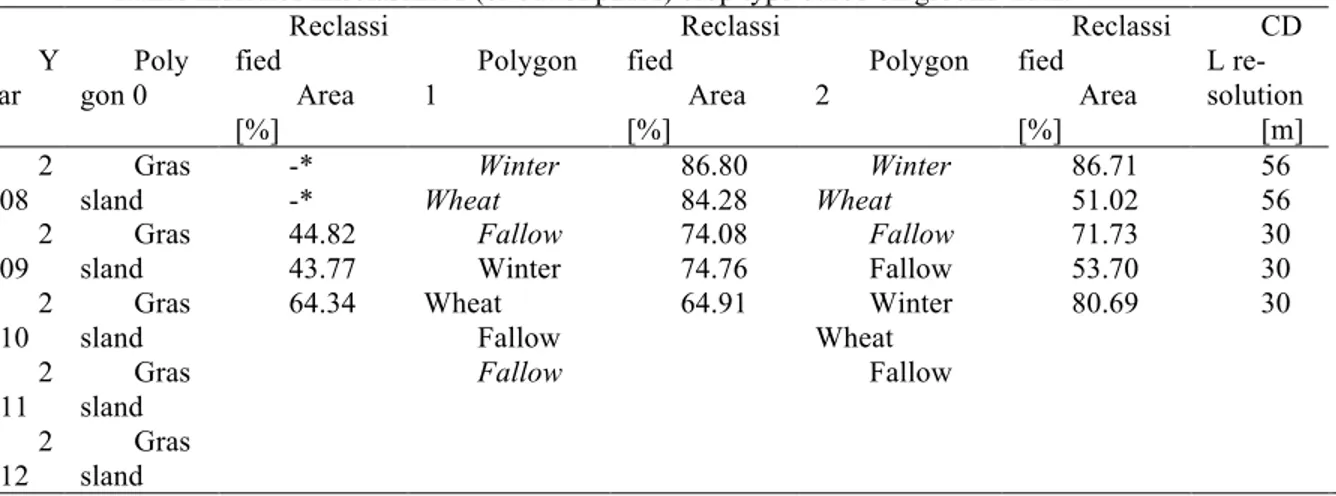
Table 3. CRMB result after NASS CDL CropScape reclassification for the test site land-use shape file. Italics indicates misclassified (or out of phase) crop type based on ground truth.
Y ear Poly gon 0 Reclassi fied Area [%] Polygon 1 Reclassi fied Area [%] Polygon 2 Reclassi fied Area [%] CD L re-solution [m] 2 008 2 009 2 010 2 011 2 012 Gras sland Gras sland Gras sland Gras sland Gras sland -* -* 44.82 43.77 64.34 Winter Wheat Fallow Winter Wheat Fallow Fallow 86.80 84.28 74.08 74.76 64.91 Winter Wheat Fallow Fallow Winter Wheat Fallow 86.71 51.02 71.73 53.70 80.69 56 56 30 30 30
* no NASS CropScape CDL accuracy value available Table 4. LMOD query results for Polygon 1 and 2.
LMOD Management Name Date [MM-DD] Operation Vegetation 1. Whe at, winter; fallow 09-10 07-20 10-20
Drill or airseeder, double disk Harvest, killing crop 50pct standing stubble
Chisel, sweep shovel
Wheat, winter 7in rows 2. Fall ow; Wheat, winter 06-01 08-30 09-10 07-10
Sweep plow than 40in with mulch treader
Rodweeder
Drill or airseeder, double disk Harvest, killing crop 50pct standing stubble
Wheat, winter 14in rows
Table 5. Management file schema for AgES-W. M ID Cr opID Date [MM-DD] Plant Flag Harv est Flag Description
8 28 09-10 1 - -Drill or airseeder; double disk
-Wheat; winter 7in rows
8 28 07-10 - 1 stubble -Harvest; killing crop 50pct standing
8 28 10-20 - - -Chisel; sweep shovel
9 28 06-01 - - -Sweep plow wider than 40 in w/ mulch treader
9 28 08-30 - - -Rodweeder
9 28 09-10 1 - -Drill or airseeder; double disk \Wheat;
winter 14in rows
9 28 07-10 - 1 -Harvest; killing crop 50pct standing
The ERUs (polygons 0-2) are linked to the MIDs. In the test site example Polygon 1 is linked to MID 8, Polygon 2 is linked to MIDs 8 and 9.
4. Summary and Conclusions
The CRMB tool to generate crop rotation management input files for spatially
distributed agroecosystem models provides the capability to link a specific geospatial AOI with higher resolution crop data to detailed crop rotation management and operation database information. An example was provided using CRMB with a ground truth result validation for a field in eastern Colorado. CRMB demonstrated the potential of using field-scale modeling ERUs. The current CRMB approach to query NASS CDL CropScape information requires one web-service request for every polygon (ERU), which makes this part of CRMB very time consuming. Additional research is also needed to improve the mapping of detected NASS crop rotations with LMOD crop rotations. Future CRMB improvements will eliminate these limitations. The current CRMB is designed to provide input data for the AgES-W agroecosystem model. This prototype may be adopted by others for application to other spatial models such as APEX and SWAT. The methodology allows using flexible CRMB input data, which indicates CRMB is able to create different agroecosystem model-specific input data.
Acknowledgements. This material is based on work supported by the Cooperative Agreement between Colorado State University (CSU) and the United States Department of Agriculture (USDA) Natural Resource Conservation Service (NRCS) & Agricultural Research Service (ARS) Agricultural Systems Research Unit under Agreement No. 58-5402-1-367.
References
Ascough II J. C., David O., Krause P., Heathman G. C., Kralisch S., Larose M., Ahuja L. R., Kipka H., 2012: Development and Application of a Modular Watershed-Scale Hydrologic Model Using The Object Modeling System: Runoff Response Evaluation. American Society of Agricultural and Biological Engineers, 55(1), 117-135.
Ascough II J. C., David O., Krause P., Fink M., Kralisch S., Kipka H., Wetzel M., 2010: Integrated Agricultural System Modeling using OMS 3: component driven stream flow and nutrient dynamics simulations. In: Swayne D.A., Yang W., Voinov A.A., Rizzoli A., Flitova T. (Eds.) Fifth Biennial Conference of the International Environmental Modeling and Software Society, Modelling for Environment’s Sake, 1089-1097.
Arnold J.G., Kiniry J.R., Srinivasan R., Williams J.R., Haney E.B., Neitsch S.L., 2011: Soil and Water Assessment Tool Input / Output File Documentation version 2009, Texas Water Resources Institute Technical Report No. 365, Texas A&M University System College Station.
Arnold J.G., Srinivasan R., Muttiah R.S., Williams J.R., 1998: Large-area hydrologic modeling and assessment: Part I, Model development. J. American Water Resources Assoc., 34(1), 73-89. David O., Ascough II J.C., Lloyd W., Green T.R., Rojas K.W., Leavesley G.H., Ahuja L.R., 2013: A
software engineering perspective on environmental modeling framework design: The Object Modeling System. Environmental Modeling & Software, Vol 39, 201-213.
Daggupati P., Douglas-Mankin K.R., Sheshukov A.Y., Barnes P.L., Devlin D.L., 2011: Field-Level
Targeting Using SWAT: Mapping Output HRUs to Fields and Assessing Limitations of GIS Input Data. American Society of Agricultural and Biological Engineers, 54(2), 501-514.
Fluegel W.A., 1996: Hydrological Response Units (HRU) as modeling entities for hydrological river basin simulation and their methodological potential for modeling complex environmental process systems – Results from the Sieg catchment, Die Erde, 127, 42-62.
Ghebremichael L.T., Veith T.L., Hamlett J.M., 2013: Integrated watershed- and farm-scale modeling framework for targeting critical source areas while maintaining farm economic viability. Journal of Environmental Management, 114, 381-394.
Green T.R., Erskine R.H., 2011: Measurement and inference of profile soil-water dynamics at different hillslope positions in a semi-arid agricultural watershed. Water Resources Research. Vol 47, 1-35. Green, T.R., Dunn G.H., Erskine R.H., Salas J.D., Ahuja L.R., 2009: Fractal analyses of steady infiltration
and terrain on an undulating agricultural field, Vadose Zone J. 8(2):310-320.
Han W., Yang Z., Di L., Mueller R., 2012: CropScape: A Web Service Based Application for Exploring And Disseminating US Conterminous Geospatial Cropland Data Products for Decision Support. Computers and Electronics in Agriculture, 84, 111-123.
Johnson D.M., 2013: A 2010 map estimate of annually tilled cropland within the conterminous United States. Agricultural Systems, 114, 95-105.
Johnston J.M., McGarvey D.J., Barber M.C., Laniak G., Babendreier J., Parmar R., Wolfe K., Kraemer S.R., Cyterski M., Knightes C., Rashleigh B., Suarez L., Ambrose R., 2012: An integrated modeling
framework for performing environmental assessments: Application to ecosystem service in the Albemarle-Pamlico basins (NC and VA, USA), Ecological Modeling, 222, 2471-2484.
Martin P.H., LeBoeuf E.J., Dobbins J.P., Daniel E.B., Abkowitz M.D., 2005: Interfacing GIS with Water Resource Models: A State-of-the-Art Review. Journal of the American Water Resource Association, 12, 1471-1487.
McMaster G.S., Green T.R., Erskine R.H., Edmunds D.A., Ascough II J.C., 2012: Spatial interrelationship between wheat phenology, thermal time, and terrain attributes. Agronomy Journal, 104(4), 1110-1121. Resop J.P., Fleisher D.H., Wang Q., Timlin D., Reddy V.R., 2012: combining explanatory crop models with
geospatial data for regional analyses of crop yield using field-scale modeling units. Computers and Electronics in Agriculture, 89, 51-61.
Stern A.J., Doraiswamy C., Hunt E.R., 2012: Changes of crop rotation in Iowa determined from the United States Department of Agriculture, National Agricultural statistics Service cropland data layer product. Journal of Applied Remote Sensing, 6, 063590-1-063590-16.
Williams, J.R., Izaurralde R.C., 2006: Chapter 18: the APEX model. In: Singh V.P., Frevert D.K. (Eds.), Watershed Models. CRC Press, Tayler and Francis Group, Boca Raton, 437-482.