Effects of climate change on the distribution of the Arkansas
River flow
Elgaali Elgaali,
Research Fellow, Integrated Decision Support Group, Department of Civil Engineering, Colo-rado State University Fort Collins
Luis A. Garcia1
Professor and Director, Integrated Decision Support Group, Department of Civil Engineering, Colorado State University, Fort Collins
Abstract. Understanding the effects of climate change on the distribution of river
flow has been a longstanding objective. This paper investigates the possible effects of such climatic changes on streamflow of the Arkansas River in Colorado. Changes in monthly flow regimes were projected and aggregated to a decadal time scale using two future climate scenarios. The streamflow projections were derived from a rela-tionship between streamflow and accumulated snow and temperature in the study re-gion mapped by a neural network developed for this purpose. April-September streamflow projections for the Arkansas River were analyzed for any changes. Results indicate an increase in the river flow, and in most cases the increases coincided with increased precipitation and temperature within the river basin. The historical peak flow shifted to from June to April. Frequency analyses of flow show that any flow in the months of April-July would be exceeded more frequently in the future. The per-cent of exceedance varies between the months. It is high for April-July; very low for August and almost negligible for September.
1. Introduction
Snowmelt is an important part of the regional hydrologic cycle in the west-ern United States. It accounts for 50-80% of the annual runoff in the area. Concerns have been increasing about the expected impacts of climate variabil-ity and change on snowmelt and the hydrology of the region. The hypothesized potential impacts of climate change include changes in winter snowfall and snow-melt, growing season rainfall amounts and intensities, minimum winter temperatures, and summer average temperatures (Baron et al.1998, 2000). In accord with this hypothesis, several recent studies have indicated increases in spring and early summer temperatures (Stewart et al., 2004; Regonda et al., 2005) and a decrease in the amount of spring snowpack (Mote et al., 2005). In addition, several studies of snowmelt dominated systems show similar seasonal shifts in snowmelt runoff as a result of warmer temperatures and a shorter
1
Civil Engineering Department Colorado State University Fort Collins, CO 80523-1372 Tel: (970) 491-5144
snow accumulation period (e.g., Cooley, 1990; Rango, 1995; Hamlet and Let-tenmaier, 1999; Wolock and MaCabe, 1999).
Recent studies (e.g., Stewart et al., 2004; Regonda et al., 2005; McCabe and Clark, 2005), using historical data analyses, have identified a change in timing (shift to earlier) in snowmelt runoff in many snowmelt-dominant river basins in the western United States. Almost all of these studies used site-by-site analysis, and none of them reported increases in streamflows. Howevern, in 2001, Groisman et al. reported an increase in heavy precipitation events in the region and detectable increases in streamflows using regionalized data sets instead of site data.
Precipitation and temperature fields from historical records and General Circulation Models (GCM) have been used in hydrologic models to study the impacts of climate variability and change on river runoff. In this paper we use the precipitation and temperature from a scaled-down grid box of the Hadley Centre for Climate Prediction and Research (HAD) and the Canadian Climate Centre (CCC) GCMs to explore changes in the distribution of the monthly flows of the Arkansas River in Colorado that would accompany future climatic changes. The focus in this paper is on changes in April-September streamflow. This is the time of effective runoff in the river and the growing season in the region. For future climate, the mean monthly flow is estimated over 90 years using an artificial neural network (ANN) simulation (Elgaali, 2005). The re-sults are compared to historical records of streamflow to give insights regard-ing the direction of the change. An important element of current research in climate change and variability is the analysis of trends in hydroclimatic vari-ables from instrumental records.
2. Description of study area
This study focuses on the Arkansas River Basin in Colorado. Bounded on the west by the Rocky Mountains, on the east by Kansas, and on the south by New Mexico and Oklahoma (Figure 1), the area covers approximately 72,742 km2 (28,415 square miles). The basin encompasses about 27 percent of the state of Colorado. The headwaters of the Arkansas River are located near Leadville, at an elevation of over 3,050 m (10,000 feet) above sea level. From there, the Arkansas River’s elevation drops rapidly until it emerges from the mountains near Pueblo. The river then runs in an easterly direction until it reaches the Colorado-Kansas border near Holly, Colorado at an elevation of about 1,036 m (3,400 feet).
In the Arkansas River Basin, temperature and precipitation vary widely in response to topographic differences. Average annual temperatures ranges from 2o C at Leadville in the mountains to 12° C at Lamar in the lower valley. Sea-sonal variations in temperature are very large. The average frost free season (0
o
C) varies from 85 days at Leadville to 167 days at Canon City.
Precipitation is distributed unevenly throughout the year. Precipitation ranges from 229 to 305 mm per year in the middle and eastern parts of the re-gion, 406 to 508 mm in the western part, and as much as 1,143 mm in the highest mountain ranges. At high elevations, much of the precipitation occurs
as snow. Runoff from this snowfall constitutes 50-80% of the annual water supply for the region, and water supply varies from year to year depending on the amount of winter snowpack in the mountains. In general, more than 60 cent of the average annual runoff occurs between April and July, with 20 per-cent occurring between August and October.
Figure 1. Features of the study area in the Arkansas River Basin, Colorado.
3. Data
The data used in this study consist of historical and future climate scenar-ios. The data was provided by the Vegetation-Ecosystem Modeling and Analy-sis Project (VEMAP) (Kittel et al., 1995). The VEMAP project developed cli-mate data sets for the continental United States. The clicli-mate data includes his-torical data from 1895-1993 and projections from two GCM-based scenarios for 1994-2099.
The historical time series were derived from: a) variable length data re-cords from 1895-1990 (1,200 stations) and b) short data rere-cords from 1951-1990 (6,000-8,000 stations). The two GCM models, the HAD and the CCC, generated future climate data (projections) assuming a progressive 1% annual increase (transient) in atmospheric CO2 concentrations.
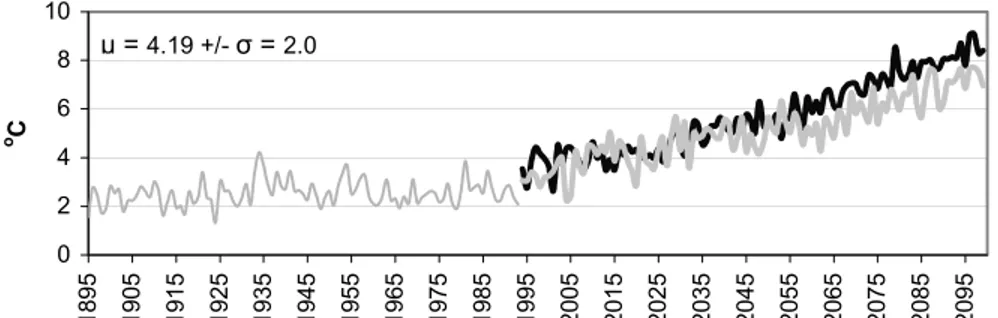
For the VEMAP, the conterminous US was divided into 0.5oX0.5o grid cells in order to simulate small-scale influences such as local topography and ecosystems on climate (Kittel et al., 1995). As a part of the VEMAP project, the National Center for Atmospheric Research (NCAR) processed, spatially in-terpolated (downscaled), and topographically adjusted the historical and the projected climate data to the 0.5o lat/long VEMAP grid. The downscaling process accounted for the effects of local topography on climate parameters. Projections from the two downscaled GCMs for the study area are shown in Figure 2. The figure shows the mean +/- standard deviation for each parameter.
Minimum Temperature 0 2 4 6 8 10 18 95 19 05 19 15 19 25 19 35 19 45 19 55 19 65 19 75 19 85 19 95 20 05 20 15 20 25 20 35 20 45 20 55 20 65 20 75 20 85 20 95 o C µ =4.19 +/- σ =2.0 Precipitation 0 100 200 300 400 500 600 700 189 5 190 5 191 5 192 5 193 5 194 5 195 5 196 5 197 5 198 5 199 5 200 5 201 5 202 5 203 5 204 5 205 5 206 5 207 5 208 5 209 5 mm
Transient/CCC Transient/Hadely Historical µ = 299.28 +/- σ = 65.0
Figure 2. Time series of annual precipitation and minimum temperature. The figure includes both historical data from 1895-1993 and projections for 1994-2099.
The historical flow data used in this study is the monthly flow in the Ar-kansas River at Pueblo for the period that extends between the years 1911 and 2000. The monthly distribution of the Arkansas River flow is shown in Figure 3, which shows the 30 years average flow for each month. This data set of monthly streamflow data, were obtained from the U.S. Geological Survey (USGS) online database (http://waterdata.usgs.gov/nwis/sw).
0 40 80 120 160 200 1 2 3 4 5 6 7 8 9 10 11 1 Month m o nt h ly f low i n c u b ic m e te rs X 1 0 6 2
Figure 3. Seasonal streamflow cycle of the Arkansas River at Pueblo.
As shown in Figure 1, 5 grid cells located in the Rocky Mountains were se-lected to provide climate data (precipitation and temperature) representative of the runoff to the Arkansas River. Each grid cell contains at least one snow course whose data has been used to forecast the runoff in the Arkansas River. The snow courses selected reflect the natural runoff and have a high correla-tion with the amount of snowmelt over the whole basin. The snow courses are listed on the United States Department of Agriculture’s Natural Resources Conservation Service (NRCS), National Water and Climate Center (NWCC) website and are presented in Table 1 with the corresponding VEMAP grid cell number.
Table 1. Characteristics of snow courses.
Station Latitude (deg) Longitude (deg) Elevation (m) Cell # Apishapa 37.33 105.07 3,040 2683 Brumley 39.08 106.53 3,222 2220 Fremont Pass 39.38 106.20 3,465 2221 Prophyry 38.48 106.33 3,271 2451 South Colony 37.97 105.53 3,294 2567 Whiskey Creek 37.22 105.12 3,117 2683
4. Methods
In this study historical and future scenarios of climate data were used to project the responses of streamflow in the Arkansas River to changes in cli-mate. An artificial neural network (ANN) model was developed and applied for that purpose. The ANN was trained to approximate the relation between the river flow and precipitation/temperature on the river basin being modeled.
4.1 Modeling streamflow
The ANN model used in this study is described by Elgaali (2005). A brief description is given here. The model is a three-layer feedforward neural net-work. Fields of precipitation and temperature from the 5 VEMAP grid cells in the mountains were used as inputs to the model. The model takes the following form:
Qr(t) = f (PPTa, T) (1)
where Qr(t) is the monthly mean streamflow, PPTa(t) is the accumulated
pre-cipitation from October of the previous year (beginning of the water year) to each month in the following year. For example the PPTa for April is the snow
pack from October-April. The temperature (T) is average temperature from April to each month being modeled. For example, the temperature for May is the average temperature of April and May; for April we used the temperature in March. The average temperature from April to July was used for July-August-September. Before applying the ANN, the input data were transformed to fall in the range [-1, 1].
4.2 Model testing and validation
Ninety years of data records (1911-2000) were used in training, validating, and testing the neural network. The data was portioned into three parts: 1) 1911-1960 was used for training, 2) 1961-1975 was used for validation, and 3) 1976-2000 was used for testing.
The performance statistics shown in Table 2 summarize the relationship between the simulated (output of the network) and the measured (target) values being modeled. The relation between the simulated and measured outputs is indicated by the correlation coefficient (R) and the Root Mean Square Error (RMSE). The correlation R statistic measures the linear correlation between the simulated and measured water available for irrigation; with an optimal value of 1.0. The Root Mean Square Error (RMSE) statistic measures the re-sidual variance with an optimal value of 0.0. As measured by the R statistic, there is a clear linear correlation between the measured and simulated water available for irrigation (high R values). Clearly, the RMSE performance of the model is good (small values) during both calibration (training) and testing, and the model appears to have a reasonable ability to match the stream diversion data. As expected, the model tends to have smaller R and larger RMSE values during validation.
Table 2. Summary of the Model Validation and Testing
Month Training Testing
R RMSE R RMSE April 0.634 0.17 0.562 0.24 May 0.790 0.10 0.770 0.18 June 0.863 0.11 0.847 0.15 July 0.899 0.06 0.740 0.13 August 0.852 0.06 0.781 0.12 September 0.904 0.07 0.769 0.17
5. Effects of climate change
Figure 4 shows the distribution of precipitation for the study area according to historical records and the two GCM (HAD/CCC) projections. Decadal-time scale changes in precipitation projections are shown. The monthly variation of precipitation is similar to the historical with increases in the winter and spring seasons and a decrease in summer. Under the HAD scenario the increase is larger in the winter but gets smaller toward the early summer with the smallest or negligible increase projected in June. Precipitation projections under the CCC are smaller than those under the HAD with the smallest or negligible in-crease projected in April. Under the CCC, the dein-crease from the historical be-gins in May. CCC 0 10 20 30 40 50 60 70 80
Oct Nov Dec Jan Feb Mar Apr May Jun Jul Aug Sep
P reci p itati o n (m m ) historical 2050s 2070s 2090s HAD 0 10 20 30 40 50 60 70 80
Oct Nov Dec Jan Feb Mar Apr May Jun Jul Aug Sep
P re c ipitation ( m m )
Figure 4. Precipitation distribution- average historical records (1960-1990) and projections from the two GCM (HAD/CCC).
Figure 5 shows the model’s projected streamflow for the Arkansas River for the historical records and the two projected climate scenarios. The figure shows that the greatest increases in flow occur from April through June. The increase in river flow comes from the early snowmelt in the mountains. Both of the GCMs project increases in winter snow. The increase of snow is very significant reaching approximately 70 percent of the current amounts. The in-crease in winter snow coupled with high projected temperatures results in early snowmelt. The projected peak flow occurs two months earlier than historically, in April rather than June. The climate change increased flow in April can be
due to the combined effects of the general increase in precipitation and in-creases in the melting snow and rainfall due to the effect of inin-creases in tem-perature. For the Arkansas, it appears that the major response to climate change is an increase in precipitation and temperature, which in turn increases the river flow and causes the peak flow to occur earlier. The monthly increases and decreases in river flow are reasonably well correlated with the increases and decreases in precipitation.
2090s 0 50 100 150 200 250 300 1 2 3 4 5 6 7 8 9 10 11 12 m onth fl ow (m 3X1 0 6) 2070s 0 50 100 150 200 250 300 1 2 3 4 5 6 7 8 9 10 11 12 month fl o w (m 3X1 0 6) 2050s 0 50 100 150 200 250 300 1 2 3 4 5 6 7 8 9 10 11 1 month fl o w (m 3X1 0 6) 2 CCC HAD Baseline
Figure 6 shows flow duration curves for monthly flow from April to Sep-tember under historical (baseline) climate and the HAD scenario. Flow dura-tion curves show the propordura-tion of time that river flow exceeds a given flow value. Under this scenario for almost all months the future flow duration curve lies above the historical (baseline) curve, indicating that the current or the his-torical flow in each month will be exceeded more frequently in the future. The percent of exceedance varies between the months; it is relatively high in April
April 0 20 40 60 80 100 120 140 160 0 20 40 60 80 100
percent of time flow exceeded
m o nt hl y f lo w ( m 3/s) May 0 20 40 60 80 100 120 140 160 0 20 40 60 80 100
percent of tim e flow exceeded
m o n thl y fl ow ( m 3/s ) June 0 20 40 60 80 100 120 140 160 0 20 40 60 80 100
percent of time flow exceeded
m o nt hl y f lo w ( m 3/s) July 0 20 40 60 80 100 120 140 160 0 20 40 60 80 100
percent of tim e flow exceeded
m o nt h ly f low ( m 3/s ) August 0 20 40 60 80 100 120 140 160 0 20 40 60 80 100
percent of tim e flow exceeded
m o nt hl y fl o w ( m 3/s ) Septem ber 0 20 40 60 80 100 120 140 160 0 20 40 60 80 100
perce nt of tim e flow exceeded
m o n thl y f low ( m 3/s ) HAD Baseline
through July and low in August while for September the curves look similar under the baseline climate and the HAD scenario. The curves for April-July are steep indicating greater variability in the flow in these months and shallow for August and September indicating stable flows in these months.
6. Summary
The two GCMs used in this study, the CCC and HAD, project an increase in temperature and winter/spring precipitation for the river basin region being studied. For the range of climatic conditions investigated, the results of this study suggest that the river flow process tends to amplify climate change sig-nals in precipitation and temperature in the study region. The results indicate that the current magnitudes of the river flow, especially in April-July, would be exceeded more frequently in the future. The results show an increase in spring-time flow; this increase is large enough to offset any decrease in summerspring-time flow. The results also show that the historical peak flow in June shifts to occur in April. These results are consistent with other studies (Cayan et al., 2001) about the expected effects of increased temperatures in the western United States.
The study region is suggested to be one of the regions most vulnerable to climate change. If precipitation amounts and timing change as projected it will has profound impacts on water resources planning and management in the re-gion. The results of this study are intended to give insights into changes of monthly river flow under two future climate scenarios.
References
Baron, J. S., M. D. Hartman, L. E. Band, and R. B. Lammers. 2000. Sensitivity of a high elevation Rocky Mountain watershed to altered climate and CO2. Water Re-sources Research 36:89-99.
Baron, J. S., M. D. Hartman, T. G. F. Kittle, L. E. Band, D. S. Ojima, and R. B. Lam-mers. 1998. Effects of land cover, water redistribution, and temperature on eco-system processes in the South Platte Basin. Ecol. Applications 8:1037-1051. Cayan, D. R., S. A. Kammerdiener, M. D. Dettinger, J. M. Caprio, and D. H. Peterson.
2001. Change in the onset of spring in the western United States. Bulletin Ameri-can Meteorology Society 82: 399-415.
Cooley, K. R., 1990. Effects of CO2- Induced Climatic Changes on Snowpack and Streamflow. Hydrological Science Journal 35(5): 511-522.
Elgaali, E. A. (2005) Modeling Regional Climate Change Impacts on Available Water
for Agriculture. Ph.D. dissertation, Colorado State University, Fort Collins,
Colo-rado.
Groisman, P. Ya., R. W. Knight, and T. R. Karl, 2001. Heavy precipitation and high streamflow in the contiguous United States: Trends in the twentieth century. Bull. Amer. Meteor. Soc. 82: 219-246.
Hamlet, A. F., and D. P. Lettenmaier, 1999. Effects of climatechange on hydrology and water resources in the Columbia River basin. Journal of the American Water Resources Association (JAWRA) 35: 1597-1623.
Kittel, T.G.F., Rosenbloom, N. A., Painter, T. H., Schimel, D. S., and VEMAP Mod-eling Participants (1995). “The VEMAP integrated database for modMod-eling United
States ecosystem/vegetation sensitivity to climate change.” J. Biogeog., 22, 857-862.
McCabe, G. J., and M. P. Clark. 2005. Trends and variability in snowmelt runoff in the western United States. Journal of Hydrology-American Meteorology Society 6: 467-481.
Mote, P. W., A. F. Hamlet, M. P. Clark, and D. O. Lettenmaier. 2005. Declining mountain snowpack in western North America. Bulletin of the American Mete-orological Society 86: 39-49.
Rango, A., 1995. Effects of Climate Change on Water Supplies in Mountainous Snowmelt Regions. World Resources Review 7(3): 315-325.
Regonda, S. K., B. Rajagopalan, M. Clark, and J. Pitlick. 2005. Seasonal cycle shifts in hydroclimatology over the western United States. J. Climate 18: 372-384. Stewart, I. R., J. D. R. Cayan, and M. D. Dettinger. 2004. Changes in snowmelt runoff
timing in western North America under a ‘business as usual’ climate scenario. J. of Climatic Changes 62: 217-232.
Wolock, D. M. and G. J. MacCabe, 1999. Estimates of Runoff Using Water-Balance and Atmospheric General Circulation Models. Journal of the American Water Re-sources Association (JAWRA) 35(6): 1341-1350.