JHEP08(2015)137
Published for SISSA by SpringerReceived: June 23, 2015 Accepted: July 15, 2015 Published: August 27, 2015
Study of (W/Z)H production and Higgs boson
couplings using H→ W W
∗decays with the ATLAS
detector
The ATLAS collaboration
E-mail: atlas.publications@cern.ch
Abstract: A search for Higgs boson production in association with a W or Z boson, in
the H→ W W∗ decay channel, is performed with a data sample collected with the ATLAS
detector at the LHC in proton-proton collisions at centre-of-mass energies√s = 7 TeV and
8 TeV, corresponding to integrated luminosities of 4.5 fb−1and 20.3 fb−1, respectively. The
W H production mode is studied in lepton and three-lepton final states, while two-lepton and four-two-lepton final states are used to search for the ZH production mode. The observed significance, for the combined W H and ZH production, is 2.5 standard deviations while a significance of 0.9 standard deviations is expected in the Standard Model Higgs boson hypothesis. The ratio of the combined W H and ZH signal yield to the Standard
Model expectation, µV H, is found to be µV H= 3.0+1.3−1.1(stat.)+1.0−0.7(sys.) for the Higgs boson
mass of 125.36 GeV. The W H and ZH production modes are also combined with the
gluon fusion and vector boson fusion production modes studied in the H → W W∗ → `ν`ν
decay channel, resulting in an overall observed significance of 6.5 standard deviations and
µggF+VBF+VH= 1.16+0.16−0.15(stat.)
+0.18
−0.15(sys.). The results are interpreted in terms of scaling
factors of the Higgs boson couplings to vector bosons (κV) and fermions (κF); the combined
results are: |κV| = 1.06+0.10−0.10, |κF| = 0.85+0.26−0.20.
Keywords: Hadron-Hadron Scattering, Higgs physics
JHEP08(2015)137
Contents1 Introduction 2
2 Analysis overview 2
3 The ATLAS detector 5
4 Data samples 5
5 Event reconstruction and selection 8
5.1 Event reconstruction 8
5.2 Event selection 9
5.2.1 Four-lepton channel 10
5.2.2 Three-lepton channel 12
5.2.3 Opposite-sign two-lepton channel 13
5.2.4 Same-sign two-lepton channel 13
5.2.5 Signal acceptance 14
6 Background modelling 14
6.1 Background in the four-lepton channel 15
6.2 Background in the three-lepton channel 15
6.3 Background in the opposite-sign two-lepton channel 18
6.4 Background in the same-sign two-lepton channel 18
6.5 Normalisation factors and composition of control regions 22
7 Systematic uncertainties 24
7.1 Theoretical uncertainties 24
7.2 Experimental uncertainties 27
8 Results 28
8.1 Event yields and distributions 29
8.2 Statistical method 35
8.3 Characterisation of the excess and V H signal region splitting 36
8.4 Signal significance extraction and determination of signal strengths 36
8.5 Measurement of the couplings to vector bosons and fermions 39
9 Conclusions 42
JHEP08(2015)137
1 IntroductionIn the Standard Model (SM) of fundamental interactions, the Brout-Englert-Higgs [1–3]
mechanism induces the electroweak symmetry breaking that provides mass to elementary particles. The mechanism postulates the existence of an elementary scalar particle, the Higgs boson. The ATLAS and CMS collaborations at the CERN Large Hadron Collider
(LHC) have observed the Higgs boson with a mass (mH) of about 125 GeV [4,5]. The
mea-surements of the Higgs boson couplings to SM particles, and its spin and CP quantum
num-bers, are essential tests of the SM [6–12]. Higgs boson production in association with a W or
Z (weak) boson, which are respectively denoted by W H and ZH, and collectively referred to as V H associated production in the following, provides direct access to the Higgs boson
couplings to weak bosons. In particular, in the W H mode with subsequent H→ W W∗
de-cay, the Higgs boson couples only to W bosons, at both the production and decay vertices. Searches for V H production have been performed at both the Tevatron and LHC colliders, in events with leptons, b-jets and either missing transverse momentum or two central jets. Evidence for V H production has been recently reported in the Tevatron
combination [13] while no V H production has been observed so far at the LHC [14–20].
In this paper, a search for Higgs boson production in association with a weak boson,
followed by H→ W W∗decay, is presented. The data were collected in 2011 and 2012 by the
ATLAS experiment at centre-of-mass energies of √s = 7 TeV and 8 TeV, respectively. In
the SM, for mH = 125 GeV, the cross sections of the W H and ZH associated production
modes, followed by the H→ W W∗ decay, are 0.12 pb and 0.07 pb at √s = 7 TeV and
0.15 pb and 0.09 pb at√s = 8 TeV [21], respectively. Four topologies are considered, with
two, three or four charged leptons in the final state (only electrons or muons are considered). The analyses are optimised to search for both the W H and ZH production modes; a combined result for V H is also presented. The V H results are then further combined
with the H→ W W∗ → `ν`ν analysis of gluon fusion (ggF) and vector boson fusion (VBF)
production, for which the ATLAS Collaboration has reported the observation of the Higgs
boson in the H→ W W∗ decay channel with a significance of 6.1 standard deviations [22].
The combination of the ggF, VBF and V H analyses, presented in this paper, is used to determine the couplings of the Higgs boson to vector bosons and, indirectly, to fermions, providing further constraints on the Higgs boson couplings.
2 Analysis overview
Higgs boson production in association with a W or Z boson, followed by H→ W W∗ decay,
is sought using events with two, three or four charged leptons in the final state. Leptonic
decays of τ leptons from H→ W W∗→ τ ντ ν are considered as signal, while no specific
selection is performed for events with hadronically decaying τ leptons in the final state. In the present analysis events from V H(H → τ τ ) are considered as background. The analysis
is designed to select events which are kinematically consistent with the V H(H→ W W∗)
JHEP08(2015)137
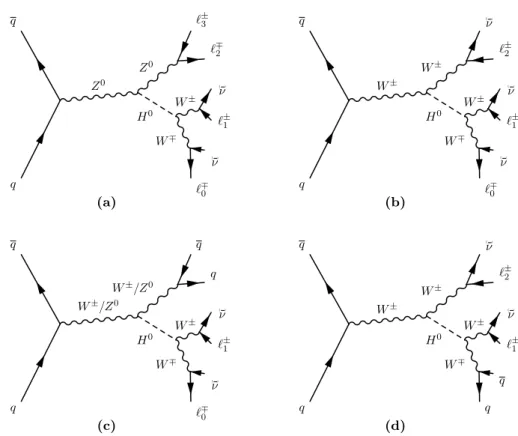
Z0 W∓ W± Z0 H0 q q ℓ∓0 () ν ℓ±1 () ν ℓ∓2 ℓ±3 (a) W± W∓ W± W± H0 q q ℓ∓0 () ν ℓ±1 () ν ℓ±2 () ν (b) W±/Z0 W∓ W± W±/Z0 H0 q q ℓ∓0 () ν ℓ±1 () ν q q (c) W± W∓ W± W± H0 q q q q ℓ±1 () ν ℓ±2 () ν (d)Figure 1. Tree-level Feynman diagrams of the V H(H→ W W∗) topologies studied in this analysis: (a) 4` channel (b) 3` channel (c) opposite-sign 2` channel and (d) same-sign 2` channel. For charged lepton external lines, the directions of arrows refer to the superscripted sign. Relevant arrows are assigned to the associated neutrino external lines.
tree-level Feynman diagrams of the studied processes, in which a Higgs boson is produced in association with a weak boson.
Four channels are analysed, defined as follows:
(a) 4` channel (figure 1(a)): the leading contribution consists of a process in which a
virtual Z boson radiates a Higgs boson, which in turn decays to a W boson pair. The decays of the weak bosons produce four charged leptons and two neutrinos in the final state. The lepton pair with an invariant mass closest to the Z boson mass
is labelled as (`2, `3), while the remaining leptons are labelled as `0 and `1 and are
assumed to originate in the H→ W W∗decay. The main backgrounds to this channel
are non-resonant ZZ∗ and ZW W∗ production.
(b) 3` channel (figure 1(b)): the leading contribution consists of a process in which a
virtual W boson radiates a Higgs boson, and the Higgs boson decays to a W boson pair. All the weak bosons decay leptonically producing three charged leptons and
three neutrinos in the final state. The lepton with unique charge is labelled as `0,
the lepton closest to `0 in angle is labelled as `1, and the remaining lepton is labelled
JHEP08(2015)137
most prominent background to this channel is W Z/W γ∗ production; non-resonant
W W W∗production is also a significant background having the same final state as the
signal. Other important backgrounds are ZZ∗, Zγ, Z+jets, t¯t and W t production,
as they pass the signal selection if a lepton is undetected or because of a misidentified or non-prompt lepton from a jet.
(c) Opposite-sign 2` channel (figure1(c)): the leading contribution consists of a
pro-cess in which the weak boson V , which radiates the Higgs boson, decays hadronically
and produces two energetic jets, while W bosons from the H→ W W∗ decay produce
two oppositely charged leptons, labelled as `0 and `1, and two neutrinos. The W H
process is expected to account for 70% of the signal yield, while the ZH process accounts for the remaining 30%. After requiring two leptons of different flavour, the
leading backgrounds for this channel are t¯t and W t processes. Other major
com-ponents are Z → τ τ and W W production with two associated jets. Final states including W +jets and multijets may produce misidentified leptons, contaminating
the signal region. Other background sources include W Z/W γ∗ production and other
Higgs boson production and decay modes, especially ggF production.
(d) Same-sign 2` channel (figure 1(d)): the leading contribution consists of a process
in which a W boson radiates the Higgs boson, and then decays leptonically. The radiated Higgs boson decays to two W bosons, one decaying hadronically and the other, with the same charge as the first lepton, decaying leptonically. The final state
therefore contains two leptons with same charge, labelled as `1 and `2, two neutrinos
and two energetic jets. Significant backgrounds in this channel are W Z/W γ∗, W γ
and W +jets production; W W , Z+jets and top-quark processes also contribute to this
final state. Due to the overwhelming background from t¯t production, the selection
is not optimised for events in which the lepton from the Higgs boson decay and the lepton from the associated W boson have opposite charges.
All the channels described above are mutually exclusive due to the respective number of
leptons with transverse momentum, pT, greater than 15 GeV. To maximise the analysis
sensitivity to the V H(H→ W W∗) process in each of these decay modes, the data samples
for each topology, except for the opposite-sign 2` channel, are further subdivided into sev-eral signal regions (SRs). Additional kinematic regions, with orthogonal selection criteria, designated as control regions (CRs), are used to normalise the major backgrounds in each SR by extracting normalisation factors.
The final results are extracted from a fit that simultaneously considers all SRs and CRs. The 4` channel is split into two samples according to the number of same-flavour opposite-sign (SFOS) lepton pairs, namely 4`-2SFOS and 4`-1SFOS. The sample contain-ing two SFOS pairs suffers from a higher background contamination than the sample with one SFOS pair. The 3` analysis requires at least one opposite-charge lepton pair, therefore the 3` system must have total charge of ±1. This analysis separates events with three same-flavour (SF) leptons, one SFOS lepton pair and zero SFOS lepton pairs, which have different signal-to-background ratios. For the 3`-3SF and 3`-1SFOS channels a multivariate analysis
JHEP08(2015)137
is performed. The same-sign 2` sample is divided into two sub-channels with one or two se-lected jets in the final state, namely 2`-SS1jet and 2`-SS2jet. The channel with two leptons of different flavour and opposite sign is denoted by 2`-DFOS in the following sections.
3 The ATLAS detector
ATLAS [23] is a multi-purpose particle physics detector with a forward-backward
symmet-ric cylindsymmet-rical geometry1 and close to 4π coverage in solid angle. It consists of an inner
tracking detector (ID) surrounded by a thin 2 T superconducting solenoid, electromag-netic and hadronic calorimeters, and a muon spectrometer (MS) incorporating three large superconducting toroid magnets, each with eight coils.
The ID covers the pseudorapidity range |η| < 2.5 and consists of multiple layers of silicon pixel and microstrip detectors, and a straw-tube transition radiation tracker. The calorimeter system covers the pseudorapidity range |η| < 4.9. Within the region |η| < 3.2, electromagnetic calorimetry is provided by barrel and endcap high-granularity lead/liquid-argon (LAr) calorimeters. An additional thin LAr presampler covering |η| < 1.8 is used to correct for energy loss in the material upstream of the calorimeters. Hadronic calorime-try is provided by a steel/scintillator-tile calorimeter, covering |η| < 1.7, and two cop-per/LAr hadronic endcap calorimeters. The solid angle coverage is completed with for-ward copper/LAr and tungsten/LAr calorimeter modules optimised for electromagnetic and hadronic measurements, respectively. The MS consists of separate trigger and high-precision tracking chambers that measure the deflection of muons in the magnetic field generated by superconducting air-core toroids. The precision chamber system covers the region |η| < 2.7 with three stations of monitored drift-tube layers, except for the forward region where the innermost station is equipped with cathode strip chambers. The muon trigger system covers the range |η| < 2.4 with resistive plate chambers in the barrel and thin gap chambers in the endcap regions. A three-level trigger system is used. The first-level trigger is hardware-based, using a subset of the detector information, and reduces the event rate to less than 75 kHz. This is followed by two software-based trigger levels, which together reduce the event rate to about 400 Hz.
4 Data samples
The data were recorded using inclusive single-lepton and dilepton triggers. Overall quality criteria were applied in order to suppress non-collision backgrounds such as cosmic-ray
muons, beam-related backgrounds, or noise in the calorimeters. The datasets used in
the 8 TeV and 7 TeV analyses correspond to an integrated luminosity of 20.3 fb−1 and
4.5 fb−1 respectively. The analysis of the 2`-SS channel was performed only on the 8 TeV
1
ATLAS uses a right-handed coordinate system with its origin at the nominal interaction point (IP) in the centre of the detector and the z-axis along the beam pipe. The x-axis points from the IP to the centre of the LHC ring, and the y axis points upward. Cylindrical coordinates (r, φ) are used in the transverse plane, φ being the azimuthal angle around the beam pipe. The pseudorapidity is defined in terms of the polar angle θ as η = − ln tan(θ/2).
JHEP08(2015)137
data sample, due to the low sensitivity of this channel. The 8 TeV data were taken at
a higher instantaneous luminosity (L ' 7 × 1033 cm−2s−1) than that for the 7 TeV data
(L ' 3 × 1033cm−2s−1) and with a higher number (' 21 versus ' 9) of overlapping
proton-proton collisions, producing higher out-of-time and in-time pile-up [24]. The increased
pile-up rate, rather than the increased centre-of-mass energy, is the main reason for the differences between 8 TeV and 7 TeV analysis selections.
Table1lists the Monte Carlo (MC) generators used to model the signal and background
processes. For the Higgs production processes the production cross section multiplied by
the branching fraction of the H→ W W∗decay is shown, while for the background processes
the production cross section, including effects of cuts applied at the event generation, is
presented. The samples were simulated and normalised for a Higgs boson of mass mH =
125 GeV. The V H samples were simulated with Pythia and normalised to the
next-to-next-to-leading-order (NNLO) QCD calculations [21, 44–47] with additional
next-to-leading-order (NLO) electroweak (EW) corrections computed with Hawk [48] and applied
as a function of the transverse momentum of the associated vector boson. The gg → ZH samples were simulated with Powheg-Box1.0 interfaced with pythia8 and normalised
to the NNLO QCD calculations [45]. Associated Higgs boson production with a t¯t pair
(t¯tH) is simulated with Pythia8 and normalised to the NLO QCD estimation [21,44,45].
The matrix-element-level calculations are interfaced to generators that model the par-ton shower, the hadronisation and the underlying event, using either Pythia6, Pythia8,
Herwig with the underlying event modelled by Jimmy [49], or Sherpa. The CT10 parton
distribution function (PDF) set [50] is used for the Powheg-Box and Sherpa samples
while the CTEQ6L1 PDF set [51] is used for Alpgen and AcerMC samples. The Z/γ∗
sample is reweighted to the MRSTMCal [52] PDF set. The simulated samples are described
in detail in ref. [22] with a few exceptions that are reported in the following.
The Z/γ∗ processes associated with light- and heavy-flavour (HF) jets are modelled by
Alpgen+Herwig with merged leading-order (LO) calculations. The simulation includes processes with up to five additional partons in the matrix element, or three additional partons in processes with b- or c-quarks. An overlap-removal procedure is applied to avoid double counting of HF in the light-jet samples. The sum of the two samples is normalised to
the NNLO calculation of Dynnlo [53,54]. The t¯tW/Z and tZ backgrounds are simulated
using Madgraph at LO interfaced with Pythia6. The production of four leptons from
a pair of virtual Z or γ bosons, indicated by ZZ∗ in the following, contributes to the
background in the 3` channel when one low-pTlepton is not detected. Since this background
is more prominent when one lepton pair has a very low mass, a dedicated sample which
requires at least one SFOS pair with m``< 4 GeV, generated with Sherpa and normalised
to the NLO QCD cross section from the parton-level MC program MCFM [55], is included.
Production of triboson processes is a major source of background, in particular W W W∗
in the 3` channel and ZW W∗ in the 4` channel. They are modelled by Madgraph
interfaced with Pythia6 and normalised to the NLO cross section from ref. [56]. All
samples are processed using the full ATLAS detector simulation [57] based on Geant4 [58],
except for W H, W Z/W γ∗ with m`` > 7 GeV, qq/qg → W W , W W γ∗, t¯t and single
JHEP08(2015)137
Pro cess Generator σ (× Br) [pb] Cross-section normalisation Higgs b oson V H (H → W W ∗) Pythia [ 25 , 26 ] v8.165, v6.428 0.24, 0.20 NNLO QCD + NLO EW V H ( H → τ τ ) Pythia v8.165, v6.428 0.07, 0. 06 NNLO QCD + NLO EW g g → H (H → W W ∗) Po wheg-Bo x [ 27 – 30 ] v1.0 (r1655)+ Pythia v8.165, v6.428 4.1, 3.3 NNLO+NNLL QCD + NLO EW VBF (H → W W ∗) Po wheg-Bo x [ 31 ] v1.0 (r1655)+ Pythia v8.165, v6.428 0.34, 0.26 NNLO QCD + NLO EW t¯t H (H → W W ∗) Pythia v8.165 0.028, 0. 019 NLO Single b oson Z /γ ∗(→ `` )+jets (m `` > 10 Ge V ) Alpgen [ 32 ] v2.14 + Her wig [ 33 ] v6.52 16540, 12930 NNLO HF Z /γ ∗(→ `` )+jets (m `` > 30 Ge V ) Alpgen v2.14 + Her wig v6.52 126, 57 NNLO VBF Z /γ ∗(→ `` ) (m `` > 7 Ge V ) Sherp a [ 34 ] v1.4.1 5.3, 2.8 LO T op-quark t¯t Po wheg-Bo x [ 35 ] v1.0 (r2129)+ Pythia v6.428 250, 180 NNLO+NNLL MC@NLO [ 36 ] v4.03 t¯tW / Z MadGraph [ 37 ] v5.1.5.2, v5. 1.3.28 + Pythia v6.428 0.35, 0.25 LO tq b A cerMC [ 38 ] v3.8 + Pythia v6.428 88, 65 NNLL tb , tW Po wheg-Bo x [ 39 , 40 ] v1.0 (r2092)+ Pythia v6.428 28, 20 NNLL tZ MadGraph v5.1.5.2, v5.1.5.11 + Pythia v6.428 0.035, 0.025 LO Dib osons W Z /W γ ∗(→ ```ν )( m `` > 7 Ge V ) Po wheg-Bo x [ 41 ] v1.0 (r1508)+ Pythia v8.165, v6.428 12.7, 10.7 NLO W Z /W γ ∗(→ ```ν )(min. m`` < 7 Ge V ) Sherp a v1.4.1 12.2, 10.5 NLO other W Z Po wheg-Bo x [ 41 ] v1.0 (r1508) + Pythia v8.165 21.2, 17.2 NLO q ¯q /q g → Z (∗ )Z (∗ )(→ ````, ``ν ν ) (m `` > 4 Ge V ) Po wheg-Bo x [ 41 ] v1.0 (r1556) + Pythia v8.165, v6.428 1.24, 0.79 NLO q ¯q /q g → Z (∗ )Z (∗ )(→ ````, ``ν ν ) (min. m `` < 4 Ge V ) Sherp a v1.4.1 7.3, 5.9 NLO other q ¯q /q g → Z Z Po wheg-Bo x [ 41 ] v1.0 (r1556) + Pythia v8.165 6.9, 5.7 NLO g g → Z (∗ )Z (∗ ) gg2ZZ [ 42 ] v3.1.2 + Her wig v6.52 (8 T eV on ly) 0.59 LO q ¯q /q g → W W Po wheg-Bo x [ 41 ] v1.0 (r1556) + Pythia v6.428 54, 45 NLO Sherp a v1.4.1 (for 2 `-DF OS 8 T eV only) 54 NLO g g → W W gg2WW [ 43 ] v3.1. 2 + Her wig v6.52 1.9, 1.1 LO VBS W Z , Z Z (→ ````, ``ν ν ) (m `` > 7 Ge V ), W W Sherp a v1.4.1 1.2, 0.88 LO W γ (p γ T > 8 Ge V ) Alpgen v2.14 + Her wig v6.52 1140, 970 NLO Z γ (p γ T > 8 Ge V ) Sherp a v1.4.3 960, 810 NLO T rib osons W W W ∗, Z W W ∗,Z Z Z ∗,W W γ ∗ MadGraph v5.1.3.33, v5.1.5.10 + Pythia v6.428 0.44, 0.18 NLO T able 1. MC generators used to mo del the signal and bac kground pro cesses. The Higgs b oson samples are normalised using the pro duction cross section and the dec a y branc hing fraction computed for m H = 125 Ge V . The v alues re p orted for the V H (H → W W ∗) pro cess include the N NLO con tribution from the g g → Z H (H → W W ∗ ) pro cess. F or generators a n d cross sec ti ons, wherev er tw o comma-separated v alu e s are giv en, the first v alue refers to √ s = 8 T eV and the second to √ s = 7 T eV . Wh e n a single v alue is giv en, it refers to √ s = 8 T eV . The corresp onding cross section times branc hing fraction of the H → W W ∗ deca y , σ × Br, are sho wn for the Higgs pro duction pro cesses, while for bac kground pro cesses the pro duction cross section, including the effect of th e leptonic branc hing fraction, and the m `` and p γ T cuts, as sp e cifi e d in the “Pro cess” column, is prese n ted. ‘HF’ refers to hea vy-fla v our jet pro duction, and ‘VBS’ refers to v ector b os on scattering. When a lo w er cut on m `` is sp ecified, it is applied to all SF OS lepton pairs, while when an upp er cut is in dicated it is applied to the SF OS pair of lo w e st mass in the ev en t. F or the Sherp a1.1 Z ( ∗ )Z ( ∗ )sample a lo w er cut of 4 Ge V is applied, in addition, to the SF OS lepton pair of h igher mass. Cross sections are computed to differen t lev els of acc ur ac y (LO, NLO, NNLO or next-to-next-to-leading-logarithm, NNLL), as sp ecified b y the last column.JHEP08(2015)137
of the electromagnetic and hadronic calorimeters, and with Geant4 for other detector components. The events are reweighted to ensure that the distribution of pile-up observed in the data is correctly reproduced.
5 Event reconstruction and selection
5.1 Event reconstruction
The primary vertex of each event is selected as the vertex with the largest value ofP(pT)2,
where the sum is over all the tracks associated with that particular vertex. Furthermore,
it is required to have at least three tracks with pT> 400 MeV.
Muons are reconstructed in the region |η| < 2.5 by combining tracks reconstructed
in the MS and ID [60]. This analysis uses muon candidates referred to as “Chain 1, CB
muons” in ref. [60]. Electrons are identified within the region |η| < 2.47, except in the
transition region between barrel and endcap calorimeters (1.37 < |η| < 1.52), through the association of an ID track to a calorimeter cluster whose shower profile is consistent with
an electromagnetic shower [61]. Electron identification uses information from both the
calorimetric and tracking system. In the 7 TeV analysis a cut-based approach is adopted
while in the 8 TeV analysis a likelihood-based selection is also exploited as described in [62].
Following that reference, in the 4` and 3` channels, electrons with pT< 20 GeV are required
to satisfy the “very tight” likelihood requirement, while electrons with pT > 20 GeV are
required to satisfy the “loose” likelihood requirement. In the 2` channels, electrons with pT
< 25 GeV are required to satisfy the “very tight” likelihood requirement, while electrons
with pT > 25 GeV are required to satisfy the “medium” likelihood requirement.
Both a track-based and a calorimeter-based isolation selection are applied to leptons.
The isolation criteria are chosen to maximise the sensitivity to the V H(H→ W W∗) process
at mH = 125 GeV. The track-based isolation is built on the computation of the scalar sum
of the pTof tracks associated with the primary vertex and inside a cone, constructed around
the candidate lepton, of size ∆R = 0.22 and excluding the track of the candidate lepton.
The calorimeter-based isolation uses the scalar sum of the transverse energies measured within a cone of ∆R = 0.2, excluding the energy of the calorimeter cluster associated with the lepton itself. For the 8 TeV data the electron calorimeter-based isolation algorithm
uses topological clusters [62], while for the 7 TeV data it uses calorimeter cells. Cell-based
isolation is used for muons in the calorimeter in both the 8 TeV and 7 TeV analyses. The calorimeter and track isolation criteria differ between the 8 TeV and 7 TeV data samples and are not the same for all the channels. The upper bound of the calorimeter-based isolation
energy varies from 7% to 30% of the lepton pT, while the sum of the pT of the tracks in
the cone is required to be smaller than 4% to 12% of the lepton pT, where tighter cuts are
applied at low pT. Less stringent isolation criteria on energy and pT are required for the
7 TeV data sample, due to the lower level of pile-up compared to the 8 TeV data sample.
Jets are reconstructed from three-dimensional topological clusters [63] over the region
|η| < 4.5 using the anti-ktalgorithm [64] with radius parameter R = 0.4. Jets are required
JHEP08(2015)137
to have pT larger than 25 GeV except for the forward region, |η| > 2.4, in which the
threshold is raised to 30 GeV. In order to suppress the contamination of jets from pile-up,
the following selection is applied: the sum of the pT of all tracks within ∆R = 0.4 of the jet
axis and that of the subset of these associated with the primary vertex is computed. The ratio of the latter to the former is required to be larger than 0.5 (0.75) for the 8 (7) TeV
data samples, for all jets with pT < 50 GeV and |η| < 2.4.
The MV1 b-jet identification algorithm is used to tag jets containing a b-hadron [65].
For b-jets with |η| < 2.5 and pT > 20 (25) GeV in the 8 (7) TeV data analysis, the selection
has an efficiency of 85%, estimated using simulated t¯t events. It corresponds to a rejection
of a factor of 10 against jets originating from light quarks or gluons [66,67].
When two leptons are reconstructed within a cone of ∆R = 0.1, or a lepton and a jet are reconstructed within ∆R = 0.3, they are considered to be the same physical object and one of the two is removed. In the rare occurrence of an overlap between two leptons of the same
flavour, the higher-pTlepton is kept while the lower-pTlepton is discarded. The muon is
re-tained in the presence of an overlap with an electron, the electron is rere-tained in the presence of an overlap with a jet, and the jet is retained in the presence of an overlap with a muon. Two variables describing the missing transverse momentum are employed in this study: one is calorimeter-based and the other is track-based. The former, which benefits from the large rapidity coverage of the calorimeter and its sensitivity to neutral particles, is
referenced as EmissT [68]. The EmissT magnitude, ETmiss, is used in the analysis selection. The
quantity EmissT is calculated as the negative vector sum of the momenta of muons, electrons,
τ leptons, photons, jets and clusters of calorimeter cells that are not associated with these objects (the “soft term”). In the 8 TeV analysis, to suppress the pile-up effect, the ratio of
the scalar pT sum of all soft term tracks associated with the primary vertex to the scalar
pT sum of all soft term tracks from all vertices is employed. This ratio is used to scale
all soft-event contributions to ETmiss [69]. The track-based missing transverse momentum
measurement is used to reduce the effects of pile-up on the resolution of the
calorimeter-based variant [70]. It is calculated as the vector sum of the transverse momenta of tracks
with pT> 500 MeV that originate from the primary vertex. This quantity is called pmissT ,
and the analysis selections are applied to its magnitude, pmissT . In order to include neutral
components in the calculation of pmissT in final states with jets, the sum of track momenta
in jets is replaced by their energy measured in the calorimeter.
5.2 Event selection
Events are required to contain a primary vertex. The four channels are further split into
eight signal regions, designed to optimise the sensitivity to the V H(H→ W W∗) process,
with a specific set of selections applied to define each signal region. The selection criteria
rely on the number of leptons and their properties such as charge, flavour, pT, and on
the number of jets and b-tagged jets and on the magnitude of the missing transverse
momentum. Leptons with pT> 15 GeV are selected and their number is used to divide the
analysis in the various channels. Similarly the analysis channels are subdivided in categories according the number of selected jets. Of particular importance are the invariant masses and opening angles among the selected objects, most notably those of opposite-sign lepton
JHEP08(2015)137
pairs. The spin-0 property of the Higgs boson, in conjunction with the V -A structure of the weak interaction, results in a preference for a small opening angle of lepton pairs
from the H → W W∗ → `ν`ν decays. On the other hand, as described in section2, major
backgrounds often contain Z boson production or t¯t production which give rise to
opposite-sign lepton pairs with a large opening angle. In the 2`-SS channel, the lepton originating from the Higgs boson decay is selected by minimising the invariant mass of the lepton and jet(s); cuts are then applied to the opening angle between this lepton and the closest jet in the transverse plane. The definitions of the signal regions used for each channel are
summarised in table2 and further detailed in sections 5.2.1–5.2.4.
In all the 4` and 3` signal regions, events are recorded using inclusive single-lepton triggers, which are fully efficient for high lepton multiplicity signatures. For the 2` channels in 8 TeV data taking, dilepton triggers are also used. In all channels at least one lepton must match a candidate reconstructed at trigger level. This requires the leading lepton
in an event to have pT greater than 24 GeV in the 8 TeV data sample, and greater than
18 GeV and 20 GeV for muons and electrons respectively in the 7 TeV data sample. Single lepton trigger efficiencies are measured with respect to offline reconstructed leptons using leptonic Z decays. The measured values are approximately 95% for electrons, 90% for muons in the endcap and 70% for muons in the barrel.
5.2.1 Four-lepton channel
Events in the 4` channel are required to have exactly four leptons. The pT of leading and
sub-leading leptons must be above 25 GeV and 20 GeV, respectively, and the pT of each
of the remaining two leptons must exceed 15 GeV. The total charge of the four leptons is required to be zero. Only events with at least one SFOS lepton pair are accepted, and events are assigned to the 4`-2SFOS and 4`-1SFOS SRs according to the number of such pairs.
In order to select final states with neutrinos, ETmiss and pmissT are required to be above
20 GeV and above 15 GeV, respectively. In order to reduce the t¯tZ background, events
are vetoed if they contain more than one jet. Top-quark production is further suppressed
by vetoing events with any b-tagged jet with pT above 20 GeV. The invariant mass of `2
and `3, m`2`3, is required to satisfy |m`2`3 − mZ| < 10 GeV (where mZ is the mass of the
Z boson), and the invariant mass of `0 and `1, m`0`1, is required to be between 10 GeV
and 65 GeV. This requirement on m`0`1 greatly reduces the contamination from ZZ
(∗)
production in events with two pairs of SFOS leptons.
The sensitivity is improved by exploiting two additional variables. The variable ∆φboost`
0`1
denotes the difference in azimuthal angle between the two leptons from the Higgs boson
candidate in the frame where the Higgs boson’s pT is zero. The Higgs boson transverse
momentum is approximated with pHT ∼ −pZ
T− p
jet
T , or with pHT ∼ −pZT if no jet is present.
The angular separation ∆φboost`0`1 is required to be below 2.5 rad. The magnitude of the
vector sum of the lepton transverse momenta, pT4`, can discriminate against the main
background, ZZ(∗), which has no neutrinos. A cut requiring pT4` > 30 GeV is introduced
for the 4`-2SFOS SR. In this signal region the invariant mass of the four leptons is required
to be above 140 GeV to remove events from the H → ZZ∗ → 4` decay, which are the target
of another analysis [17]. In the signal extraction through the fit explained in section 8.4,
JHEP08(2015)137
Channel 4 ` 3 ` 2 ` Category 2SF OS 1SF OS 3SF 1SF OS 0SF OS DF OS SS2jet SS1jet T rigger single-lepton triggers single-lepton triggers single-lepton & dil e p ton triggers Num. of leptons 4 4 3 3 3 2 2 2 pT ,leptons [Ge V ] > 25 , 20 , 15 > 25 , 20 , 15 > 15 > 15 > 15 > 22 , 15 > 22 , 15 > 22 , 15 T otal lepton ch arge 0 0 ± 1 ± 1 ± 1 0 ± 2 ± 2 Num. of SF OS pairs 2 1 2 1 0 0 0 0 Num. of jets ≤ 1 ≤ 1 ≤ 1 ≤ 1 ≤ 1 ≥ 2 2 1 pT ,jets [Ge V ] > 25 (30) > 25 (30) > 25 (30) > 25 (30) > 25 (30) > 25 (30) > 25 (30) > 25 (30) Num. of b-tagged jets 0 0 0 0 0 0 0 0 E miss T [Ge V ] > 20 > 20 > 30 > 30 — > 20 > 50 > 45 p miss T [Ge V ] > 15 > 15 > 20 > 20 — — — — |m `` − mZ | [Ge V ] < 10 (m `2 `3 ) < 10 (m `2 `3 ) > 25 > 25 — — > 15 > 15 Min. m `` [Ge V ] > 10 (m `0 `1 ) > 10 (m `0 `1 ) > 12 > 12 > 6 > 10 > 12 (ee, µµ ) > 12 (ee, µµ ) > 10 (eµ ) > 10 (eµ ) Max. m `` [Ge V ] < 65 (m `0 `1 ) < 65 (m `0 `1 ) < 200 < 200 < 200 < 50 — — m 4 ` [Ge V ] > 140 — — — — — — — pT ,4 ` [Ge V ] > 30 — — — — — — — mτ τ [Ge V ] — — — — — < (m Z − 25) — — ∆ R` 0 `1 — — < 2 .0 < 2 .0 — — — — ∆ φ` 0 `1 [rad] < 2 .5 (∆ φ b o ost `0 `1 ) < 2 .5 (∆ φ b o ost `0 `1 ) — — — < 1 .8 — — m T [Ge V ] — — — — — < 125 — > 105 (m lead T ) Min. m` i j (j ) [Ge V ] — — — — — — < 115 < 70 Min. φ` i j [rad] — — — — — — < 1 .5 < 1 .5 ∆ yjj — — — — — < 1 .2 — — |m j j − 85 | [Ge V ] — — — — — < 15 — — T able 2. Definition of eac h signal region in this analysis. m lead T is the transv erse mass of the leading lepton and the E miss T (see section 5.2.4 for the definiti on of m lead T ). F or pT ,leptons in th e 4 ` channel the three v alues listed ab o v e refer to the leadi ng, sub-leading, and to the tw o remaining leptons, resp ectiv e ly . F or pT ,leptons in the 2 ` channel the tw o v alues listed ab o v e refer to the leading and sub-leading leptons, resp ectiv ely . F or pT ,jets the v alue in paren th e ses refers to forw ard jets (| η | > 2 .4).JHEP08(2015)137
5.2.2 Three-lepton channel
For the 3` channel, exactly three leptons with pT> 15 GeV are required with a total charge
of ±1. After this requirement, contributions from background processes that include more
than one misidentified lepton, such as W +jet production and inclusive b¯b pair production,
are negligible. Events are then separated into the 3`-3SF, 3`-1SFOS and 3`-0SFOS SRs, requiring three SF leptons, one SFOS lepton pair and zero SFOS lepton pairs, respectively.
In order to reduce the background from t¯t production, events are vetoed if they contain
more than one jet. The background from top-quark production is further suppressed by
vetoing events if they contain any b-tagged jet with pT > 20 GeV. In order to select final
states with neutrinos, Emiss
T is required to be above 30 GeV and pmissT above 20 GeV in the
3`-3SF and 3`-1SFOS SRs. In the 3`-0SFOS SR, ETmiss or pmissT selections are not imposed
because the main backgrounds also contain neutrinos. The invariant mass of all SFOS
pairs in the 3`-3SF and 3`-1SFOS SRs is required to satisfy |m``− mZ| > 25 GeV. This
requirement suppresses W Z and ZZ∗ events, and increases the Z+jets rejection.
A lower bound is set on the smallest invariant mass of pairs of oppositely charged leptons at 12 GeV in the 3`-3SF and 3`-1SFOS SRs, and at 6 GeV in the 3`-0SFOS SR. In addition, an upper bound on the invariant mass of oppositely charged leptons is set at 200 GeV in the three signal regions. These selections reject backgrounds from HF and
re-duce the number of combinatorial lepton pairs from the W Z/W γ∗process. The latter could
indeed give larger mass values with respect to the W H process since it can proceed through the t- and u-channels, in addition to the s-channel, which is also present in W H production.
The angular separation ∆R`0`1 is required to be smaller than 2 in the 3SF and
3`-1SFOS SRs. This cut favours the Higgs boson decay topology relative to that of W Z/W γ∗
events.
In the 3`-3SF and 3`-1SFOS SRs, the shape of a multivariate discriminant based
on a Boosted Decision Trees (BDT) [71], which produces a multivariate classifier (“BDT
Score”), is used to achieve a further separation between signal and background. The main purpose of the multivariate classifier is to distinguish between the signal and the dominant
W Z/W γ∗ and ZZ∗ backgrounds, and the BDT is trained against these two background
processes. The BDT parameters are chosen in order to ensure that there is no overtraining, i.e. that the BDT is robust against statistical fluctuations in the training samples. The BDT input discriminating variables which provide the best separation between signal and
background are the pT of each lepton, the magnitude of their vector sum, the invariant
masses of the two opposite-sign lepton pairs (m`0`1, m`0`2), ∆R`0`1, E
miss
T , and pmissT . In
the fit, the shape of the distribution of the “BDT Score”, divided into six bins, is used to extract the number of observed events in the 3`-3SF and 3`-1SFOS SRs, while the shape of
the distribution of ∆R`0`1, divided into four bins, is used to extract the number of observed
events in the 3`-0SFOS SR. In the other channels only the event yield in each signal and control region is used without shape information.
JHEP08(2015)137
5.2.3 Opposite-sign two-lepton channel
In the 2`-DFOS channel, exactly two leptons with pT larger than 22 GeV and 15 GeV
are required. Only opposite-sign eµ final states are considered in order to reduce the background from Z+jets, W Z and ZZ events. A cut on the invariant mass of the lepton
pair, m`0`1 > 10 GeV, is applied to reject combinatorial dilepton backgrounds. In order to
select final states with neutrinos, ETmiss is required to be above 20 GeV. These selections
reduce the background processes that contain jets faking leptons. The presence of at least
two jets with pT > 25 GeV is required. The background from top-quark production is
reduced by vetoing events if they contain any b-tagged jets with pT > 20 GeV. To reject
the Z+jets production that leads to eµ final states through Z → τ τ decay, a requirement
of mτ τ < (mZ−25 GeV) is applied, where mτ τ is the dilepton invariant mass reconstructed
using the collinear approximation [22], namely under the assumptions that the lepton pair
originates from τ lepton decays, the neutrinos are the only source of ETmiss and they are
collinear with the charged leptons.
Upper bounds on the invariant mass of the lepton pair, m`0`1 < 50 GeV, and the
azimuthal angular separation of the lepton pair, ∆φ`0`1 < 1.8 rad, are applied to enhance
the Higgs boson signal relative to the W W , t¯t and W +jets backgrounds. Requirements on
the rapidity separation between the two leading jets, ∆yjj < 1.2, and the invariant mass
of the two leading jets, |mjj− 85 GeV| < 15 GeV, are introduced to select jets from the
associated W/Z bosons. The central value of the mjj selection interval is larger than the
W boson mass in order to retain the acceptance for ZH production with Z → q ¯q decay.
The selection mT < 125 GeV is applied, where mT is the transverse mass of the
dilepton system and ETmiss, defined as mT =
q (ET``+ ETmiss)2− |p T``+ EmissT |2, where ET`` = q |pT``|2+ m2
``. The selections on ∆yjj and mjj make this channel orthogonal to
the ggF-enriched nj ≥ 2 category in ref. [22], while orthogonality with respect to the VBF
category is ensured by explicitly vetoing the BDT signal region of the VBF analysis [22].
In the fit the 2`-DFOS channel enters as a single signal region.
5.2.4 Same-sign two-lepton channel
In the 2`-SS channel, exactly two leptons with the same charge are required. Lower bounds
on lepton pT are set to 22 GeV and 15 GeV and both the same-flavour and different-flavour
combinations are considered. A lower bound on m`1`2 is applied at 12 GeV for
flavour lepton pairs and at 10 GeV for different-flavour lepton pairs. Despite the same-charge requirement, a wrong-same-charge assignment may allow background contributions from
Z boson decays. Therefore a veto on same-flavour lepton pairs with |m`1`2− mZ| < 15 GeV
is introduced.
The 2`-SS2jet and 2`-SS1jet SRs require the number of jets to be exactly two or exactly
one, respectively. Events with b-tagged jets having pT > 20 GeV are discarded. The ETmiss
is required to be larger than 50 GeV in the 2`-SS2jet SR and larger than 45 GeV in the 2`-SS1jet SR. Additional cuts are applied to events in the 2`-SS2jet and 2`-SS1jet SRs, on
the following variables (see table2for details): the minimum invariant mass of a lepton and
the jet(s) in the event, mmin`
ij (m
min
JHEP08(2015)137
minimises the above variable and a jet, ∆φmin`
ij ; the transverse mass of the leading lepton
and the EmissT , mleadT =q2 × pT,lead× ETmiss× (1 − cos(φlead− φEmiss
T )), where pT,lead and
φlead are respectively the transverse momentum and φ angle of the leading lepton. Lower
values of mmin
`ij (m
min
`ijj) and of ∆φ
min
`ij favour Higgs boson decays relative to the major
backgrounds. High values of mleadT help in reducing W +jets background. The pTthreshold
for the sub-leading muon in the µµ channel is increased to 20 GeV in both the SRs to suppress misidentified muons from W +jets and multijet production.
In the fit, the 2`-SS2jet and 2`-SS1jet SRs are further split into four signal regions according to the combination of lepton flavours in each event: ee, eµ, µe and µµ, where eµ
refers to the case in which the electron has leading pT while µe refers to the case in which
the muon has leading pT. This splitting is motivated by the expected differences in the
background contributions, for example W γ, which is expected to be zero in the µµ channel but not in the other channels.
5.2.5 Signal acceptance
The number of expected V H(H→ W W∗) events surviving the event selections is presented
for each channel in table3. The total acceptance for W H(H → W W∗ → `ν`ν), W H(H →
W W∗ → `νqq) and ZH(H → W W∗ → `ν`ν) is 3.7%, 0.3% and 1.9%, respectively. The
analysis acceptance for the ZH(H → W W∗ → `νqq) process is negligible. The acceptance
is defined as the ratio of the number of events in the SRs to the number of events expected according to the branching fractions for the various processes. Associated Higgs boson production followed by the decay H → τ τ cannot be completely isolated from the selected
final states. Therefore the results presented in this paper, with the exception of section8.5
for consistency of the analysed model, include this process as part of the background, with
the production cross section (σV H) and Br(H → τ τ ) fixed to the SM value.
6 Background modelling
The background contamination in the signal regions results from various physics processes, each modelled by one of the following methods:
• Pure MC prediction: rates and differential distributions (shapes) are extracted from
simulation and normalised to the cross sections in table 1;
• MC prediction normalised to data: rates are extracted from data in control regions but shapes are extracted from simulation;
• Pure data-driven prediction: rates and shapes are extracted from data.
Misidentified-lepton backgrounds (W +jets, multijets) in the 2` channels are estimated by using a purely data-driven method, which utilises the rate at which a jet is misidentified
as a lepton [22]. Table 4 summarises the method adopted for each process in each signal
region. The labels “MC” and “Data” represent the pure MC prediction and the pure data-driven estimation. For backgrounds modelled by simulation with a normalisation factor
JHEP08(2015)137
(a) 8 TeV data sample
Channel 4` 3` 2`
Category 2SFOS 1SFOS 3SF 1SFOS 0SFOS DFOS SS2jet SS1jet
W H (H → W W∗) — — 0.56 1.4 1.3 1.5 1.0 1.8
ZH (H → W W∗) 0.21 0.24 0.17 0.18 0.15 0.67 0.02 0.19
V H (H → W W∗) 0.21 0.24 0.73 1.6 1.4 2.2 1.0 2.0
(all categories) 9.4
(b) 7 TeV data sample
W H (H → W W∗) — — 0.12 0.29 0.26 0.21
ZH (H → W W∗) 0.023 0.021 0.013 0.033 0.028 0.075
V H (H → W W∗) 0.023 0.021 0.13 0.32 0.29 0.29
(all categories) 1.1
Table 3. Number of expected V H(H→ W W∗) events in the signal regions, for mH= 125 GeV, in
the (a) 8 TeV and (b) 7 TeV data samples.
(NF) computed using data, the names of relevant control regions are shown as defined in
tables5and6. The ratio of t¯t yields to tW yields is found to be compatible between all the
CRs and associated SRs, thus only one NF is computed per CR for the “Top” category. The ggF and VBF productions of Higgs bosons are treated as background as discussed in
section 8.4.
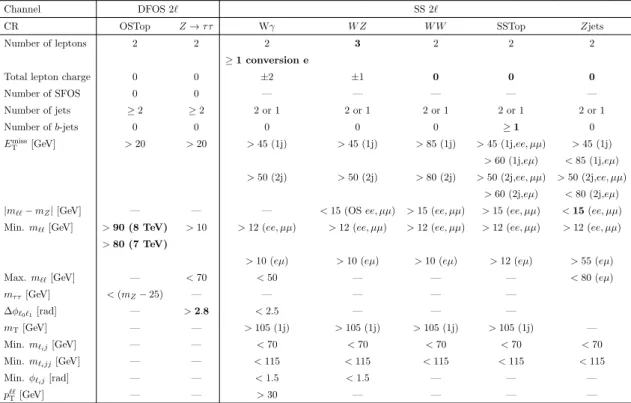
Definitions of control regions in the 4` and 3` analyses are presented in table 5, and
those defined in the 2` analyses are shown in table6. The CRs are made orthogonal to the
corresponding SRs by inverting some selections with respect to the SR definitions. Such se-lections are in boldface font in the tables and are further explained in the following sections.
6.1 Background in the four-lepton channel
The main backgrounds that contribute to the 4`-2SFOS and 4`-1SFOS SRs are diboson
processes, dominated by ZZ∗ with ETmiss from Z → τ τ decay, and triboson processes, in
particular ZW W∗, which has the same signature as the signal. These processes respectively
account for about 85% and 15% of the total background contamination. To normalise ZZ∗a
dedicated CR, the 4`-ZZ CR, is defined by inverting the requirement on the invariant mass of dileptons from the Higgs boson candidate. All the other minor background processes,
listed in table 4, are modelled by simulation.
6.2 Background in the three-lepton channel
Three classes of backgrounds contribute to the 3` channel. The first class comprises diboson
processes: W Z/W γ∗, ZZ∗ with an undetected lepton mainly due to its low-pT, and Zγ,
in which the photon converts to electron-positron pairs. The ZZ∗ contribution in this
JHEP08(2015)137
Channel 4` 3` 2`
Category 2SFOS, 1SFOS 3SF, 1SFOS, 0SFOS DFOS SS2jet, SS1jet
Process V V V MC MC MC MC W Z/W γ∗ — 3`-W Z CR, 3`-Zjets CR MC 2`-W Z CR ZZ∗ 4`-ZZ CR 3`-ZZ CR, 3`-Zjets CR MC MC OS W W — MC MC 2`-W W CR SS W W — MC — MC W γ — — — 2`-W γ CR Zγ — 3`-Zγ CR MC MC Z/γ∗ — 3`-Zjets CR, 3`-ZZ CR 2`-Zτ τ CR 2`-Zjets CR
W +jets — — Data Data
Multijets — — Data Data
Top MC 3`-Top CR 2`-OSTop CR 2`-SSTop CR
Table 4. Summary of background modelling.“V V V ” represents the triboson processes W W W∗, ZW W∗, ZZZ∗ and W W γ∗. “Top” processes include t¯t and single-top production dominated by tW with W → `ν decay, as well as t¯tW/Z. Some backgrounds are normalised by rescaling the MC yields by the data-to-MC ratio measured in CRs. For these backgrounds the names of the most important CRs are listed. The symbol “—” denotes a negligible contribution to the total background in the signal region.
Channel 4` 3`
CR ZZ W Z ZZ Zjets Top Zγ
Number of leptons 4 3 3 3 3 3
Total lepton charge 0 ±1 ±1 ±1 ±1 ±1
Number of SFOS 2 2 or 1 2 or 1 2 or 1 2 or 1 2 or 1
(eeµ or µµµ) (µµe or eee)
Number of jets ≤ 1 ≤ 1 ≤ 1 ≤ 1 ≥ 1 ≤ 1
Number of b-jets 0 0 0 0 ≥ 1 0
Emiss
T (and/or) p
miss
T [GeV] — > 30 and > 20 < 30 or < 20 < 30 and < 20 > 30 and > 20 < 30 or < 20
|m``− mZ| [GeV] < 10(m`2`3) < 25 — < 25 > 25 —
|m```− mZ| [GeV] — — < 15 > 15 — < 15
Min. m``[GeV] > 65(m`0`1) > 12 > 12 > 12 > 12 > 12
Max. m``[GeV] — < 200 < 200 < 200 — < 200
∆R`0`1 — < 2.0 < 2.0 < 2.0 — < 2.0
Table 5. Definition of control regions in the 4` and 3` analyses. Selections indicated in boldface font are designed to retain the CR orthogonal to the relevant SR.
JHEP08(2015)137
Channel DFOS 2` SS 2`
CR OSTop Z → τ τ Wγ W Z W W SSTop Zjets
Number of leptons 2 2 2 3 2 2 2
≥ 1 conversion e
Total lepton charge 0 0 ±2 ±1 0 0 0
Number of SFOS 0 0 — — — — — Number of jets ≥ 2 ≥ 2 2 or 1 2 or 1 2 or 1 2 or 1 2 or 1 Number of b-jets 0 0 0 0 0 ≥ 1 0 Emiss T [GeV] > 20 > 20 > 45 (1j) > 45 (1j) > 85 (1j) > 45 (1j,ee, µµ) > 45 (1j) > 60 (1j,eµ) < 85 (1j,eµ) > 50 (2j) > 50 (2j) > 80 (2j) > 50 (2j,ee, µµ) > 50 (2j,ee, µµ) > 60 (2j,eµ) < 80 (2j,eµ)
|m``− mZ| [GeV] — — — < 15 (OS ee, µµ) > 15 (ee, µµ) > 15 (ee, µµ) < 15 (ee, µµ)
Min. m``[GeV] > 90 (8 TeV) > 10 > 12 (ee, µµ) > 12 (ee, µµ) > 12 (ee, µµ) > 12 (ee, µµ) > 12 (ee, µµ)
> 80 (7 TeV)
> 10 (eµ) > 10 (eµ) > 10 (eµ) > 12 (eµ) > 55 (eµ)
Max. m``[GeV] — < 70 < 50 — — — < 80 (eµ)
mτ τ[GeV] < (mZ− 25) — — — — — ∆φ`0`1[rad] — > 2.8 < 2.5 — — — mT[GeV] — — > 105 (1j) > 105 (1j) > 105 (1j) > 105 (1j) — Min. m`ij[GeV] — — < 70 < 70 < 70 < 70 < 70 Min. m`ijj[GeV] — — < 115 < 115 < 115 < 115 < 115 Min. φ`ij[rad] — — < 1.5 < 1.5 — — — p`` T[GeV] — — > 30 — — — —
Table 6. Definition of control regions in the 2` analyses. Selections indicated in boldface font are designed to keep the CR orthogonal to the relevant SR.
mass is just below the Z boson mass. The second class includes triboson processes, mainly
W W W∗. The last class of backgrounds are processes with a misidentified lepton, mainly
Z+jets and top-quark pair production.
In the 3`-3SF and 3`-1SFOS SRs, W Z/W γ∗and ZZ∗represent the leading background
contributions accounting for about 80% of the total background yields, with 65% from
W Z/W γ∗ and 15% from ZZ∗. Production of Zγ, V V V , Z+jets and top-quarks share the
remaining background fraction equally. The 3`-0SFOS SR contains contributions of similar
size from W Z/W γ∗, V V V and top-quark production. In this SR the total background
event yield is about eight times lower than in the 3`-3SF and 3`-1SFOS SRs.
A 3`-W Z CR is defined by reversing the Z-veto requirement, in order to select events
with a Z boson decay. The 3`-ZZ CR and 3`-Zγ CR are defined by requiring low ETmiss
values to reflect the absence of final-state neutrinos in the background process under study. For these control regions, the invariant mass of the three leptons must be consistent with the Z boson mass. These regions are further distinguished according to the flavour combination of the three leptons, namely eee or µµe for the 3`-Zγ CR, and µµµ or eeµ for the 3`-ZZ CR.
The 3`-Zjets CR is defined by reversing the ETmiss and the Z-veto selections. The
properties of misidentified electrons and muons are different; therefore the 3`-Zjets CR is further split into the electron component (eee+µµe events) and misidentified-muon component (µµµ + eeµ events) and an NF is assigned to each component. In the 7 TeV data sample, the predicted Z+jets event yield with misidentified muons in the 3` SRs is negligible. Furthermore, the number of events in the 3`-Zjets CR with such a lepton
JHEP08(2015)137
flavour combination is too small to reliably extract the NF. Therefore the estimation of the misidentified-muon component is taken directly from simulation.
The 3`-Top CR is defined by requiring at least one b-tagged jet. The Z+jets contri-bution is difficult to isolate from other processes that include Z bosons. Thus the NF for this process is constrained not only by the 3`-Zjets CR, but also in part by the 3`-W Z CR
and the 3`-ZZ CR, as indicated in table4.
6.3 Background in the opposite-sign two-lepton channel
The dominant background in this channel is top-quark production, which accounts for about 50% of the total contamination. The 2`-OSTop CR is defined by requiring a high invariant mass of the lepton pair in the final state. As the b-jet rejection criteria are the same in the CR and SR, the systematic uncertainties related to b-tagging largely cancel between the two regions. The second dominant background is Z → τ τ , which accounts for 20% of the total background in the SR. A dedicated control region, 2`-Zτ τ CR, is defined by requiring a large opening angle between the two leptons. The W W process constitutes the third largest background, accounting for 10% of the total. Due to a difficulty in separating
this process from t¯t events over a wide kinematic region, no dedicated CR is defined, and
this process is modelled purely by MC simulation.
The contribution of backgrounds with misidentified leptons, W +jets and multijet, accounts for 10% of the total background. The misidentified-lepton background rate has an uncertainty of 40%. Due to this large uncertainty, the misidentified-lepton background
contributes significantly to this channel. The W Z/W γ∗production and the ggF production
followed by H→ W W∗ decay, each representing 5% of the total background, are modelled
with MC simulation.
6.4 Background in the same-sign two-lepton channel
The W Z/W γ∗ and W +jets processes each account for one third of the total background.
Some of the W Z/W γ∗events with three leptons enter the selection when one of the leptons
escapes detection. To normalise this process, the 2`-W Z CR is defined by selecting events with three leptons. The contamination from W +jets events with one misidentified lepton is estimated by using the same data-driven method used in the 2`-DFOS channel.
The remaining background processes contribute at the 10% level or less. The nor-malisation of W γ is based on the 2`-W γ CR, defined by requiring at least one electron consistent with a conversion, including a requirement that the electron does not have a hit in the innermost pixel layer. The background contribution to the 2`-SS channel due to lepton charge misidentification, in otherwise charge-symmetric processes, is found to be relevant only for electrons and affects top-quark production, opposite-sign W W and Z+jets. It represents 10% of the total background in the 2`-SS1jet SR and 3% of the total background in the 2`-SS2jet SR. The 2`-SSTop CR, 2`-W W CR and 2`-Zjets CR are defined selecting opposite-sign leptons to normalise these contributions. Moreover, in 2`-SSTop CR at least one b-tagged jet is selected. Due to the small production rate, no control region is defined to normalise the W W events from vector boson scattering with same charge, whose rate is taken directly from simulation.
JHEP08(2015)137
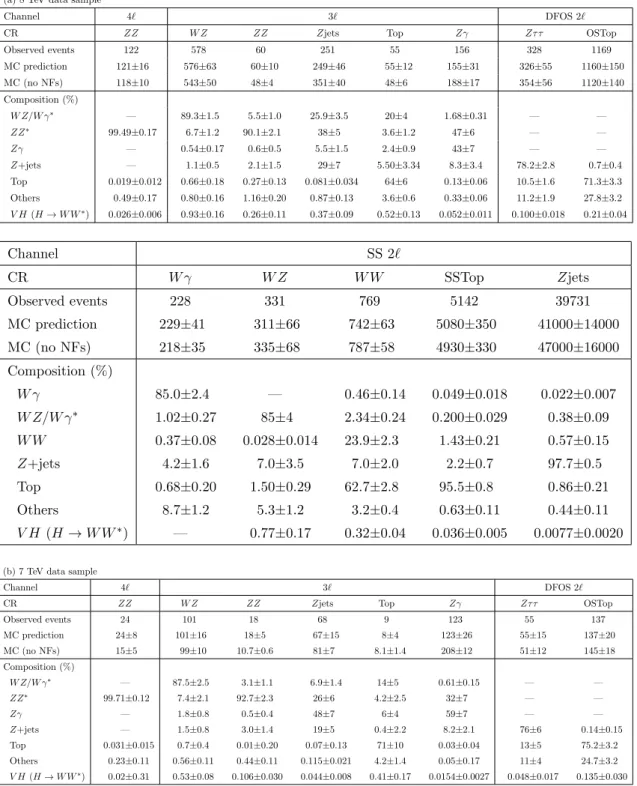
(a) 8 TeV data sample
Channel 4` 3` 2`
Category 2SFOS, 1SFOS 3SF, 1SFOS, 0SFOS DFOS SS2jet, SS1jet
Process W Z/W γ∗ — 1.08+0.08−0.06 — 0.94 ± 0.10 ZZ∗ 1.03+0.11−0.10 1.28+0.22−0.20 — — OS W W — — — 0.80 ± 0.33 W γ — — — 1.06 ± 0.12 Zγ — 0.62+0.15−0.14 — — Z/γ∗ — 0.80+0.68−0.53 (µ-misid) 0.90+0.18−0.16 0.86 ± 0.30 0.33+0.12−0.11 (e-misid) Top — 1.36+0.34−0.30 1.05+0.16−0.14 1.04 ± 0.08
(b) 7 TeV data sample Process W Z/W γ∗ — 1.02+0.12−0.11 — ZZ∗ 1.59+0.36−0.31 1.78+0.51−0.42 — OS W W — — — W γ — — — Zγ — 0.45+0.09−0.09 — Z/γ∗ — 0.68+0.16−0.15 (e-misid) 1.11+0.38−0.34 Top — 1.25+0.66−0.52 0.93+0.16−0.14
Table 7. Summary of background normalisation factors in the (a) 8 TeV and (b) 7 TeV data samples. The uncertainties include both the statistical and systematic components (see section7). “—” denotes that the background process, when considered, is normalised by MC simulation.
JHEP08(2015)137
(a) 8 TeV data sample
Channel 4` 3` DFOS 2`
CR ZZ W Z ZZ Zjets Top Zγ Zτ τ OSTop
Observed events 122 578 60 251 55 156 328 1169 MC prediction 121±16 576±63 60±10 249±46 55±12 155±31 326±55 1160±150 MC (no NFs) 118±10 543±50 48±4 351±40 48±6 188±17 354±56 1120±140 Composition (%) W Z/W γ∗ — 89.3±1.5 5.5±1.0 25.9±3.5 20±4 1.68±0.31 — — ZZ∗ 99.49±0.17 6.7±1.2 90.1±2.1 38±5 3.6±1.2 47±6 — — Zγ — 0.54±0.17 0.6±0.5 5.5±1.5 2.4±0.9 43±7 — — Z+jets — 1.1±0.5 2.1±1.5 29±7 5.50±3.34 8.3±3.4 78.2±2.8 0.7±0.4 Top 0.019±0.012 0.66±0.18 0.27±0.13 0.081±0.034 64±6 0.13±0.06 10.5±1.6 71.3±3.3 Others 0.49±0.17 0.80±0.16 1.16±0.20 0.87±0.13 3.6±0.6 0.33±0.06 11.2±1.9 27.8±3.2 V H (H → W W∗) 0.026±0.006 0.93±0.16 0.26±0.11 0.37±0.09 0.52±0.13 0.052±0.011 0.100±0.018 0.21±0.04 Channel SS 2` CR W γ W Z W W SSTop Zjets Observed events 228 331 769 5142 39731 MC prediction 229±41 311±66 742±63 5080±350 41000±14000 MC (no NFs) 218±35 335±68 787±58 4930±330 47000±16000 Composition (%) W γ 85.0±2.4 — 0.46±0.14 0.049±0.018 0.022±0.007 W Z/W γ∗ 1.02±0.27 85±4 2.34±0.24 0.200±0.029 0.38±0.09 W W 0.37±0.08 0.028±0.014 23.9±2.3 1.43±0.21 0.57±0.15 Z+jets 4.2±1.6 7.0±3.5 7.0±2.0 2.2±0.7 97.7±0.5 Top 0.68±0.20 1.50±0.29 62.7±2.8 95.5±0.8 0.86±0.21 Others 8.7±1.2 5.3±1.2 3.2±0.4 0.63±0.11 0.44±0.11 V H (H → W W∗) — 0.77±0.17 0.32±0.04 0.036±0.005 0.0077±0.0020
(b) 7 TeV data sample
Channel 4` 3` DFOS 2`
CR ZZ W Z ZZ Zjets Top Zγ Zτ τ OSTop
Observed events 24 101 18 68 9 123 55 137 MC prediction 24±8 101±16 18±5 67±15 8±4 123±26 55±15 137±20 MC (no NFs) 15±5 99±10 10.7±0.6 81±7 8.1±1.4 208±12 51±12 145±18 Composition (%) W Z/W γ∗ — 87.5±2.5 3.1±1.1 6.9±1.4 14±5 0.61±0.15 — — ZZ∗ 99.71±0.12 7.4±2.1 92.7±2.3 26±6 4.2±2.5 32±7 — — Zγ — 1.8±0.8 0.5±0.4 48±7 6±4 59±7 — — Z+jets — 1.5±0.8 3.0±1.4 19±5 0.4±2.2 8.2±2.1 76±6 0.14±0.15 Top 0.031±0.015 0.7±0.4 0.01±0.20 0.07±0.13 71±10 0.03±0.04 13±5 75.2±3.2 Others 0.23±0.11 0.56±0.11 0.44±0.11 0.115±0.021 4.2±1.4 0.05±0.17 11±4 24.7±3.2 V H (H → W W∗) 0.02±0.31 0.53±0.08 0.106±0.030 0.044±0.008 0.41±0.17 0.0154±0.0027 0.048±0.017 0.135±0.030
Table 8. Number of observed and predicted events and background composition in the CRs for the 4`, 3` and 2` channels in the (a) 8 TeV and (b) 7 TeV data samples. Normalisation factors are taken into account in the calculation of the composition. The uncertainties on event yields include both the statistical and systematic components (see section7).
JHEP08(2015)137
[GeV] 2 l , 0 l m 40 60 80 100 120 140 160 180 200 Events / 10 GeV 50 100 150 200 250 300 Data Bkg. Uncert. ) WW* → H ( VH WZ/Wγ* * ZZ Z/γ* Others Top γ Z ATLAS -1 = 8 TeV, 20.3 fb s CR) WZ 3-leptons ( (a) [GeV] 2 l , 0 l m 20 30 40 50 60 70 80 90 100 Events / 10 GeV 5 10 15 20 25 30 35 40 Data Bkg. Uncert. ) WW* → H ( VH ZZ* * γ WZ/W Z/γ* Others Zγ Top ATLAS -1 = 8 TeV, 20.3 fb s CR) ZZ 3-leptons ( (b) [GeV] 2 l , 0 l m 20 40 60 80 100 120 140 160 180 200 Events / 10 GeV 20 40 60 80 100 120 140 160 180 Data Bkg. Uncert. ) WW* → H ( VH ZZ* * γ / Z WZ/Wγ* γ Z Others Top ATLAS -1 = 8 TeV, 20.3 fb s jets CR) Z 3-leptons ( (c) [GeV] 2 l , 0 l m 0 20 40 60 80 100 120 140 160 180 200 220 240 Events / 12 GeV 2 4 6 8 10 12 14 16 18 20 22 Data Bkg. Uncert. ) WW* → H ( VH Top * γ WZ/W Z/γ* Others ZZ* γ Z ATLAS -1 = 8 TeV, 20.3 fb s 3-leptons (Top CR) (d) [GeV] 2 l , 0 l m 20 30 40 50 60 70 80 90 100 Events / 10 GeV 20 40 60 80 100 Data Bkg. Uncert. ) WW* → H ( VH ZZ* γ Z Z/γ* * γ WZ/W Others Top ATLAS -1 = 8 TeV, 20.3 fb s CR) γ Z 3-leptons ( (e)Figure 2. Distributions of the invariant mass of leptons `0 and `2, defined in secton2, in the five
CRs defined in the 3` channel: (a) 3`-W Z CR, (b) 3`-ZZ CR, (c) 3`-Zjets CR, (d) 3`-Top CR and (e) 3`-Zγ CR. Data (points) are compared to the background plus V H(H→ W W∗) (mH=125 GeV)
signal expectation (stacked filled histograms), where the background contributions are normalised by applying the normalisation factors shown in table7. The hatched area on the histogram represents total uncertainty, both statistical and systematic (see section7), on the total background estimate. The last bin includes overflows.
JHEP08(2015)137
[GeV] l 4 m 100 150 200 250 300 350 400 450 500 550 600 Events / 50 GeV -2 10 -1 10 1 10 2 10 3 10 Data Bkg. Uncert. *) WW → H ( VH ZZ* Others ATLAS -1 = 8 TeV, 20.3 fb s CR) ZZ 4-lepton (Figure 3. Distribution of the 4-lepton invariant mass m4` in the 4`-ZZ CR control region. Data
(points) are compared to the background plus V H(H→ W W∗) (mH=125 GeV) signal expectation
(stacked filled histograms), where ZZ∗ events are normalised by applying the normalisation factor shown in table 7. The hatched area on the histogram represents total uncertainty, both statistical and systematic (see section 7), on the total background estimate. The last bin includes overflows.
jj y ∆ 0 0.5 1 1.5 2 2.5 3 3.5 4 4.5 5 Events / 0.33 50 100 150 200 250 300 ATLAS -1 = 8 TeV, 20.3 fb s
DFOS 2-lepton (OSTop CR)
Data Bkg. Uncert. *) WW → H ( VH Top Others Z/γ* (a) jj y ∆ 0 0.5 1 1.5 2 2.5 3 3.5 4 4.5 5 Events / 0.33 10 20 30 40 50 60 70 80 ATLAS -1 = 8 TeV, 20.3 fb s CR) τ τ Z DFOS 2-lepton ( Data Bkg. Uncert. *) WW → H ( VH Z/γ* Others Top (b)
Figure 4. Distributions of the difference in rapidity between the two leading jets ∆yjj (a) in
the 2`-OSTop CR and (b) in the 2`-Zτ τ CR. Data (points) are compared to the background plus V H(H→ W W∗) (mH=125 GeV) signal expectation (stacked filled histograms), where the
background contributions are normalised by applying the normalisation factors shown in table 7. The hatched area on the histogram represents total uncertainty, both statistical and systematic (see section7), on the total background estimate. The last bin includes overflows.
6.5 Normalisation factors and composition of control regions
NFs are computed through the signal extraction fit explained in section 8.4. Table 4 lists
the main background processes, along with the CRs that contribute to the determination of their NFs. The NFs, which are specific to each signal region, are fitted taking into account only the total number of expected and observed events in each CR, separately for the 8 TeV
and 7 TeV data samples, and are summarised in table 7. The numbers of observed and
expected events from simulation in the 8 TeV and 7 TeV data analysis are summarised in
JHEP08(2015)137
[rad] 2 l , 1 l φ ∆ 0 0.5 1 1.5 2 2.5 3 Events / 0.2 rad 10 20 30 40 50 60 70 80 90 ATLAS -1 = 8 TeV, 20.3 fb s CR) γ W SS 2-lepton ( Data Bkg. Uncert. *) WW → H ( VH Wγ Others Z/γ* * γ WZ/W Top WW (a) [GeV] lead lep T p 0 50 100 150 200 250 300 Events / 20 GeV 20 40 60 80 100 120 140 160 ATLAS -1 = 8 TeV, 20.3 fb s CR) WZ SS 2-lepton ( Data Bkg. Uncert. *) WW → H ( VH WZ/Wγ* * γ / Z Others Top WW γ W (b) [GeV] T m 50 100 150 200 250 300 350 400 Events / 15 GeV 20 40 60 80 100 120 140 160 180 ATLAS -1 = 8 TeV, 20.3 fb s CR) WW SS 2-lepton ( Data Bkg. Uncert. *) WW → H ( VH Top WW Z/γ* Others WZ/Wγ* γ W (c) [GeV] T miss E 0 20 40 60 80 100 120 140 160 180 200 Events / 10 GeV 200 400 600 800 1000 1200 ATLAS -1 = 8 TeV, 20.3 fb s SS 2-lepton (SSTop CR) Data Bkg. Uncert. *) WW → H ( VH Top * γ / Z WW Others WZ/Wγ* γ W (d) [rad] 2 l , 1 l φ ∆ 0 0.5 1 1.5 2 2.5 3 Events / 0.2 rad 2000 4000 6000 8000 10000 12000 14000 16000 18000 ATLAS -1 = 8 TeV, 20.3 fb s jets CR) Z SS 2-lepton ( Data Bkg. Uncert. *) WW → H ( VH Z/γ* Top WW Others WZ/Wγ* γ W (e)Figure 5. Distribution of relevant variables in the control regions in the 2`-SS channel: (a) az-imuthal angle between the two leptons ∆φ`1`2 in the 2`-W γ CR, (b) transverse momentum of the
leading lepton in the 2`-W Z CR, (c) transverse mass mTin the 2`-W W CR, (d) missing transverse
momentum Emiss
T in the 2`-SSTop CR and (e) ∆φ`1`2, in the 2`-Zjets CR. Data (points) are
com-pared to the background plus V H(H→ W W∗) (mH=125 GeV) signal expectation (stacked filled
his-tograms), where the background contributions are normalised by applying the normalisation factors shown in table 7. The hatched area on the histogram represents total uncertainty, both statistical and systematic (see section 7), on the total background estimate. The last bin includes overflows.
JHEP08(2015)137
Background spectra and the expected composition of the CRs in 8 TeV collisions are
shown in figures2–5. The V H(H→ W W∗) component is shown on top of the background
to demonstrate that there is no significant signal leakage in the CRs. The exact amount of
signal leakage in each CR is presented in table8.
In these tables and figures, each background process normalised using CRs is presented separately, while backgrounds that are not normalised using CRs are grouped together as “Others”. The ggF and VBF production of Higgs bosons, and the V H(H → τ τ ) process
are included in the “Others” category, assuming mH = 125 GeV and the SM value for the
cross sections and for the branching fraction.
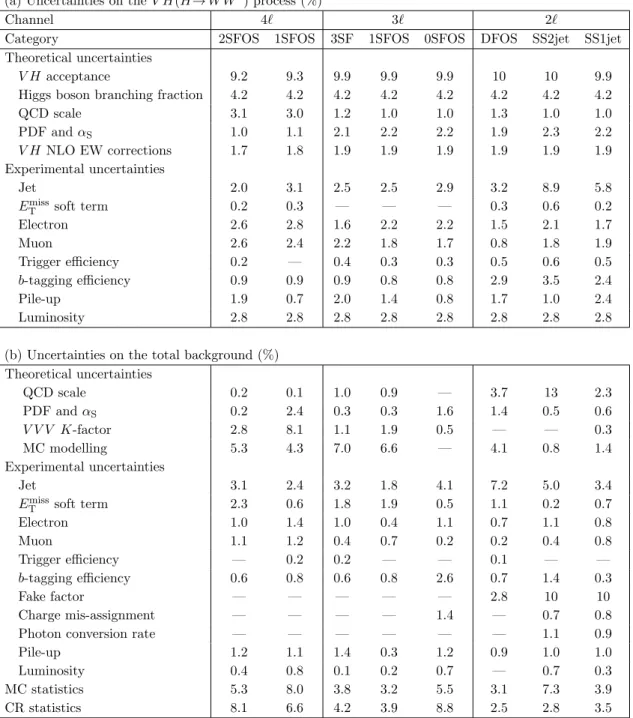
7 Systematic uncertainties
The sources of theoretical and experimental systematic uncertainty on the signal and
back-ground are described in this section, and summarised in table 9. The table shows the
un-certainties on the estimated event yield after the fit in 8 TeV data samples. Similar values are obtained for the 7 TeV data analysis.
Systematic uncertainties have an impact on the estimates of the signal and background event yields in the SRs and CRs. The experimental uncertainties are applied to both the SRs and CRs. The extrapolation parameter from a SR to a CR is defined as the ratio of MC estimates in the SR and CR. The theoretical uncertainties are computed on the extrapolation parameters, and applied to SRs. Correlations between SRs and CRs are taken into account in the fit, and cancellation effects are expected for uncertainties correlated between SRs and CRs. The different uncertainty sources are treated according to their correlations across the data taking periods, among different analyses, between signal and background sources. Whenever an effect is expected to affect coherently the event yields in two event samples (SRs and/or CRs), for instance the muon reconstruction efficiency for both signal and background, a 100% correlation is assumed and the yields are varied coherently in the fit through the introduction of a single parameter (nuisance parameter). Alternatively when an uncertainty source is not expected to affect the event yields coherently, for instance trigger and luminosity uncertainties across different data taking years, different nuisance parameters are introduced to represent uncorrelated effects.
The “MC statistics” and “CR statistics” uncertainties in table 9(b) arise from limited
simulated events in the SRs and CRs and from the number of data events populating the CRs, respectively.
7.1 Theoretical uncertainties
The theoretical uncertainties on the total Higgs boson production cross section and branch-ing fraction are evaluated by followbranch-ing the recommendation of the LHC Higgs cross-section
working group [21, 44,45]. Uncertainties concerning QCD renormalisation and
factorisa-tion scales, which are hereafter collectively referred to as QCD scales, PDF, the value of