THESIS
AGRARIAN TRANSITION IN THE UPLANDS OF CENTRAL VIETNAM:
DRIVERS OF MARKET-ORIENTED LAND-USE AND LAND-COVER CHANGE
Submitted by Kirk Saylor
Department of Anthropology
In partial fulfillment of the requirements For the Degree of Master of Arts
Colorado State University Fort Collins, Colorado
Spring 2019
Master’s Committee:
Advisor: Stephen Leisz Kathleen Galvin
Copyright by Kirk Saylor 2019 All Rights Reserved
ii ABSTRACT
AGRARIAN TRANSITION IN THE UPLANDS OF CENTRAL VIETNAM:
DRIVERS OF MARKET-ORIENTED LAND-USE AND LAND-COVER CHANGE
This study presents an analysis of changing land-use and land-cover in the North-Central Coast region of Vietnam in recent decades, during which rural upland communities have become partially integrated into commodity markets. Market integration has resulted from the extension of transportation network infrastructure under the East-West Economic Corridor (EWEC) project completed in mid-2006. This project has improved market connectivity and accessibility between rural and urban areas, creating flows of goods, information, and money induce agrarian transition and influence land-use / land-cover change processes. Analysis of satellite imagery over the last decade shows some signs of possible agricultural intensification along the Highway 9 corridor, while elsewhere in the study area a clear and consistent trendline cannot be ascertained.
Confounding factors include usability of imagery, temporal gaps in collection, and the resolution of available and usable imagery. The pattern of changing land-cover emerging along Highway 9 is hypothesized to result from changing land rents, where lower transportation costs and higher agricultural prices increase the profitability of cash cropping, incentivizing local populations to engage in market-oriented production. Such a microeconomic response would be consistent with von Thünen’s extrinsic theory of land rent, as well as the multi-scalar frameworks of
teleconnections and telecoupling. These dynamics are explored at the village level through a spatially explicit agent-based model that simulates household decision-making using
empirically-fitted rules, to better understand the process of transition from subsistence cropping to a mixed mode of production with cash cropping.
iii
ACKNOWLEDGEMENTS
The author wishes to acknowledge first and foremost his appreciation for two key scholars – CSU faculty advisor (Prof. S.J. Leisz) and his former graduate student (E. Rounds) - for their previous work illuminating the dynamics for the study area as relates to land-use – along with other scholars, past and present, who have built upon one another’s fieldwork and research efforts (many, but not all of whom, are cited in this paper). Much gratitude is also extended to committee members - Prof. R. Boone and Prof. K. Galvin - for their kind and generous support throughout. Prof. A. Bliss also volunteered considerable assistance in various aspects of this endeavor, as did J. Norman and S. Filippelli on numerous occasions. Thanks are also owed to the Digital Globe Foundation for extending an imagery grant. Last, but not least, the author thanks his spouse and family for their material and moral support in this endeavor.
iv
TABLE OF CONTENTS
ABSTRACT ... ii
ACKNOWLEDGEMENTS ... iii
LIST OF TABLES ... vi
LIST OF FIGURES ... vii
Chapter 1: Background of study area and theoretical frameworks ... 1
1.2 Background of study area ... 2
1.2.1 Human geography ... 5
1.2.2 Physical geography ... 15
1.3 Literature review ... 22
1.3.1 Conceptual frameworks ... 22
1.3.2 Von Thünen theory of land rent ... 22
1.3.3 Telecoupling and teleconnections – multi-scalar drivers of LULC change trajectories .... 28
1.3.4 Shifting cultivation in the context of extended market reach ... 36
1.4 Conclusion ... 38
Works Cited ... 40
Chapter 2: Agricultural land-use and land-cover change detection analysis (2001-2014) ... 46
Summary ... 46
2.1 Introduction ... 47
2.2 Literature review ... 48
2.3 Methods ... 51
2.3.1 Remote sensing analysis of Landsat imagery (2001-2014) ... 51
2.3.2 Geospatial statistical analysis of land-cover derived from Landsat ... 54
2.4 Results ... 58
2.4.1 Summary statistics results – total area, count, and clustering ... 66
2.4.2 Statistical sampling of clearings across district finds no clear trendline ... 68
2.4.3 Direction of change relative to highways based on median center points ... 73
2.4.4 Direction and magnitude of LULC change based on shifts in density of clearings... 81
2.4.5 Caveats on results as relate to data availability / quality, tools and methods... 89
2.5 Discussion of observed pattern of LULC change and drivers thereof ... 90
v
Chapter 3: Simulating agrarian transition from subsistence to cash cropping at the village level
using an agent-based modeling approach ... 110
Summary ... 110
3.1 Introduction ... 111
3.2 Literature review: Land-use / land-cover change modeling ... 112
3.2.1 Large area, coarse-resolution models: Global, regional, national-scale modeling ... 113
3.2.2 Small-area, fine-resolution models: Local-scale modeling ... 114
3.2.3 Generalized models ... 120
3.3 Study area ... 122
3.4 Methods – overview, design, and details of model development process ... 125
3.4.2 Agents ... 126
3.4.3 Model process: stepwise execution of the model ... 130
3.4.4 Full run of the model (30 timesteps) and model outputs ... 134
3.4.5 Model testing – Baseline scenario and BehaviorSpace experiments ... 134
3.5 Results of model testing - Baseline scenario and BehaviorSpace testing ... 136
3.5.1 Results for Klu village... 136
3.5.2 Results for Ta Rec village ... 149
3.6 Discussion – Baseline scenario and BehaviorSpace experiments ... 161
3.6.1 Baseline results assessment ... 161
3.6.2 BehaviorSpace results assessment ... 164
3.7.2 Empirical level “macrovalidation” ... 179
Works Cited ... 191
Chapter 4: Overall conclusion ... 198
vi
LIST OF TABLES
Table 1: Demographic distribution of ethnic minority populations (McElwee 2008: 85) ... 6 Table 2: Demographic data for Đa Krông District, 2009 (World Bank 2015) ... 7 Table 3: Development indicators for Đa Krông District, 2009 (World Bank 2015) ... 8 Table 4: Demographic and poverty indicators for Quảng Trị Province, 2009 (World Bank 2015) 9 Table 5: Socio-economic development indicators for Quảng Trị Province vs. all provinces
nationally (World Bank 2015) ... 10 Table 6: Median centerpoints summary table by zone and sector (2001 vs. 2014) ... 75 Table 7: Changing distribution of clearings by intensity class (kernel density), 2001-2014 ... 82 Table 8: Mean distance to road of cleared areas by intensity class (kernel density), 2001-2014 . 83 Table 9: Fallow vegetation regeneration land-cover thresholds ... 133 Table 10: Simulated LULC impacts of changing market prices... 165 Table 11: Simplified comparison of dry rice vs. hybrid cassava market values, based on
fieldnotes (Leisz et al. 2014) ... 167 Table 12: Klu village clearings (Leisz et al. 2016: 12) ... 180 Table 13: Observed extent of cleared areas for Klu village derived from satellite imagery, 2014 / 2016 / 2018 ... 180 Table 14: Modeled extent of cleared area for Klu village (median values), timesteps
corresponding to years in Table 13 ... 181 Table 15: Observed mean distances between clearings and mean distances of clearings to roads (derived from satellite imagery), 2010-2018 ... 182 Table 16: Observed mean distances between clearings and mean distances of clearings to roads, timesteps corresponding to years in Table 15 ... 182 Table 17: Ta Rec village clearings (Leisz et al. 2016: 13) ... 183 Table 18: Observed clearings for Ta Rec village derived from satellite imagery, 2014 / 2016 / 2018... 183 Table 19: Modeled clearings for Ta Rec village (median values), timesteps corresponding to years in Table 18 ... 183 Table 20: Observed clustering of clearings and distance to roads derived from satellite imagery, 2010 / 2014 / 2016 / 2018 ... 184 Table 21: Modeled clustering and distance to roads, timesteps corresponding to years in Table 20 ... 184
vii
LIST OF FIGURES
Figure 1: Regional-scale map showing Quảng Trị Province, Vietnam ... 2
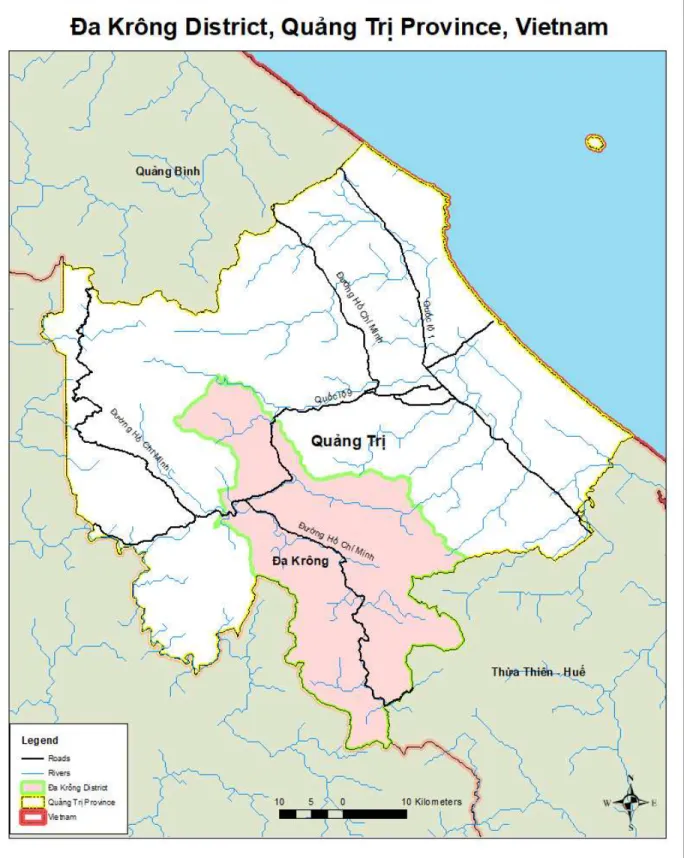
Figure 2: Provincial-scale map showing Đa Krông District, Quảng Trị Province, Vietnam ... 4
Figure 3: Estimated population distribution, 2000 (GHSL 2015) ... 12
Figure 4: Estimated population distribution, 2015 (GHSL 2015) ... 13
Figure 5: Net Population Change 2000-2015 (GHSL 2015) ... 14
Figure 6: “ClimateCharts.net” climate profile for Krông Klang ... 16
Figure 7: Regional-scale map of market access for Southeast Asia (Verburg et al. 2011) ... 18
Figure 8: Provincial-scale map of market access for Quảng Trị Province, Vietnam (Verburg et al. 2011) 19 Figure 9: Transportation infrastructure projects between and among nations of Southeast Asia (Ishida 2009) ... 21
Figure 10: Concentric rings of agricultural and forest-related land-uses associated with differing land-rent per the von Thünen theory of land rent, based on Angelsen (2007) ... 25
Figure 11: Exemplar of cleared areas derived from NBR ... 53
Figure 12: Segmentation of study area for assessing direction and magnitude of shifts in agricultural clearings using mean and median center points. ... 57
Figure 13: Map of agricultural clearings for study area (7 April 2001) ... 59
Figure 14: Map of agricultural clearings for study area (5 April 2006) ... 60
Figure 15: Map of agricultural clearings for study area (24 April 2007) ... 61
Figure 16: Map of agricultural clearings for study area (28 March 2009) ... 62
Figure 17: Map of agricultural clearings for study area (27 April 2014) ... 63
Figure 18: Composite map of agricultural clearings derived from NBR of Landsat TM (2001, 2006) ... 64
Figure 19: Composite map of agricultural clearings derived from NBR of Landsat TM (2007, 2009) and Landsat OLI (2014) ... 65
Figure 20: Total area cleared by year (April-centered chrono-series), 2001-2014 ... 66
Figure 21: Total count of clearings by year (April-centered chrono-series), 2001-2014 ... 67
Figure 22: Average distance between cleared areas (April-centered chrono-series), 2001-2014 ... 68
Figure 23: Boxplot showing range of values in Distance to Population for all clearings across district for each image date (2001-2014) ... 69
Figure 24: Boxplot showing range of values in Distance to Road for all clearings across district for each image date (2001-2014) ... 69
Figure 25: Boxplot showing range of values in Elevation for all clearings across district for each image date (2001-2014) ... 70
Figure 26: Boxplot showing range of values in Slope for all clearings across district for each image date (2001-2014)... 70
Figure 27: Boxplot showing range of values in Distance to Population of clearings within 1500m of Highway 9 / Ho Chi Minh Highway for each image date (2001-2014) ... 71
Figure 28: Boxplot showing range of values in Distance to Road for clearings within 1500m of Highway 9 / Ho Chi Minh Highway for each image date (2001-2014) ... 72
Figure 29: Boxplot showing range of values in Elevation of clearings within 1500m of Highway 9 / Ho Chi Minh Highway for each image date (2001-2014) ... 72
viii
Figure 30: Boxplot showing range of values in Slope of clearings within 1500m of Highway 9 / Ho Chi Minh Highway for each image date (2001-2014) ... 72 Figure 31: Distance to nearest highway for median center points of clearings (2001 / 2007 / 2014) in Zone 1 (Krông Klang townlet and Mò Ó commune) ... 76 Figure 32: Distance to nearest highway for median center points of clearings (2001 / 2007 / 2014) in Zone 2 (ĐaKrông commune) ... 77 Figure 33: Distance to nearest highway for median center points of clearings (2001 / 2007 / 2014) in Zone 4 (Ba Nang Commune) ... 78 Figure 34: Distance to nearest highway for median center points of clearings (2001 / 2007 / 2014) in Zone 3 and Zone 4 (center sectors) ... 79 Figure 35: Distance to nearest highway, median center points of clearings (2001 / 2007 / 2014) in Zone 3 and Zone 4 (south sectors) ... 80 Figure 36: Changing distribution of clearings by intensity class (kernel density) ... 81 Figure 37: Mean distance to road of cleared areas by intensity class (kernel density) ... 82 Figure 38: Density of agricultural clearings per hectare, Đa Krông District, Quảng Trị Province, Vietnam (April 2001) ... 84 Figure 39: Density of agricultural clearings per hectare, Đa Krông District, Quảng Trị Province, Vietnam (April 2006) ... 85 Figure 40: Density of agricultural clearings per hectare, Đa Krông District, Quảng Trị Province, Vietnam (April 2007) ... 86 Figure 41: Density of agricultural clearings per hectare, Đa Krông District, Quảng Trị Province, Vietnam (March 2009) ... 87 Figure 42: Density of agricultural clearings per hectare, Đa Krông District, Quảng Trị Province, Vietnam (April 2014) ... 88 Figure 43: Villages of Klu and Ta Rec, Đa Krông District, Quảng Trị Province ... 123 Figure 44: Klu Village, April 2001, as seen in high-resolution commercial satellite imagery (Google Earth) ... 124 Figure 45: Ta Rec Village, April 2001 - as seen in high-resolution commercial satellite imagery (Google Earth) ... 125 Figure 46: Dry rice yields (kgs per hectare) based on fallow age, based on Jepsen (2006: 1071) ... 132 Figure 47: Overall change in land-cover over time by cover type (median values) for Klu, Baseline scenario (30 runs) ... 138 Figure 48: Agricultural clearings simulated via ABM inside the road buffer zone (600m) for Klu village; generated in NetLogo v. 6.0.2, BehaviorSpace “Baseline” experiment (30 runs at 30 steps/run) ... 139 Figure 49: Change in land-cover inside road buffer zone over time by cover type (median values) for Klu, Baseline scenario (30 runs) ... 140 Figure 50: Agricultural clearings simulated via ABM outside the road buffer zone (600m) for Klu village; generated in NetLogo v. 6.0.2, BehaviorSpace “Baseline” experiment (30 runs at 30 steps/run) ... 141 Figure 51: Change in land-cover outside road buffer zone over time by cover type (median values) for Ta Rec, Baseline scenario (30 runs) ... 142 Figure 52: Agricultural clearings simulated via ABM inside and outside the road buffer zone (600m) for Klu village; generated in NetLogo v. 6.0.2, BehaviorSpace “Agronomy” experiment. ... 143 Figure 53: Agricultural clearings simulated via ABM inside and outside the road buffer zone (600m) for Klu village; generated in NetLogo v. 6.0.2, BehaviorSpace “Climate Change” experiment. ... 144 Figure 54: Agricultural clearings simulated via ABM inside and outside the road buffer zone (600m) for Klu village; generated in NetLogo v. 6.0.2, BehaviorSpace “Demographics” experiment. ... 145
ix
Figure 55: Agricultural clearings simulated via ABM inside and outside the road buffer zone (600m) for Klu village; generated in NetLogo v. 6.0.2, BehaviorSpace “Market Prices” experiment. ... 146 Figure 56: Agricultural clearings simulated via ABM inside and outside the road buffer zone (600m) for Klu village; generated in NetLogo v. 6.0.2, BehaviorSpace “Terrain Constraint (Slope)” experiment. .. 148 Figure 57: Overall change in land-cover over time by cover type (median values) for Ta Rec, Baseline scenario (30 runs) ... 150 Figure 58: Agricultural clearings simulated via ABM inside the road buffer zone (350m) for Ta Rec village; generated in NetLogo v. 6.0.2, BehaviorSpace “Baseline” experiment (30 runs at 30 steps/run) ... 151 Figure 59: Change in land-cover inside road buffer zone over time by cover type (median values) for Ta Rec, Baseline scenario (30 runs) ... 152 Figure 60: Agricultural clearings simulated via ABM outside the road buffer zone (350m) for Ta Rec village; generated in NetLogo v. 6.0.2, BehaviorSpace “Baseline” experiment (30 runs at 30 steps/run) ... 153 Figure 61: Change in land-cover outside road buffer zone over time by cover type (median values) for Ta Rec, Baseline scenario (30 runs) ... 154 Figure 62: Agricultural clearings simulated via ABM inside and outside the road buffer zone (350m) for Ta Rec village; generated in NetLogo v. 6.0.2, BehaviorSpace “Agronomy” experiment. ... 155 Figure 63: Agricultural clearings simulated via ABM inside and outside the road buffer zone (350m) for Ta Rec village; generated in NetLogo v. 6.0.2, BehaviorSpace “Climate Change” experiment. ... 156 Figure 64: Agricultural clearings simulated via ABM inside and outside the road buffer zone (350m) for Ta Rec village; generated in NetLogo v. 6.0.2, BehaviorSpace “Demographics” experiment ... 157 Figure 65: Agricultural clearings simulated via ABM inside and outside the road buffer zone (350m) for Ta Rec village; generated in NetLogo v. 6.0.2, BehaviorSpace “Market Prices” experiment. ... 158 Figure 66: Agricultural clearings simulated via ABM inside and outside the road buffer zone (350m) for Ta Rec village; generated in NetLogo v. 6.0.2, BehaviorSpace “Terrain Constraint (Slope)” experiment. ... 160 Figure 67: Simulated agricultural land-use in Klu village at time step 23 of model run (Baseline scenario with road improvement enabled) overlaid on April 2014 Landsat 8 (OLI) imagery. Yellow represents cleared areas generated by model output. Reddish and pinkish hues on landscape represent actual
clearings. ... 174 Figure 68: Simulated agricultural land-use in Klu village at time step 23 of model run under subsistence-only (Baseline scenario with road improvement disabled) overlaid on April 2014 Landsat 8 (OLI) imagery. Yellow represents cleared areas generated by model output. Reddish and pinkish hues on
landscape represent actual clearings. ... 175 Figure 69: Simulated agricultural land-use in Ta Rec village at time step 23 of model run (Baseline scenario with road improvement enabled) overlaid on April 2014 Landsat 8 (OLI) imagery. Yellow represents cleared areas generated by model output. Reddish and pinkish hues on landscape represent actual clearings. ... 177 Figure 70: Simulated agricultural land-use in Ta Rec village at time step 23 of model run under
subsistence-only (Baseline scenario with road improvement disabled) overlaid on April 2014 Landsat 8 (OLI) imagery. Yellow represents cleared areas generated by model output. Reddish and pinkish hues on landscape represent actual clearings. ... 178
1
Chapter 1: Background of study area and theoretical frameworks
This thesis investigates changing land-use systems and land-cover patterns associated with processes of road-enabled market integration in the rural uplands of central Vietnam occurring since approximately 2007. The first chapter presents a general background on the human and physical geography of the study area and introduces two key theoretical frameworks. The second chapter explores available satellite imagery to assess land-use / cover changes at the district level from 2001 to 2014. The third chapter presents a spatially-explicit, agent-based simulation model at the village level, which is used to explore the emergence of land-cover changes arising from household decision-making with a shift from subsistence cropping to partial market integration, built on the assumption that households exercise bounded rationality in allocating labor and land to meet food needs by cropping dry rice and income generation through cash cropping.
1.1 Introduction
Đa Krông (“Big River”) District, Quảng Trị Province is situated in the uplands of north-central Vietnam. This chapter examines the physical and human geography of this area, with attention to the Van Kieu ethnic minority population. The rural populations of this area have been undergoing a process of agrarian transition involving the production of cash crops, in the context of transportation network upgrades and associated processes of market integration. Market integration appears an inevitable reality, to which local populations have been adapting their land-use systems in a more market-oriented manner. Despite the legacies of deeply rooted colonial practices and centrally-planned communist policies during the 20th century, market
forces may be emerging in the early 21st century as the most important factor affecting land-use systems, patterns of land-cover change, and livelihoods.
2
In order to better comprehend this ongoing process of agrarian transition, the chapter presents two theoretical frameworks relevant to understanding land-use and land-cover change. The first framework considered is von Thünen’s theory of land rent, a place-based microeconomic perspective that retains relevance nearly 200 years since initial publication. The second is the “teleconnections” framework and its successor “telecoupling”, which provides a broader perspective on systems operating at multiple spatial scales beyond the local-scale – provincial, national, regional, and international - that influence the direction and magnitude of developments at the local-scale. These frameworks are considered mutually complementary, by acknowledging proximate and distal causes of change respectively. Their practical relevance will be considered in the analysis of the direction and magnitude of land-use and land-cover change presented in Chapter 2.
1.2 Background of study area
The land and peoples of Đa Krông District, Quảng Trị Province, Vietnam, constitute the key unit of analysis for this study. The administrative unit encompasses a rural area located in the uplands of the north-central coastal region of Vietnam (Figure 1 and Figure 2).
3
4
5
1.2.1 Human geography
The study area is inhabited primarily by the Van Kieu ethnic minority, commonly referred to as the “Bru” in ethnographic records (which translates literally as “People”), who span the uplands of Quảng Trị Province and neighboring areas of Laos (Mole 1970). The Van Kieu are one of several ethnic populations affiliated with the Mon-Khmer language family inhabiting this region, who have traditionally made their living through shifting cultivation practices,
supplemented by fishing, hunting, and gathering from nearby forest areas. The Van Kieu are primarily concentrated in the Khe Sanh region west of Đa Krông District, near the border with neighboring Laos, and more importantly for the purposes of this study straddle both sides (i.e., north and south) of Highway 9 (“Quốc lộ 9”) (Mole 1970).
The historical origins of the Van Kieu in the uplands of the Annamite Cordillera (Trường Sơn Mountains) before the mid-1960s remains obscure, with some speculation that they may have relocated from lowland areas under duress (McElwee 2008). This minority group, like others, was adversely affected by conflicts with French colonialists, Japanese occupiers, and later American armed forces, sustaining significant losses in terms of lives, livelihoods, and property during the First and Second Indochina Wars (McElwee 2008). Vargyas (2001) characterized these conflicts as having been disastrous for local populations due to the destruction inflicted on their agricultural systems, as well as losses of tangible items and intangible culture. Such
impacts, however, forced local populations into a state of economic autarchy, which “facilitated the reconstruction of the traditional way of life and the reassertion of its values” (Vargyas 2001: 200). This post-war era thus saw a revival in traditional cultural practices amongst this
6
Demographic estimates for the Van Kieu and other ethnic minorities inhabiting this region vary widely over time and across space at the national level (Table 1).
Table 1: Demographic distribution of ethnic minority populations (McElwee 2008: 85)
Ethnic Group(s) Est. population in Vietnam (1962) Vietnamese Census (1999) Est. population outside Vietnam (2008) State(s) Ka Tu / Co Tu / Katu 25,000-30,000 50,458 15,000-20,000 Lao PDR Ta Oi / Tahoi 5,000 34,960 30,000 Lao PDR Pa Co / Pacoh 10,000 counted as "Ta Oi" 13,000 Lao PDR Pa Hy Unknown counted as "Ta Oi" Unknown
Van Kieu / Bru 30,000 55,559 70,000-80,000 Lao
PDR
5,000-10,000 Thailand
To put those demographic data into context, the most recent data available gathered at the national level for Vietnam, through the census of 2009, shows that ethnic minority populations appear relatively fewer in number compared to the majority Kinh ethnicity and often reside in relatively lower density administrative units. Đa Krông District has comparatively lower levels of overall population and higher average household size relative to most other districts within the province, e.g., those in the east, which are smaller in area but more densely settled (Table 2).
7
Table 2: Demographic data for Đa Krông District, 2009 (World Bank 2015)
District Population (N) Households (N) Average Household
Size Cam Lo 44,418 10,737 4.14 Con Co 91 28 3.25 Đa Krông 36,413 7,963 4.57 Dong Ha 84,063 21,759 3.86 Gio Linh 71,705 16,284 4.40 Hai Lang 85,128 21,923 3.88 Huong Hoa 74,105 14,744 5.03 Quảng Trị 22,701 6,053 3.75 Trieu Phong 94,023 27,033 3.48 Vinh Linh 85,332 23,965 3.56
The relative level of socio-economic development at the district level can be measured by various indicators pertaining to education, employment, poverty, sanitation, and water supply. By these indicators, Đa Krông District stands out for its high level of agricultural employment and ranks relatively low compared nationally by various other metrics, per 2009 data (Table 3).
8
Table 3: Development indicators for Đa Krông District, 2009 (World Bank 2015)
Indicator Đa Krông District Number of districts nationwide Percent districts ranking below Đa Krông
Main employment: agriculture, Rank 91 685 86.72
Main employment: non-farm self-employment, Rank
586 685 14.45
Main employment: wage work, Rank 582 685 15.04
Main light source: electricity, Rank 616 685 10.07
Poverty: GSO-WB extreme poverty headcount, Rank
660 685 3.65
Poverty: GSO-WB poverty headcount, Rank 659 685 3.80
Poverty: Population in national bottom 40 percent, Rank
663 685 3.21
Sanitation: any flush toilet, Rank 538 685 21.46
Sanitation: indoor flush toilet, Rank 564 685 17.66
Sanitation: outdoor flush toilet, Rank 399 685 41.75
Secondary school attendance: Lower [11-15 years], Rank
600 685 12.41
Secondary school attendance: Overall [11-18 years], Rank
540 685 21.17
Secondary school attendance: Upper [16-18 years], Rank
546 685 20.29
Water: indoor tap, public tap or well, Rank 509 685 25.69
Quảng Trị Province also had relatively low overall population levels and number of
households compared with most other provinces (less than half the national average) nationally, as well as relatively high levels of poverty as measured by various indices (Table 4).
9
Table 4: Demographic and poverty indicators for Quảng Trị Province, 2009 (World Bank 2015)
Indicator Quảng Trị Province National average for all provinces (mean) Quảng Trị as % of national average Population (N) 597,984 1,361,739 43.91 Households (N) 150,489 359,198 41.90 Working population (N) 307,838 770,091 39.97
Poverty: GSO-WB poverty headcount (%) 30 25 118.05
Poverty: GSO-WB poverty headcount (N) 179,395 267,922 66.96
Poverty: GSO-WB poverty headcount, National avg (%) 20 20 100.00
Poverty: Population in national bottom 40 percent (%) 53 46 114.90 Poverty: Population in national bottom 40 percent (N) 316,932 533,552 59.40 Poverty: Population in national bottom 40 percent, National avg (%) 39 39 100.00
Poverty: GSO-WB extreme poverty headcount (%) 11 10 112.32
Poverty: GSO-WB extreme poverty headcount (N) 65,778 87,311 75.34
With regard to the relative levels of socio-economic development of Quảng Trị province relative to national averages, Quảng Trị ranks in the bottom half compared to the other provinces (63 in total) for key indicators relating to employment and poverty levels, based on World Bank accounting of available census data for 2009 (Table 5). In other areas, such as sanitation, their ranking is more mixed. With regard to education and electrification, they rank more favorably in the upper half of the distribution.
10
Table 5: Socio-economic development indicators for Quảng Trị Province vs. all provinces nationally (World Bank 2015)
Indicator Ranking
(out of 63 provinces)
Main employment: agriculture, Rank 33
Main employment: non-farm self-employment, Rank 22
Main employment: wage work, Rank 31
Main light source: electricity, Rank 23
Poverty: GSO-WB extreme poverty headcount, Rank 47
Poverty: GSO-WB poverty headcount, Rank 47
Poverty: Population in national bottom 40 percent, Rank 47
Sanitation: any flush toilet, Rank 31
Sanitation: indoor flush toilet, Rank 18
Sanitation: outdoor flush toilet, Rank 51
Secondary school attendance: Lower [11-15 years], Rank 19 Secondary school attendance: Upper [16-18 years], Rank 9
Water: indoor tap, public tap or well, Rank 24
This situation as of 2009 as relates to rural underemployment and unemployment, and
associated socio-economic issues of poverty and malnutrition, is a function of rural deficiencies in infrastructure, technology and management, despite relatively consistently high levels of economic growth following key reforms such as the Land Law of 1993, including average annual growth rates over 7 percent from 1986 to 2008 and growth of the labor force ranging from 8 to 14 percent per annum (Van Dinh et al. 2001; McCaig & Pavcnik 2013).
With regard to the population dynamics across the province for the timespan under consideration for this study, available gridded population data compiled by the European Commission (i.e., GHSL) show that there has been a gradual increase in population levels over the last few decades, primarily in the coastal regions of the province since 1975 east of Đa Krông District, with a slight increase in population along the riparian corridor traversed by Highway 9 connecting these population centers to the west. Figure 3 and Figure 4 show population levels in
11
2000 and 2015, as determined by the European Commission (GHSL data, 250m x 250m grid cell), and Figure 5 illustrates the net difference (gain / loss) over that timeframe. While difficult to discern at the scale of the maps presented, gaining areas occurred primarily around urban centers in more densely-settled eastern districts (e.g., Dong Ha vicinity and neighboring
districts), which are undergoing rapid processes of industrialization and urbanization associated with improving international investment and trade relations (Leisz et al. 2016). While the exact magnitude of change cannot be determined with precision due to issues with the spatial and temporal resolution of available data, a general direction of change can at least be ascertained.
12
13
14
15
1.2.2 Physical geography
Đa Krông District extends approximately 60 km along its north / south axis and 25 km from east-to-west at its widest span, encompassing a total area of approximately 1100 square
kilometers. Terrain elevation ranges from approximately sea level to over 1400 meters above sea level, with a high degree of variability in terms of roughness, dissection, and steepness. Average slope across the study area measures 16 degrees, ranging from a low of 5 degrees up to a
maximum slope observed of 74 degrees. Three prominent mountain peaks in the surrounding area include Dong Sa Mui (1597m ASL), Dong Voi Mep (also known as “Dent du Tigre”, 1774m ASL) to the north of Highway 9, and Dong Quang Ngai (2362m ASL) to the south (Mole 1970). The land-cover resulting from the management of this landscape by the local population for agriculture and agroforestry - as well as fishing, gathering, and hunting - is a highly varied patchwork, constrained by steep terrain, where slopes steeper than 40 degrees preclude
cultivation due to poor soil moisture retention and high erodibility.
The study area falls in a tropical monsoon climate zone (Köppen-Geiger climate classification category "Am") with monthly mean temperatures over 18°C. Summer spans from May to
October, with varying levels of monsoonal rainfall depending upon prevailing ENSO conditions, where drought or flood conditions occur from time to time. The winter seasons runs from
November to April, with February, March, and April, typically seeing the least rainfall. Mole (1970) noted that rainfall in terrain at higher elevations often measures over 150 inches per year, versus ~ 60 inches per year at lower elevations. A representative climate profile for Krông Klang (106° 49' 16° 39'), a major populated place adjacent to Highway 9 in the study area, shows this general pattern of typical seasonal variation in temperature and precipitation (Figure 6).
16
Figure 6: “ClimateCharts.net” climate profile for Krông Klang
Under such climate conditions, shifting cultivators traditionally clear new plots during the dry season in February, burn dried vegetation (i.e., “slash”) in March, and plant crops in April (e.g., dry rice), per the customary annual cropping cycle. Taller trees with little understory are
associated with primary forest cover found at higher elevations on steeper terrain. Secondary regrowth areas are characterized by shorter trees and more substantial vegetative undergrowth. The principal rivers flowing through this terrain include the Song Bo Dien flowing east to Dong Ha, the Song Quảng Trị flowing east to Quảng Trị City, and the Song Pone flowing west to the Mekong River in neighboring Laos (Mole 1970: 42-43).
The steep and highly dissected terrain of this region’s physical geography has limited transportation infrastructure historically to river valley bottoms, which offer the only truly suitable corridors for transportation networks, thereby exerting influence on the region’s human
17
geography. The original Highway 9, built in 1904 under French colonial rule, extended from Dong Ha across the riparian corridor of present day Đa Krông District to Laos (McElwee 2008). An unsurfaced dirt road, it provided only dry season connectivity between the coastal regions of Quảng Trị Province and inland, upland areas of Vietnam and Laos. Within a state of relative socio-economic isolation that existed before the road upgrade project, the prevailing modus
vivendi of villagers revolved around the shifting cultivation of staple food crops and the
domestication of animals, supplemented by fishing, hunting, and gathering (Mole 1970: 55-58), with limited off-farm work opportunities. The livelihood systems during this era could be characterized as operating on the basis of the “right to subsistence” rooted in the hierarchy of human needs and associated with an agrarian ethos whereby “all members of a community have a presumptive right to a living so far as local resources will allow” and the more fortunate help those who are less well-off (Scott 1976: 176).
To provide more current context on the relative degree of market integration and isolation, Verburg et al. (2011) estimate market access globally at fairly coarse spatial resolution. Their data provide a general sense of relative levels of market integration for Vietnam. The major metropolitan areas of Hanoi and Ho Chi Minh City, which are shaded red, rate high on the spectrum, whereas the study area (north-central coastal region) bounded in green below, is shaded blue and rates low on the spectrum (Figure 7 and Figure 8).
18
19
Figure 8: Provincial-scale map of market access for Quảng Trị Province, Vietnam (Verburg et al. 2011)
20
The improvement of Highway 9 by widening, grading, and paving with asphalt, occurred in mid-2006 as part of the East-West Economic Corridor (EWEC) project. This project aims to promote “greater cooperation by linking production and trade through infrastructure” (Ishida & Isono 2012: 11). The EWEC was given high priority by the Asia Development Bank (ADB) in 2000, as part of the Greater Mekong Subregion (GMS) program (Ishida & Isono 2012). Financial sponsors include the ADB and Japan International Cooperation Agency (JICA), with the
government of Vietnam providing support and oversight (Leisz et al. 2016). The EWEC is one among several transportation corridor projects being implemented across the Southeast Asia region as part of the GSM program, which also includes the North-South Economic Corridor (NSEC) and Southern Economic Corridor (SEC) (Figure 9).
The Economic Research Institute for ASEAN (ERIA) predicts that completion of the EWEC will permit motorized travel at 80km per hour, with no delays at border crossings (Kumagai et al. 2018). ERIA projects that overall population levels of Quảng Trị Province will increase by approximately 9.8 percent from 655,000 (2005) to 719,000 by 2025 (Kumagai et al. 2018: 371). Additionally, ERIA projects economic growth to raise the overall gross domestic product (GDP) by approximately 89.6% from USD 357 million (2005) to USD 677 (by 2025) (Kumagai et al. 2018: 373). Their projections are built on a general equilibrium framework and posit the emergence of a core-periphery structure when transport costs fall sufficiently low to facilitate processes of agglomeration, overcoming tendencies toward dispersion associated with higher transportation prices (Kumagai et al. 2018). These predictions are consistent with World Bank perspectives of pro-poor rural development dating to the 1990s (Chomitz & Gray 1996).
21
Figure 9: Transportation infrastructure projects between and among nations of Southeast Asia (Ishida 2009)
22
1.3 Literature review
1.3.1 Conceptual frameworks
The conceptual frameworks relevant to this study include J.H. von Thünen’s theory of land rent, published in 1826, which concerns microeconomic dynamics on agricultural land-use on a local-scale, as well as the more recent conceptual frameworks of teleconnections and
telecoupling regarding underlying drivers operating at multiple scales. Local scale land-use systems amenable to analysis in terms of microeconomic factors can be understood as rational responses by place-based actors to optimally use available factors of production (land, labor, capital), with local actors responding to the influence of exogenous forces, e.g., outside markets, on the relative value of these factors of production on their land-use systems. Local scale
changes cannot be fully captured only by consideration of the local scale, however, as the system is not a closed one. The influence of outside forces must be considered in the context of meso- and macro-structures at the national, regional, and international scale, with which the rural uplands are becoming increasingly integrated. To that end, the application of a conceptual framework such as teleconnections and telecoupling is considered a necessary complement for tracing distal, underlying drivers influencing land-use systems and land-cover change.
1.3.2 Von Thünen theory of land rent
The von Thünen framework is concerned principally with agricultural decision-making concerning land-use systems based on land-rent. Land-rent is defined as the net return - or profit - of a given land-use, i.e., calculated as revenues minus costs. In this case, land rent is determined by the distance of the farm to the central marketplace. Von Thünen’s theory of location-driven agriculture based of maximization of land rent was informed by detailed studies of land-use systems and land-cover in his native 19th century Germany. His theory
23
posits that land-use at the local level, e.g., decisions related to cropping, grazing, and forestry practices, depend upon market forces and guide the optimal allocation of labor, land, and capital (von Thünen 1966). This framework predicts that concentric rings of land-use will emerge from rational economic behavior guided by agricultural land rent maximization. Land-use rings identified by von Thünen, extending outward radially from the village center, include the following:
(1) cash cropping; (2) forestry;
(3) crop alternation system; (4) improved system; (5) three-field system; and (6) stock farming.
The land-rent driven decision-making process is built on the rational agricultural actor weighing anticipated revenues against costs associated with the relevant factors of production (labor, capital, and transportation). The von Thünen framework posits that land-use patterns will be a function of rent-seeking, and the highest rents will accrue from areas in closer proximity to markets. Agricultural rent (r) equals revenues (py) minus the cost of labor, capital, and transportation (wl - qk – vd). Yield is y, price is p, labor is l, capital is k, wages are w, capital costs are q, transport costs are v, and distance is d (Angelsen 2010).
A review of literature illustrates the impact of upgrading infrastructure as an influence on the choice of crops a farmer will cultivate. A major reduction in distribution costs of
approximately 50 percent typically results from such transportation infrastructure improvements (i.e., upgrading road surface from “dry season” to “all-season”), thereby
24
increasing the profitability of commercial agricultural cultivation (Jacoby 2000; Angelsen 2007; Warr 2008; Brooks & Hummels 2009; Jacoby & Minten 2009; Warr 2010). This single factor – physical connectivity enabling accessibility to markets - therefore constitutes a critical driver in enabling this market-oriented development process (i.e., a necessary precondition and ongoing condition, given proper maintenance of physical infrastructure and the necessary institutional infrastructure, e.g., legal and regulatory) (Brooks & Hummels 2009: 3). In Vietnam, by facilitating connectivity to nearby demand centers, this upgrading of Highway 9 (as part of the East-West Economic Corridor Project) aligns with national goals regarding poverty reduction through income generation, while also promoting return on investment to stakeholders including those making foreign direct investments.
Land rent declines with distance, and the agricultural frontier demarcates the distance at which agricultural expansion ceases to be profitable, i.e., r = 0. This distance is calculated with the following equation (derived from the land rent equation): d = ( py - wl - qk ) / v .
Angelsen extends the von Thünian framework as encompassing both agricultural rent and forest rent as competing goods in a human decision-making framework, i.e., whether the use of a given plot of land is deemed more advantageous from a land-rent perspective if cleared for use in agriculture or left under tree cover and retrained as woodlands / forest, where woodlands can be used for either timber or non-timber forest products or a combination thereof. Angelsen (2007) visualized von Thünen’s concentric rings in a slightly different fashion than the original publication of 1826, where each ring is defined by the relative heights (i.e., y-axis intercept) and slopes (i.e., steepness) of the associated land-rent, measured on a per hectare basis. His model differentiates between two types of agriculture (intensive and extensive) and three types of forest / woodlands (managed, open-access forests, and primary / old-growth forests). The
25
rent curves grow relatively steeper, with higher intercepts on the rent (y) axis, as distance between the farm and central marketplace decrease (Figure 10). Angelsen acknowledges that these rings are not fixed in location, and the sequencing thereof could vary under different scenarios. Chomitz and Gray (1996: 488) posit that road impacts “will be strongly modulated by other factors affecting rent, including soil quality and distance from markets.”
Figure 10: Concentric rings of agricultural and forest-related land-uses associated with differing land-rent per the von Thünen theory of land rent, based on Angelsen (2007)
26
While such economic factors are often critical, the consensus view of the land systems science community generally attributes land-cover change to one or more of following key endogenous and exogenous factors, acting alone or in combination with others (Lambin et al. 2003: 217-220): (1) natural variability (exogenous);
(2) economic and technological factors (exogenous); (3) demographic factors (endogenous);
(4) institutional factors (exogenous); and (5) cultural factors (endogenous).
Lambin et al. (2003: 225-226) posit that the majority (70-90%) of observed land-use change cases are a result of the synergistic interaction of factors, while acknowledging that in a small percentage of cases that a single factor may account for the preponderance of the direction and magnitude of LULC change. Changes in land-use systems is perceived to be a function of arbitrage between the following causal elements:
(1) pressures (function of overall population, available labor, amount / type of resources available);
(2) opportunities (function of prices, production costs, transportation costs, and technology); (3) policies (function of governance, infrastructure, property rights, subsidies, and taxes); (4) vulnerability (function of exposure, sensitivity, coping capacity); and
(5) social organization (function of resource access, income distribution, household characteristics, and urban-rural interactions).
Given a prevailing trend in LULC change involving the conversion of forest cover or woodlands to agricultural land-use systems, Angelsen and Kaimowitz (1999) reviewed 140
27
economic models of deforestation and reached a consensus that the following factors are correlated discretely and more so if occurring concurrently (i.e., synergistically):
(1) higher agricultural prices; (2) more / better roads, and
(3) low wages and shortage of off-farm employment.
These three conditions directly align with increased land rent by either raising total revenues (e.g., higher prices) or decreasing costs (e.g., lower transportation costs or holding down wages). Since agricultural commodity prices and wages tend to fluctuate, widely in some cases, transport costs may be the most critical of these variables. Whereas the friction of distance is relevant to the movement of agricultural goods from source (i.e., farm) to destination (i.e., market), improving access and connectivity through improved roads can reduce transportation costs by approximately half in many cases (Jacoby 2000; Warr 2008; Jacoby and Minten 2009). Where the inverse of any of these conditions apply, e.g., low prices, absent or deficient roads, or higher wages / better off-farm opportunities, the land-rent of agriculture will tend to diminish relative to that of forest since the profitability of agriculture declines. That is particularly true in the case where incentive structures / programs (e.g., Payments for Environment Services) are in effect. While this land-rent oriented framework makes various simplifying assumptions relating to human agency (e.g., “absolute rationality,” predicated on the availability of perfect information from an economic decision-making standpoint) and geography (e.g., a flat landscape), it did seem to characterize LULC practices in northern Europe accurately for that era (i.e., 19th
century). In addition to Germany, Linnaeus describes similar patterns of land-use in southern Sweden (Dove 2015). Absolute rationality assumes “an enterprise (that) is conducted rationally (in which) the entrepreneur pursues the maximum profit and when he is possessed of all
28
necessary knowledge to that end” (von Thünen 1966: 5). This contrasts with the notion of “bounded rationality” wherein decision-makers have imperfect information and limited time in which to evaluate. Under such conditions, satisfactory outcomes are sought as a matter of
practical necessity, and this framework offers an alternative framework to absolute rationality for analysis of economic and political choice (Simon 1991; Simon 1995).
Von Thünian concepts have since found much wider application beyond the initial models pertaining to small-scale localized rural land-use systems, including but not limited to the following assortment of topics and locations: rangelands in Southwest Asia (Schaldach et al. 2013), cash crop plantations in Latin America (Furumo & Aide 2017), rural land abandonment in former Soviet states (Prishchepov et al. 2013), land-use in Amazonia (Caldas et al. 2007; Sills & Caviglia-Harris 2009; Walker 2012; Fontes & Palmer 2018), urban forests in southern Europe (Colantoni et al. 2017), urban agglomeration processes (Fujita 2012), and wetland degradation (Walker & Solecki 2004).
1.3.3 Telecoupling and teleconnections – multi-scalar drivers of LULC change trajectories
At the “macro-” and “meso-” scales, “teleconnections” and “telecoupling” provide relevant conceptual frameworks for mapping networks of socio-ecological systems (SES) and the
associated flows between and among such increasingly interconnected systems on varying scales (direct and indirect, proximal and distal), often with consequential impacts on ecosystems and ecosystem services. Both frameworks seek to expand the scope of understanding beyond traditional place-based analyses conducted at the local (“micro”) scale by accounting for distal forces operating at national, regional, and international (“meso” / “macro”) scales and
functioning as underlying drivers of change in spatially disparate locations. As a general working definition, we can consider these frameworks as explicitly accounting for “distal connections and
29
flows” involving people, goods and services, and involving the modification of the underlying biophysical environment particularly in the context of urbanization as a system driver (e.g., land-cover as a function of land-use) (Seto et al. 2012).
Leichenko and O’Brien (2008) took a vulnerability orientation and borrowed the term “teleconnections” from climatology, but posited bidirectionality of feedbacks in terms of agent-level adaptive responses (Eakin et al. 2009; Adger et al. 2009). According to Eakin (2009: 398): “Channels that convey signals of change from the global to the local also may work in reverse, connecting the responses and choices of households in one geographic context to outcomes and choices of other households in quite distant places.” Subsequent scholarship by Liu et al. (2013) adopted the term “telecoupling” and took more of a systems orientation, characterizing systems as being relationally “sending”, “receiving”, or “spillover” with a minimum of one-to-one connectivity between systems at a given level of the system and some minimum degree of connectivity between different levels. There is also potentially many-to-many connectivity across all levels of the system, although linkages may be asymmetrical and ephemeral / transient. This paper defines the basic components of the telecoupling framework per Liu et al., who posit that sending, receiving, and spillover systems consist of the following entities and processes:
(1) Entities (nodes and links comprising the telecoupled network):
(a) Agents (human) – functionally nodes that have definable spatial location and function
as decision-making units in the system, with varying degrees of autonomy; and (b) Flows (material or abstract) – functional links between nodes, entailing the movements of goods, services, finances, information, or other commodity of value between agents (from sending to receiving).
30
(2) Processes (affecting the strength of flows between links):
(a) Causes – factors that affect supply or demand on the part of agents, or affect flows between agents, which could include developments on the one or more levels (cultural, economic, political, technological, or other);
(b) Effects – implications of reciprocal exchange agreements, including environmental and social costs previously branded as “externalities” and conveniently ignored by mainstream economists and policymakers, despite the inherent importance of such costs from a sustainability perspective. Liu et al. characterize effects as “first-order” (e.g., direct in nature / proximate in scale) as distinguished from “second-order” (e.g., indirect / diffuse or displaced).
1.3.3.1 Multi-scalar telecoupled land change: boom / bust global coffee production markets
Long-distance flows of raw materials, energy, products, people, information, and capital influence the direction and magnitude of LULC change (Friis et al. 2016). Attempts to synthesize interactions spanning oceans and interconnecting LULC change between and among the
continents of the “Global South” (Africa, Asia, Latin America) and “Global North” are a logical extension of the telecoupling framework. To that end, the linkage between global markets and decisions / behaviors by local socio-ecological systems, both without formal market governance and later with informal market governance, in Southeast Asia and Latin America regarding cash cropping practices associated with coffee – and effects on socio-ecological systems resulting from such practices - receives brief consideration. With respect to the tropical forests of Latin America and Southeast Asia, there appears to have been a telecoupled systems dynamic between LULC practices in Vietnam and assorted other coffee growing nations in Latin America (Eakin et al. 2009; Eakin et al. 2017). The global coffee market, like that of many other agricultural
31
commodities, is subject to continual flux in prices (occasionally with extreme volatility). This market has historically been dominated by producers based in Latin American – primarily Brazil, Colombia, Guatemala, and Mexico (Eakin et al. 2009). Southeast Asian nations also competing in this market have included Indonesia, the Philippines, and more recently (i.e., post-Cold War) Vietnam. The cultivation of coffee in Vietnam arose more or less spontaneously on a smallholder basis circa 1993, without the direct or active involvement of the government of Vietnam and partly in response to the collapse of the global price governance mechanism for coffee producers (the International Coffee Agreement, managed by the International Coffee Organization) that had generally constrained global coffee production, under U.S. pressure in the late 1980s (Eakin et al. 2009; Hall et al. 2011: 105; Eakin et al. 2017). Vietnamese coffee production levels rose
considerably from an extent of ~ 200,000 hectares in 1999 to ~ 500,000 hectares by 2008, exceeding cultivation levels in the Southeast Asia region. In Latin America, production levels in both Colombia and Mexico fell, while Brazil maintained its status as a major producer (Eakin et al. 2009; Eakin et al. 2017).
Hall et al. (2011) posit that the availability of farmland and forestland in the Central Highlands of Vietnam was a key enabling factor for smallholders, who otherwise have very limited
resources, to assume the risk of planting coffee bean plants, knowing it would take at least three - and possibly up to five - years from the time of planting to realize a harvest. The rising demand for coffee globally helped to induce intensified cultivation of this cash crop through the late 1990s. As global supplies responded to prices, an oversupply situation eventually occurred on the market due to the absence of a governance mechanism (such as the ICO had performed) amongst suppliers. Market forces triggered a price crash circa 2000, with a major drop in price to its lowest level in seventy years for a period of several years (Eakin et al. 2017). The
32
globalization of this commodity in an unregulated market led from boom to bust with repercussions for millions of growers.
The coffee market thus appears to have been a harsh experience for all parties involved in this global agricultural commodities market (i.e., not only the Vietnamese but all other major
producing nations), where growers (who were mostly smallholders) were acting on a rational basis but ultimately suffered for their efforts to diversify their livelihoods and income. The feedbacks incentivizing a cash crop boom necessarily involved LULC changes, to which
Vietnamese smallholders had become committed, but the market itself (e.g., intermediaries who process the commodity and end-users consuming the product) was generally indifferent to sourcing / place of origin (i.e., a prevailing view of “food from nowhere”). Eakin et al. (2009) and Hall et al. (2011) have observed a range of impacts on social and ecological systems in the fallout from this global commodity price crash, including dispossession of lands from
smallholders, influx of lowland majority populations, and environmental degradation of lands and water (Eakin et al. 2009). The end result was adverse both socio-economically and
ecologically primarily for the Central Highlands of the Vietnamese landscape and its people - a region that was also a focal point of intense military conflict with outside powers during the 20th century. Late entrants to the coffee export market in Vietnam, who had taken loans before being able to realize sufficient proceeds from sale of harvested crops, suffered more than early entrants, who had in many cases already repaid their loans. What transpired involves interconnections spanning the planet, with producers operating in a vulnerable state due to the absence of a viable governance mechanism. The effects of such an unregulated marketplace on the landscapes and livelihoods of millions of smallholders cannot be understood using only a local-scale, place-based approach, given the multi-scalar feedbacks operating in this scenario. One additional
33
feedback loop worth noting that emerged over the last decade: a grassroots movement to promote ethical product certification focused on “fair trade” and “sustainability” standards. Such
certifications now extend to nearly 40% of all production of coffee crops grown globally and have thereby helped to restore / stabilize the world price of coffee to relative parity of the price preceding the major price crash circa 2001 (Eakin et al. 2017). This is non-trivial, given the objectively harmful outcomes for millions of growers caused by events in the early 2000s, which Eakin et al. characterize as a “new business culture in which socio-ecological systems are linked not merely by trade, but by a set of principles and practices embraced globally and audited by external parties” (Eakin et al. 2017).
1.3.3.2 Telecoupled LULC change at regional scale: plantation-style cropping in Southeast Asia
Two additional examples of telecoupled landscape transformation, also spurred by cash cropping, are considered at the regional level for mainland Southeast Asia. Both involve plantation-style cultivation of cash crops. The first pertains to Luang Namtha Province, Lao PDR, near the tri-border area with Myanmar and China. This area has experienced a rise in intensive cultivation of bananas as a cash crop starting in 2000, with a doubling of the area under cash crop cultivation by 2005 and a further increase of ~50% by 2010 (Friis & Nielsen 2016; Friis & Nielsen 2017). The overall yield of cash crops increased by approximately eight hundred percent (800%) over this same time period (i.e., yield rising at four times the rate of expansion in area under cultivation). This outcome reflects an intensification in cultivation practices following land acquisitions by investors based in China under the terms of six-year leases. Landscape conversions included the destruction of existing irrigation infrastructure. Land-use intensification included heavy applications of agrichemicals, such as synthetic fertilizers.
34
This case reflects a departure from normal pathways of transition from subsistence to market integration, and the dynamics therefore diverge from the classic von Thünen pathway. Market forces are altering land-use based on rising land rents, but the local population lacks agency in the decision-making process. The pursuit of maximum sustainable yield on behalf of exogenous stakeholders from China highlights the implications of a local population lacking clear use / access rights to land. In this case, the alienation of such use / access rights significantly impacts upon the land-use systems, landcover, and livelihoods of the local population affected by cash cropping. While telecoupling is not inherently a cause of environmental degradation and socio-economic dislocation, this is one possible outcome in the absence of effective institutions and serves as a cautionary example of market integration adversely affecting rural communities. This pathway differs markedly from what has occurred in Savannakhét province, Lao PDR –
immediately west of Quảng Trị Province, Vietnam – where local populations have secure land-use / access rights and banana cultivation has not involved comparable population dislocations or environmental / ecosystem degradation (Leisz et al. 2016).
Another example of LULC change involving cash cropping driven by distal, exogenous actors, pertains to the cultivation of rubber trees in Lao PDR and Cambodia. In this case, Vietnamese investors have been actively supporting the establishment of large-scale rubber tree plantations in both neighboring states (Baird & Fox 2015). Such development can be understood within a telecoupled systems framework, where high-level flows between financiers and governments orchestrate land transfers for export-oriented production. The LULC changes associated with these commercial plantations have direct impacts on the areas where they occur and indirect, knock-on effects for socio-ecological systems elsewhere, including the displacement of local smallholders (indigenous ethnic minorities who are more rooted to their homes, and less capable
35
of / willing to relocate than majority ethnicities in lowland areas), the in-migration of
“opportunistic” laborers from outside areas to find work near such new large plantations, and ripple effects associated with lost market share by smallholders producing “jungle rubber” as a viable livelihood in other locations (Baird & Fox 2015).
As with the previous example pertaining to banana tree plantations, this case of rubber tree plantations cannot be explained or understood using only a local-scale, place-based model due to cross-scalar interactions. The sending system - comprised of investment agents in Vietnam - is physically removed from, and not organically linked with, the receiving systems - comprised of dispersed commercial plantations and industrial plants that would process the raw materials. Spillover systems include both social and ecological communities that are directly affected and / or displaced by disruptions in land access and LULC change, as well as those within a certain proximity of these plantations.
Telecoupling has a wide range of applicability beyond the foregoing examples relating to cash cropping. Other applications not addressed here include, but at not limited to, “indirect land use” (Meyfroidt et al. 2013; Yu et al 2013), “land footprints” (Bruckner et al. 2015), and nature conservation (Liu et al. 2015). Taken as a whole, this conceptual framework can be seen as a vehicle for promoting interdisciplinarity and synthesis (Kramer et al. 2017); it does so by
explicitly considering reciprocal exchanges between parties in both proximity to one another and those in disparate locations, where a sending system provides a supply (of goods, services, information, etc.) to a receiving system that functions as a demand center (e.g., a rural area supplying agricultural goods to an urban center; an industrial zone supplying manufactured goods to a foreign market; a local office in the developing world performing technical support services to a multinational corporation based in Europe, Japan, or the United States).
36
Intermediary logistical systems enable flows by linking these supply and demand nodes, and such linkages necessarily entail both environmental and financial costs (where the former [environmental] costs are typically discounted / not acknowledged by conventional economic indicators).
The production and distribution of any good or service in the global economy, such exchanges involve spillover effects on the system vis-à-vis other relationships and their associated natural resource bases. The spillover system is therefore explicitly acknowledged by this telecoupling framework, which is an important addition to the study of these systems and one that was lacking from prior conceptual frameworks. To accurately represent dynamics operating on different scales is both complicated and difficult because it requires going beyond tangible relationships that can be observed on the scale of local place-based, bounded units of analysis.
1.3.4 Shifting cultivation in the context of extended market reach
Shifting cultivation, alternately referred to by the term swidden, has been defined by Mertz et al. (2009: 261) as “a land use system that employs a natural or improved fallow phase, which is longer than the cultivation phase of annual crops, sufficiently long to be dominated by woody vegetation, and cleared by means of fire.” This land-use system has seen widespread adoption globally over several millennia as a means of surviving under conditions of relative geographic isolation and minimal economic integration with outside markets. And contrary to prevailing views, the practice has not been limited to the Tropics. Dove (2015) contends that the practice was integral to past societies in European and North American, and that by studying it solely as an exotic practice in tropical settings constitutes a form of “amnesia” on the part of the
37
regions of sub-Saharan Africa (including Madagascar), South and Southeast Asia, and the Amazonia region of Latin America.
Practitioners of shifting cultivation in Southeast Asia have generally been physically removed from commercial centers, with only limited accessibility and connectivity to markets, e.g., via “dry season” (i.e., unpaved) roads over which travel by foot or animal-drawn cart may be either very slow or altogether impractical. The provision of market accessibility through infrastructural connectivity is generally regarded as a key catalyst for market integration. With the extension of transportation network infrastructure, economic developments influencing land-use systems and associated patterns of land-cover have been observed in various locations across Asia, e.g., Bangladesh, China, Lao PDR, Myanmar, Nepal, Pakistan, and Thailand (Khandker et al. 2009; Deng et al. 2011; Gao & Liu 2012; Phompila et al. 2017; Mon et al. 2012; Bhattari et al. 2009; Ali et al. 2005; Cropper et al. 2001). Econometric analyses and general equilibrium models, e.g., LaoGEM (Warr 2007), employ differing methods but arrive at similar conclusions showing a significant reduction in transport costs estimated at ~ 50% for all-season roads vs. dry season in Africa and Asia (Jacoby 2000; Warr 2008; Jacoby & Minten 2009).
This transition should be understood within the context of Vietnam ranking as one of the “top performers” economically in the East Asia / Pacific region according to the Observatory of Economic Complexity at MIT, after China, Thailand, and the Philippines, but slightly ahead of Malaysia (Hausman et al. 2018). From 1986 to 2008, annual economic growth rates averaged over 7 percent (McCaig & Pavcnik 2013). Since 2009, observed growth rates for the national economy (as measured in terms of GDP) have exceeded projected growth rates (6.0% vs. 3.48% per year, respectively), with average per capita income projected to rise by nearly 50% by 2020 using a 2009 baseline (Hausman et al. 2018). Much of this growth is linked to and driven by
38
trade in goods exported by Vietnam, which have been rising steadily over the study period (2001-2015) and spiking more recently (2015-2016). Trade includes exports of goods derived from cash crops including agricultural commodities (e.g., starches / tapioca derived from cassava) and tree plantations (e.g., wood fiberboard from acacia).
1.4 Conclusion
The uplands of north-central Vietnam are a relatively less developed region of the state, inhabited by predominantly ethnic minority populations. These peoples have historically practiced a shifting cultivation system of land-use, which constitutes a rational adaptation to biophysical constraints and climate factors in this environment. They have existed on the margins of Vietnamese society in a state of relative isolation, partly attributable to seasonal constraints on connectivity without markets. Census data (2009) show a condition of relative socio-economic deprivation that is projected to change under conditions of increased
connectivity associated with the EWEC project upgrading Highway 9.
The chapter also presented theoretical frameworks relevant to understanding the ongoing process of agrarian transition in this area, in the context of ongoing, rapid growth of the
Vietnamese economy. On one hand, microeconomic dynamics of agricultural land-use espoused by von Thünen’s theory of land rent can help inform an understanding of changing patterns of land-cover explored in the next chapter. On the other, such local-scale processes cannot be understood in isolation from larger systems operating at meso-to-macro scales, for which a telecoupling perspective helps frame the growing influence of market forces. Such forces are practically mediated in an economic sense by urban centers, with cascading effects on rural areas and implications for traditional livelihoods. This multi-level process of market integration has
39
been driving change in land-use systems and land-cover in the study area particularly since 2007. The patterns and processes associated with such changes are explored further in the next chapter.