This is an author produced version of a paper published in Proceedings 42nd
Euromicro Conference on Software Engineering and Advanced Applications
SEAA 2016. This paper has been peer-reviewed but does not include the
final publisher proof-corrections or journal pagination.
Citation for the published paper:
Fabijan, Aleksander; Olsson Holmström, Helena; Bosch, Jan. (2016). Time to
Say 'Good Bye' : Feature Lifecycle. Proceedings 42nd Euromicro Conference
on Software Engineering and Advanced Applications SEAA 2016, p. null
URL: https://doi.org/10.1109/SEAA.2016.59
Publisher: IEEE
This document has been downloaded from MUEP (https://muep.mah.se) /
DIVA (https://mau.diva-portal.org).
Time to Say ‘Good Bye’: Feature Lifecycle
Aleksander Fabijan
Malmö University Faculty of Technology and Society
Malmö, Sweden aleksander.fabijan@mah.se
Helena Holmström Olsson
Malmö University Faculty of Technology and Society
Malmö, Sweden
helena.holmstrom.olsson@mah.se
Jan Bosch
Chalmers University of Technology Dep. of of Computer Science & Eng.
Göteborg, Sweden jan.bosch@chalmers.se Abstract— With continuous deployment of software
functionality, a constant flow of new features to products is enabled. Although new functionality has potential to deliver improvements and possibilities that were previously not available, it does not necessary generate business value. On the contrary, with fast and increasing system complexity that is associated with high operational costs, more waste than value risks to be created. Validating how much value a feature actually delivers, project how this value will change over time, and know when to remove the feature from the product are the challenges large software companies increasingly experience today. We propose and study the concept of a software feature lifecycle from a value point of view, i.e. how companies track feature value throughout the feature lifecycle. The contribution of this paper is a model that illustrates how to determine (1) when to add the feature to a product, (2) how to track and (3) project the value of the feature during the lifecycle, and how to (4) identify when a feature is obsolete and should be removed from the product.
Keywords—customer feedback; feature lifecycle; value modeling;
I. INTRODUCTION
Starting with agile development [1] and evolving towards Continuous Deployment [2], software companies seemingly improve existing functionality and deliver new features to products quicker than ever before. In this way, value is assumed to be generated to customers and users continuously with every update and deployment [2]. However, although companies are adopting techniques to validate the value of the features during development, shortly after and while they are being deployed [3], [4], [5], [6], [7], very little is known on how to track feature value over its lifetime and what actions to perform when a feature no longer adds value to the product.
As new software features are being introduced, existing products and features age and become over time less and less amenable to necessary adaptation and change [8], [9]. This process often results in higher maintenance cost and overall product complexity [10]. As a consequence, and what we explore in this paper, is that the value of the feature changes over time and, eventually, becomes negative. In that case, it is more beneficial for a company to remove the feature from the system than to keep maintaining it.
Based on the case study research in three large software companies, we study how feature value can be continuously validated during its lifetime and which actions to perform when
the value it delivers reaches or falls under a certain treshold. The contribution of this paper is is a model that illustrates how to determine (1) when to add the feature to a product, (2) how to track and (3) project the value of the feature during its lifetime, and how to (4) identify when a feature no longer adds value to the product and how it should be removed.
The remainder of this paper proceeds as follows. In section II we present the background on product lifecycle and prior research on feature value. In III, we describe our case companies and the research methodology that we applied in this paper. In section IV, we present the findings of this study and their challenges, which we adress in section V with the introduction of the feature lifecyle model. Finnaly, section VI discusses the conclusions and future work posibilities.
II. BACKGROUND
In software development a feature is a component of additional functionality, additional to the core software. Typically, features are added incrementally, at various stages in the lifecycle, usually by different groups of developers [11].
Ongoing expansion or addition of new features in software products, known also as feature creep or ‘featuritis’ , is a well seen pattern in software companies today, [12] [13], [14]. As new software features are being introduced, existing products and features age and become over time less and less amenable to necessary adaptation and change [8], [9]. Norman [15] recognized that software complexity increases as the square of the new features being introduced. Therefore, and in order to control the evolvement of a product and manage its development, we investigate product lifecycle management research literature.
A. Product Lifecycle
Product Lifecycle Management is a business activity of managing, in the most effective way, the product all the way across its lifecycle [16]. It is a process that starts with the very first idea about the product and lasts all the way throughout development and until its retirement. Altoug it is mainly associated with engineering tasks, it also involves marketing, product portfolio management [17] and new product development [18] activities.
A traditional product lifecycle consits of four stages i.e. the introduction, growth, maturity and decline [19]. In the introduction stage, the companies seek to build product awareness and identify the market and potential customers. The
value hypotheses about the features are proposed and being tested with potential customers, primarily with more qualitative feedback collection techniques such as interviews, focus groups and customer journeys [20].
During the growth, the companies strive for reaching a wider market share by expanding their products and introducing new functionality. Customer feedback is typically collected in prototyping sessions in which customers test the prototype, discuss it with the developers and user experience specialists. At the same time, the initial hypothesis about product value are updated with new information [20], [21].
When the product is in its mature stage, companies implement strategies to maintain the market share by e.g. promoting the differentiating functionality that attracts and locks the customers. And although the companies are aware that more than a half of the features that already exist in their products are never used [22], they increasingly invest into developing new functionality. This results in a situation where many features attract similar amount of attention and receives an equal amount of R&D investments. As a result, more and more legacy exists in products, and companies spend increasing amounts of effort and resources for managing the product and maintaining it [8], [9].
The decline stage is where the cost and interest of investing into functionality that is not appreciated by the customers is being paid. At this time, companies are aware that functionality in the products is costing more to be maintained as it delivers revenue and are forced to either reduce costs and continue to offer it, possibly to a loyal niche segment, or completely remove it from the portolio [19], [17].
And although the companies are aware that some features, at some point in time, cost more than what they add in terms of value, they do not have the data to support this and to understand when this happens. Assessing of feature value is, so far, an ad-hoc process with limited traceability and poor tool support [23].
B. Feature Value
Value from the customer point of view is an increasingly studied concept in the literature [24], [25], [26]. Porter’s [25] value chain framework, for example, analyzes value creation at the companies level that identifies the activities of the firm and then studies the economic implications of those activities. Hemilä et al. [26] divide the benefits of a product or a feature among four types, i.e. functional, economic, emotional and symbolic value.
Functional feature value focuses on the functionality and offerings. Traditionally, value preposition was based on the functional features of product or services. Here, the value for the customer is e.g. new feature in the product or an improvement of the existing solution. Economic feature value focuses on price. Here, customers are e.g. offered the product or service functionality under a lower price than before or compared to the competitor. Emotional feature value focuses on customer experience. The meanings of emotions and feelings have already been important in e.g. automotive industry. Today, however, they are increasingly becoming important also in the service system value creation. Symbolic
feature value Focus on meaning. In the last years, consumers increasingly prefer to purchase products that are produced from recyclable material or run on green energy.
To measure, asses and visualize how much of value a feature delivers over time, multiple approaches are seen in the literature. The single metric approach described by Roy [27] treats feature value as a weighted combination of objectives and is highly desired and recommended for situations with a clear strategy. A single metric forces tradeoffs to be made once for multiple goals and aligns the organization behind a clear objective [3]. On the other hand, and when there are multiple strategies in the company, Kaplan et al. [28] suggests a balanced scorecard approach. This approach is valuable when there are multiple objectives in the companies’ strategy and need to be fulfilled independently [29]. These objectives can then be linked back to organizational strategies using, for example, GQM+ concepts [30].
In this paper, however, we recognize that despite the awareness of the increasing system complexity, feature value is not being systematically and continuously validated. This results in a situation where features are never removed and start to have, after a certain time, a negative effect on the product. We propose a concept of ‘feature lifecycle’ to demonstrate how the value of a feature in connected products can be assessed over time in order to be more proactive in conducting feature management decisions. The contribution of this paper is is a model that illustrates how to determine to add the feature to a product, how to track and project the value of the feature during the lifecycle, and how to identify when a feature is obsolete and should be removed from the product.
III. RESEARCH METHOD
This research builds on an ongoing work with three case companies involved in large-scale development of software products and it was conducted between August 2015 and December 2015. For the purpose of this research, we selected the case study methodology as an empirical method [31]. Since research in software engineering is to a large extent a multidisciplinary area aimed to investigate how development and maintenance of software features is conducted from a value point of view, we found the case study approach appropriate for this research [31]. To objectively obtain the detailed information on how companies perceive feature lifecycles, track and validated feature value, a real world setting was required.
Based on experience from previous projects on how to advance in continuous validation of customer value [6], [4], we held three separate workshops with each of the companies individually. After the workshops, we performed an interview study in which we met with a total of 22 people from the companies involved in this study. We list the participants and their roles in Table 1 below.
DESCRIPTION OF THE COMPANIES AND REPRESENTATIVES.
Company and their domain Representatives
Company A is a provider of telecommunication systems and equipment, communications networks and multimedia solutions for mobile and fixed network operators. The company has approximately 25.000 Employees in R&D.
Participants marked with an asterisk (*) attended the workshop and were not available for a follow up-interview.
1 Product Owner 1 Product Manager 2 System Managers 2 Software Engineer 1 Release Manager 1 Area Prod. Mng.* 1 Lean Coach* 1 Section Mng.* Company B is a software company specializing
in navigational information and optimization solutions. Company B has approximately 3.000 Employees in R&D.
All workshop participants were interviewed.
1 Product Owner 1 System Architect 1 UX Designer 1 Service Manager Company C is a manufacturer and supplier of
transport solutions construction technology and vehicles for commercial use. The company has approximately 20.000 Employees in R&D. All the participants that attended the workshop were interviewed. In addition, a sales manager and one technology specialist were interviewed.
1 Product Owner 2 Product Strategists 2 UX Managers 2 Function Owners 1 Feature Coord. 1 Sales Manager 2 Technology Spec. A. Data Collection
During the group workshops with the companies, we were always three researchers sharing the responsibility of asking questions and facilitating the group discussion. Notes were taken by two of the researches. After each of the workshops, the notes were consolidated and shared to the third researcher.
We held semi-structured group interviews with open-ended questions [31]. These questions were asked by one of the researcher while two of the researchers were taking notes. In addition to the workshops, we conducted 22 interviews that lasted one hour and were primarily recorded using an iPhone Memo recording app. Individual Interviews were conducted and transcribed by one of the researchers. In total, we collected 13 pages of workshop notes, 138 pages of interview transcriptions, and 9 graphical illustrations from the interviewees. All workshops and individual interviews were conducted in English and lasted three and one hour respectively.
B. Data Analysis
During analysis, the workshop notes, interview transcriptions and graphical illustrations were used when coding the data. The data collected were analyzed following the conventional qualitative content analysis approach [32] where we derived the codes directly from the text data. This type of design is appropriate when striving to describe a phenomenon where existing theory or research literature is limited. Two of the researchers first independently and then jointly analyzed the collected data and derived the final codes that were consolidated with the third and independent researcher who also participated at the workshops. For example, when the interviewee referred to value of the feature, we marked this text and labelled it with a code ‘feature value’. Similarly, we labelled the remainder of our interview transcriptions. As soon as any questions or potential misunderstandings occurred, we verified the information with
the other researcher and participating representatives from the companies.
C. Validity considerations
Construct validity: We conducted two types of interviews.
First, the group semi-structured interviews at the workshops and second, individual interviews with representatives working in several different roles and companies. This enabled us to ask clarifying questions, prevent misinterpretations, and study the phenomena from different angles. We combined the workshop interviews data with individual interviews. Two researchers, guaranteeing inter-rater reliability, independently assessed the notes. And since this study builds on ongoing work on feature value tracking and validation throughout the product lifecycle, the overall expectations between the researchers and company representatives were aligned and well understood upfront.
External validity: The results of the validation cannot directly
translate to other companies. However, and since these companies represent the current state of large-scale software development of embedded systems industry [6], [4] we believe that the results can be generalized to other large-scale software development companies.
IV. FINDINGS
In this section, we present our empirical findings. In accordance with our research interests, we first outline the current state of assessing feature value throughout the feature lifecycle in our three case companies. Second, we list the challenges that are associated with these practices. We support each of the sections with illustrative quotes from our case companies.
A. Current State
In the case companies the value of the features is being assessed unsystematically and ad-hoc. Consequently, features are added to the product when they are built and removed when the management assumes no one uses them.
• Tracking of feature value: Our case companies collect customer feedback as distinct points in the development cycle. They aggregate these data to build an understanding of feature value at feature prioritization time and after it is deployed in the field. However, and although various roles posses the partial data about individual values of the feature, they do not consolidate this information or monitor how it changes over time. As a consequence, and since every team looks at a different factor of the feature, the value differs throughout the organization, teams and units. An objective measure of the value is thus never calculated, leaving the organizations with several different understandings of feature value for every factor that they analyze it for. This situation is illustrated in the following quotes:
“The problem is that I don’t really see all the counters explicitly… I only see some specific parameters. It is not really all.” – System Manager from Company A.
• Adding features to products: Our case companies continuously develop new features for their products. To validate the prototypes and steer development, they extensively collect customer feedback from the customers, users of the product, and directly from the products. When the development is done, this success typically becomes celebrated with as early deployment to the customers as possible.
“When things are working good, we are having a
launching customer.” – System Architect from Company B
• Feature value is assessed ad-hoc: Initially validated value of the feature after its completion of development and deployment is assumed to remain near constant throughout its lifecycle. The next time the value of the feature is assessed again is when a customer experiences a problem with the feature.
“Normally we take the results that we see if we really deviate in one area, we hear it from customers”
– Product Strategists from Company C.
• Features are seldom removed from the products: Once the features are build and deployed to the customer, they typically stay in the product. This causes the companies an increase in complexity and expenses for operations of the product.
“We could remove features. To remove the complexity! We are always increasing the complexity and that is a big problem.” – System Manager from Company A.
B. Challenges
Based on our interviews, we see that there are a number of challenges associated with not being able to continuously asses feature value throughout its lifecycle. For example, our interviewees all report difficulties in identifying the value of the feature and using this information to identify the next actions, i.e. when to deploy the functionality or remove it from the system.
• Tracking and projecting feature value over time: Since there is no traceability between one measurement of feature value and the second one, knowing whether a new version of the feature is better or not is not intuitive. This situation is illustrated in the following quotes:
“We get feature which is broken down and then this value somehow got lost when it was broken down.”
– Software engineer from Company B.
“I would like to be able to provide the sales force with more description of the actual features products benefits services in a simple speech, but also the quantitative figures, in what situation, what segment…”
- Sales manager from Company C.
• Identifying when it is valuable to deploy features: Although the principles of lean methodology stress early deployments and learnings, features should be deployed not when they are ready but when it is valuable to do so, i.e. when they will deliver value greater than a certain threshold defined by the strategy. Since the traceability of feature value is limited, features in our case companies are deployed even though they don’t deliver enough value in that moment. We illustrate this situation in the following quote:
“It would be great if we could draw those possibilities on a whiteboard and get the percentage.”
- Product Manager from Company A
• Identifying when to remove features from the product: Due to a lack of objectively assessing feature value and projecting it over time, it is very difficulty for our case companies to know when the feature does not deliver any more value as it costs to have it in the product. Consequently, removing the features from the product is done unsystematically and with consequences. Moreover, our case companies report that features stay in the products even though they are aware that no one is using them, buying the product because of them, or serve any compliance purpose. This situation is illustrated in the following quotes:
“A developer wants to know if the code is being used so he knows if he or she can remove the code. How big the impact will be or what value should we set for that.
- Software Engineer from Company A
“Can we obsolete certain parts of the system that we maintain for backward compatibility reasons but maybe they are not used or maybe they can be replaced by something else?”
- Service Manager from Company B
“
If we go 5 years back, we see that we have many features that have never been tested or used. It is a beauty contest.”- Product Owner from Company A
V. FEATURE LIFECYCLE MODEL
To assess feature value and model how to track it over its lifecycle, we first provide a feature value equation. Based on a single metric approach that consolidates multiple factors, this equation captures quantitative value for features in their lifetime. Second, we present the general feature lifecycle model as a function of value equation over a typical lifetime of a feature.
A. Feature Value Equation
Typically, companies initiate new feature development with a strategy decision. At this time, high-level requirements yield an idea about the feature purpose and what the net benefits will be for the company when this particular feature is in the product.
We describe the calculation of feature value ‘V’ over time ‘t’ as a single metric approach and define it as a matrix product between value factors ‘F’, their relative weights ‘W’ and an interaction matrix ‘I’. We illustrate this with Equation 1 below. 𝑉(𝑡)%×% = (𝐹(𝑡)%×) ∙ 𝑊 𝑡 )×%) ∙ 𝐼%×% Equation 1. The number of lines ‘i’ in factor Matrix ‘F’ equals to the number of features being assessed. Every line ‘i’ in matrix ‘F’ contains factors that relate to feature ‘i’. The number of columns ‘j’ equals to the number of these factors that constitute feature value. They originate from the Key Performance Indicators (KPIs) and high-level strategy guidelines that are available within the organization, and need to be normalized Examples of these factors are capacity, system load, latency, net profit, market demand, feature usage, etc. Previous researchers abstract these factors and distinguish, as we describe above, between four different types: Functional, Economic, Emotional and Symbolic [26]. In our model, and in order to be aligned with the distinction, we recommend arranging related factors in matrix ‘F’ together (i.e. keeping columns that resemble functional value on the beginning of the matrix, followed by columns with factors that resemble economic, emotional and symbolic value).
Since not all of the factors are of equal importance, we weigh them with the corresponding column from matrix ‘W’. In each column in ‘W’, the weights represent the relative importance of each of the factors for a certain value. Although the weights can differ throughout the matrix ‘W’ (e.g. a certain factor can have more importance for one feature, and another factor for yet another feature), the weights are required to be allocated in a normalized fashion. Consequently, the sum of values in every column in matrix ‘W’ equals to one.
We name the third matrix to be the interaction matrix ‘I’. Features are typically developed and tested in isolation, or with a particular product use-case. However, when several features are added to a product, there may be interactions (i.e. behavioral modifications) between both the features already in the product, as well as with features in a related product. And although the focus of this research is not to study how features interact with each other (for that see e.g. [11], [33]), we believe that the possibility to take the interaction into the calculation of the feature value should exist. When the interaction is non-existent, i.e. between features that do not change the behavior of each other, the interaction matrix is an identify matrix (ones in the diagonal and zeroes elsewhere). On the other hand, when the interaction is recognized, the relative contribution between pairs of features increases from zero to the percentage detected in the interaction.
We provide an example calculation of feature value using Equation 1 for three features that do not interact with each-other on Fig 1. below.
Fig. 1. An example calculation of feature value using Equation 1.
In this example, and by using standard matrix multiplication between the factor matrix ‘F’ weight matrix W, the factor line ‘F11, F12, F13’ is multiplied with its relative importance column ‘W11, W21, Wi3’. The result is a square matrix multiplied with an interaction matrix. The later in this particular case is an identity matrix as no interaction is assumed. The result is an array of values ‘V1, V2, V3’ for every feature. Should there be interaction between features, the final calculation would capture the proportion of the interaction in each of the values due to the matrix multiplication effect.
B. Feature Lifecycle Model
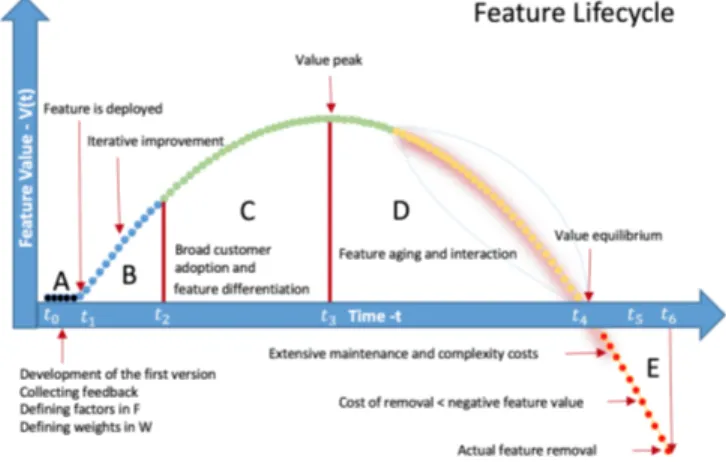
In this paper, we focus on how value of a feautre changes over time and what actions can be taken at certain milestones. We illustrate an example lifecylce of a typical software feature on Figure 2 below. On the horizontal axis we list the most important milestones in a feature lifecycle i.e. feature development start – t0, first deployment – t1, adoption – t2, peak – t3, equalibrium – t4, removal optimum – t5 and finally, the removal of the feature – t6.
On the vertical axis, we plot feature value over its lifecycle. Although illustrated as a parabolic arc for a better presentation, dotted lines around the descending curve on Figure 2 should remind the reader that in practice the value does not neccesarly increase or descend as an exact parabolic function of time. Time segments between value changes can be shorter or longer, depending on practitioners development practices, feature feedback collection intensity etc. Consequently, the value of the function may alternate to a certain extent within the segments, both due to the development practices and natural variaton of the collected data.
Fig. 2. Feature Lifecycle Model.
We describe the segments of the feature lifecycle model, which we label on Fig. 1 with A-E, in the paragraphs below.
A – Feature Infancy: In the early phases of pre-development,
companies start to construct an understanding of what will the value of the feature constitute of. We label the time t0 to be the moment in time when feature first appears at the strategy level, where early hypotheses are being formed. During the period A, which lasts from the moment t0 until the feature is deployed to the first customer t1, companies collect qualitative customer feedback using customer journeys, interviews, questionnaires and survey forms to hypothesize what their customers’ needs
are. At this stage, contextual information on the purpose of the feature with functional characteristics and means of use are typically collected by customer representatives. Typically, this information is used to form functional value requirements of the feature, which translate to factors ‘F’ in Equation 1. At the same time as the factors are defined, weights in ‘W’ are determined. For example, if the feature is facing the user, more weight might be assigned to usability, experience and similar factors. On the other hand, and if the feature being modeled is satisfying a regulation, usability and experience receive less weight, which is instead assigned to i.e. compliancy.
The development units in the company develop early prototypes of the feature and measure how close the realized product is in comparison to the requirements. Since no customer is actually using the feature in this period A, no value for the company is generated (illustrated with a flat line on Fig. 1).
B - Feature Deployment: When a minimal feature instance is
developed to the extent that it can be validated, practicioners can deploy it to a test customer, and for the first time, asses how well their implementations realize the expectations in the field. Typically, at this moment companies would deploy the feature in a ‘silent mode’ to the customers to maitaint integrity and activate it incrementally with the test customer. We label the point in time when the first real customers adopts the feature with t1. The feedback at this moment is typically mixed and needs to be quantified. Typically, it consists of both qualitative information on e.g. design decisions and quantitative operational data [20]. With new input, the values of the factors in matrix ‘F’ are continiously updated using the quantified customer input. As a result, practitioners get feedback on product behaviors and initial performance data that can be used to calculate the current value of the feature.
C – Feature Inflation: After the first deployment t1, customer
adoption of the feature intensifies. Companies strive to provide marginal improvements that will differentiate them from the competitors. For this purpose, they continuously experiment with the customers to identify the version of the feature that delivers the most value. New iterations of the feature are continuously deployed and controlled A/B experiments can be performed to identify the gain [20], [34]. Due to the approach in Equation 1 with a single metric that forces tradeoffs to be made once for multiple goals, companies are enabled to determine whether the incremental improvement actually delivers more value compared to the version before [3]. Again, and with new input, the values of the factors in matrix F need to be continiously updated using the customer feedback. The feature development stops completely at the moment when there is no statistical diffrence in feature value between sequential iterative versions of the feature.
D – Feature Recession: Customers will typically stop paying
for existing features in favour of something newer and better. At a certain point in time, the value of the function will reach the peak, which we label on Fig.1 as t3. Finding the maximum of the value function is the goal of mathematical optimization. And since feature value is calculated on an ongoing basis, companies can store the historical values and use them for projectiong trends. By identifying the equation of the curve
using e.g. polynomial regresion, practicioners can find the point when the value starts to steadily deacline. The peak value
t3 is the point where the first derivative of the regresion
function eauals to zero and the second derivative is neagtive. From hereafter, the directional coeficient of the first derivative is negative, projecting a decline of feature value.
There may be several reasons for the value of a function to start steadily decreasing. Although the aim of this research is to confirm this phenomenon and not to address its causes, we name a few of them. Features age and occasionally loose their purpose over time. Customers might churn to the competitors or use existing alternative functionality. Also, and since new features are increasingly being introduced to the product, existing features get replaced or even interact negatively with the new ones [33]. Consequently, they cause increase in operational expenses [8], [9].
As an example of reducing system complexity and consequently, lowering the costs of the operation, companies might consider to start commoditizing and opening the features to a wider community [10]. By open-sourcing the features, resources are freed from maintenance and support. Consequently, and by lowering the operational costs, the derivative of the value function becomes less negative, which enables maintaining the value of the feature at a higher level for a longer time (the slope after t3 in Fig 2 is decreasing at a slower pace).
E – Feature Removal: Regardless of the restructuring and
efforts made into reducing feature costs, the value of the feature essentially becomes equal to the costs of its operation and maintenance. We label this point in time on Fig. 2 as t4 - value equilibrium. Although not yet costing, product management should already consider ways of removing this feature from the product. Ultimately, product managers should seek to identify any feature whose removal would have no impact on the value of the overall product. When the monetary value of the feature falls bellow the maintaining and supporting cost, as the feature presents a liability to the product and detracts the customers from other value-adding features. At this time, and until point in time t5, the cost of removal of the feature is lower or equal to the operational costs of the feature. The point t5 is the point in time where the cost of removal a feature is lower as the interest the company will pay by not removing the feature after this time.
VI. DISCUSSION
Ongoing expansion and addition of new features in software products, is a well seen pattern in software companies today [12] [13], [14]. With many new featrues being introduced on a continous basis, existing features age and become over time less and less amenable to necessary adaptation and change [8], [9]. And although the companies are aware that some features, at some point in time, cost more than what they add in terms of value, they do not have the data to support this and to understand when this happens. Assessing feature value has, so far, been an ad-hoc process with limited traceability and poor tool support [23]. As a consequence, companies do not deploy features when they deliver value or remove them from the product when they stop being valuable.
In response to the challenges and implications presented above, we suggest the feature lifecycle model. There, we illustrate how feature value can be defined as a linear combination of factors and weights and validated over time. This helps companies in knowing when to deploy a feature or remove it from a product. In particular, the model helps companies with:
1) Validating feature value over time: The single metric
approach in our value equation is a compact method of combining feature factors that constitute the value of the feature with their weights. In particular, this approach allows that there might be several variables that constitute feature value (factors), each with a different importance (weight). Moreover, the model combines in a single metric weights and factors for multiple features, taking into consideration the possibilities with alternating weights and feature interaction. As a result, the equation yields feature value as numbers which are effortless to compare in-between. This is especially useful in situations when smaller increments of the feature are being tested and product management requires fast-feedback whether the new increment actually delivers more value in comparison to the old versions of the feature.
2) Projecting feature value over time: By accumulating
feature value that was calculated using our model, practicioners are enabled to use the data to project future trends. For this, several supervised machine learning algorithms can be used. Polynomial regressios, which we mention in our paper is one of them. Essentially, the projection of feature value can both help companies to better plan their resources for possible feature maitenance or removal, as well as to better estimate the future gain or loss of value.
3) Deploying features when it is valuable to do so: With a
clear calculation of feature value using a single metric, companies can deploy features when they deliver the value, instead of when they are developed. Our model suggest the deployment in a ‘silent mode’ to allow for a timely validation with test customers and revelaing the feature at other customers only when its value is above a treshold defined by the strategy. By projecting feature value over time, the pracitcioners are better aware how they are progressing and which factors require more attention.
4) Removing features from the product: The feature lifecyle model raises awareness about software features and changes the perceptionabout their lifecycle. It illustrates that the value of the feature not only drops over time, but also becomes negative. The model helps practicioners to identify when the equlibrium will change to imbalance, costing the product and organization. In particular, it enables practicioners to plan the removal before the negative value of the feature costs more than the actual process of removing the feature.
VII. CONCLUSIONS AND FUTURE WORK
With continuous deployment of software features, a constant flow of new features to products is enabled. As a result, and with fast and increasing system complexity that is associated with high operational costs, more waste than value risks to be created over time.
To help companies asses feature value throughout the lifecycle, and to avoid situations with features in products with negative impact, we propose and study the concept of a software feature lifecycle from a value point of view. Based on the three case companies, we demonstrate how to track feature value throughout its lifecycle. The contribution of this paper is a model that illustrates a feature lifecylce. It helps companies to determine (1) when to add a feature to the product, (2) how to track and (3) project the value of the feature during the lifecycle, and how to (4) identify when a feature is obsolete and should be removed from the product.
In future work, we intend to (I) detail the feature lifecylce model by studying the differences in feature value between distinct types of features (e.g. commodity features vs. innovative features), and (II) validate our feature lifecycle model in other software intensive companies.
REFERENCES
[1] R. C. Martin, Agile Software Development, Principles,
Patterns, and Practices. 2002.
[2] P. Rodríguez, A. Haghighatkhah, L. E. Lwakatare, S. Teppola, T. Suomalainen, J. Eskeli, T. Karvonen, P. Kuvaja, J. M. Verner, and M. Oivo, “Continuous Deployment of Software Intensive Products and Services: A Systematic Mapping Study,” J. Syst. Softw., 2015.
[3] R. Kohavi, R. Longbotham, D. Sommerfield, and R. M. Henne, “Controlled experiments on the web: Survey and practical guide,” Data Min. Knowl. Discov., vol. 18, pp. 140–181, 2009.
[4] A. Fabijan, H. H. Olsson, and J. Bosch, “Early Value Argumentation and Prediction : an Iterative Approach to Quantifying Feature Value,” in Product-Focused
Software Process Improvement, 2015, vol. 9459, pp. 16–
23.
[5] F. Fagerholm, H. Mäenpää, and J. Münch, “Building Blocks for Continuous Experimentation Categories and Subject Descriptors,” pp. 26–35, 2014.
[6] H. H. Olsson and J. Bosch, “Towards Continuous Customer Validation : A conceptual model for combining qualitative customer feedback with
quantitative customer observation,” LNBIP, vol. 210, pp. 154–166, 2015.
[7] E. Ries, The Lean Startup: How Today’s Entrepreneurs
Use Continuous Innovation to Create Radically Successful Businesses. 2011.
[8] D. L. Parnas, “Software aging,” 16th Int. Conf. Softw.
Eng., pp. 279–287, 1994.
[9] D. E. Perry and A. L. Wolf, “Foundations for the study of software architecture,” ACM SIGSOFT Softw. Eng.
[10] J. Bosch, “Achieving Simplicity with the Three-Layer Product Model,” Computer (Long. Beach. Calif)., vol. 46, no. 11, pp. 34–39, Nov. 2013.
[11] M. Calder, M. Kolberg, E. H. Magill, and S. Reiff-Marganiec, “Feature interaction: A critical review and considered forecast,” Computer Networks, vol. 41, no. 1. pp. 115–141, 2003.
[12] J. M. Sullivan, “Impediments to and Incentives for Automation in the Air Force,” in Proceedings of ISTAS
2005, International Symposium on Technology and Society. Weapons and Wires: Prevention and Safety in a Time of Fear, 2005, pp. 102–110.
[13] E. Lindgren and J. Münch, Software development as an
experiment system: A qualitative survey on the state of the practice, vol. 212. Cham: Springer International
Publishing, 2015.
[14] H. H. Olsson, H. Alahyari, and J. Bosch, “Climbing the ‘Stairway to heaven’ - A mulitiple-case study exploring barriers in the transition from agile development towards continuous deployment of software,” in Proceedings -
38th EUROMICRO Conference on Software Engineering and Advanced Applications, SEAA 2012, 2012, pp. 392–
399.
[15] D. A. Norman, The Design of Everyday Things, vol. 16, no. 4. 2002.
[16] J. Stark, Product Lifecycle Management. Cham: Springer International Publishing, 2015.
[17] R. G. Cooper, S. J. Edgett, and E. J. Kleinschmidt, “New product portfolio management: practices and
performance,” J. Prod. Innov. Manag., vol. 16, no. 4, pp. 333–351, 1999.
[18] D. Leonard-Barton, “Core capabilities and core rigidities: A paradox in managing new product
development,” Strateg. Manag. J., vol. 13, pp. 111–125, 1992.
[19] L. Gorchels, The Product Manager’s Handbook. 2000. [20] A. Fabijan, H. H. Olsson, and J. Bosch, “Customer
Feedback and Data Collection Techniques in Software R&D: A Literature Review,” Softw. Business, Icsob
2015, vol. 210, pp. 139–153, 2015.
[21] S. E. Sampson, “Ramifications of Monitoring Service Quality Through Passively Solicited Customer Feedback,” Decis. Sci., vol. 27, no. 4, pp. 601–622, 1996.
[22] D. Cohen, G. Larson, and B. Ware, “Improving software investments through requirements validation,” Proc. 26th
Annu. NASA Goddard Softw. Eng. Work., pp. 106–114,
2001.
[23] A. Fabijan, H. H. Olsson, and J. Bosch, “The Lack of
Sharing of Customer Data in Large Software Organizations: Challenges and Implications,” in
accepted to: 17th International Conference on Agile Software Development XP2016, 2016.
[24] A. F. Payne, K. Storbacka, and P. Frow, “Managing the co-creation of value,” J. Acad. Mark. Sci., vol. 36, no. 1, pp. 83–96, 2008.
[25] M. E. Porter, “Competitive Advantage,” Strategic
Management, vol. May-June. pp. 1–580, 1985.
[26] J. Hemilä, J. Vilko, E. Kallionpää, and J. Rantala, “Value creation in product-service supply networks,” in The
Proceedings of 19th International Symposium on Logistics (ISL 2014), 6.-9.7.2014., Ho Chi Minh City, Vietnam, Nottingham University Business School, 2014,
pp. 168–175.
[27] R. Roy, “Design of Experiments Using the Taguchi Approach.pdf,” Technometrics, vol. 44, no. 3. pp. 289– 289, 2001.
[28] R. S. Kaplan and D. P. Norton, “The Balanced Scorecard: Translating Strategy Into Action,” Harvard
Business School Press. pp. 1–311, 1996.
[29] J. S. Pinegar, “What Customers Want: Using Outcome-Driven Innovation to Create Breakthrough Products and Services by Anthony W. Ulwick,” J. Prod. Innov.
Manag., vol. 23, no. 5, pp. 464–466, 2006.
[30] V. Basili, J. Heidrich, M. Lindvall, J. Münch, M. Regardie, and A. Trendowicz, “GQM+Strategies - Aligning business strategies with software measurement,” in Proceedings - 1st International
Symposium on Empirical Software Engineering and Measurement, ESEM 2007, 2007, pp. 488–490.
[31] P. Runeson and M. Höst, “Guidelines for conducting and reporting case study research in software engineering,”
Empir. Softw. Eng., vol. 14, no. 2, pp. 131 – 164, 2008.
[32] H.-F. Hsieh and S. E. Shannon, “Three approaches to qualitative content analysis.,” Qual. Health Res., vol. 15, no. 9, pp. 1277–88, Nov. 2005.
[33] M. Jackson and M. Pamela Zave, “Distributed feature composition: A virtual architecture for
telecommunications services,” IEEE Trans. Softw. Eng., vol. 24, no. 10, pp. 831–847, 1998.
[34] P. Bosch-Sijtsema and J. Bosch, “User Involvement throughout the Innovation Process in High-Tech Industries,” J. Prod. Innov. Manag., pp. 1–36, 2014.