Rapport 17 - 2015
Undeclared milk, peanut,
hazelnut or egg
-
guide on how to assess the risk
of allergic reactions in the population
by Ylva Sjögren BolinTable of content
Introduction ... 2
Sammanfattning ... 3
Aims and restrictions... 4
Doses of proteins that trigger allergic reactions ... 4
Dose, allergen concentration and food consumption. ... 5
Food consumption data ... 5
Dose and population risk ... 6
Milk protein allergy... 7
Hazard identification and characterization ... 7
Doses of milk protein in relation to population risk ... 7
Methods for analyses of milk proteins: ... 8
Examples of risk assessments regarding undeclared milk in chocolate and crisp bread ... 8
Factors of uncertainty regarding the risk assessment ... 9
Conclusion ... 10
Peanut Allergy ... 11
Hazard identification and characterization ... 11
Doses of peanut protein in relation to population risk ... 11
Method for analysing peanut ... 12
Example of risk assessments regarding undeclared peanut in chocolate ... 12
Factors of uncertainty regarding the risk assessment ... 12
Conclusion ... 13
Hazelnut allergy ... 14
Hazard identification and characterization ... 14
Doses of hazelnut protein in relation to population risk ... 14
Method for analysing hazelnut ... 15
Example of a risk assessment regarding undeclared hazelnut in bread ... 15
Factors of uncertainty regarding the risk assessment ... 16
Conclusion ... 16
Egg allergy ... 17
Hazard identification and characterization ... 17
Doses of egg protein in relation to population risk ... 17
Method for analysing egg white proteins ... 18
Example of a risk assessment regarding undeclared egg in pie (dessert) ... 18
Factors of uncertainty regarding the risk assessment ... 18
Conclusion ... 19
Overall conclusion ... 20
Acknowledgement... 20
Introduction
Food allergens are substances (often proteins) that commonly cause allergic reac-tions or other hypersensitivity reacreac-tions. Inadequate labelling of food allergens such as milk, egg and different nuts can cause severe health problems for allergic individuals. The symptoms of an allergic reaction vary from mild to severe and can involve one or several organs such as the skin, stomach and airways. The most severe symptom is anaphylactic shock, which can lead to death.
Labelling of allergens is regulated by the Food Information Regulation (EU) No 1169/20111. Milk, peanut, hazelnut and egg are listed in Annex II of 1169/2011
together with other allergenic substances that have to be declared in the labelling. A prepacked food that contains an undeclared ingredient listed in Annex II is clas-sified as an unsafe food according to article 14.3 b in Regulation (EC) No 178/ 2002.2,3 It is within the responsibility of the food business operator that the food
which it has imported, produced, processed, manufactured or distributed is safe for human consumption.
During autumn 2015 a Nordic food control project regarding undeclared allergens will be conducted in Sweden, Denmark, Finland and Norway. Samples of prod-ucts are collected with subsequent chemical analyses of milk protein (casein), peanut, hazelnut and egg white protein. Undeclared allergens might be found in products controlled during the project and this report will serve as a guide regard-ing how to assess the risk to allergic consumers if a certain food product is con-taminated with milk, peanut, hazelnut or egg. The full report from the Nordic food control project will be published by the The Nordic Council of Ministers during 2016. This guide is however not restricted to the Nordic food control project and the guide can therefore be used to assess the risk other food products might consti-tute.
1 Regulation (EU) No 1169/2011 of the European Parliament and of the Council of 25 October
2011 on the provision of food information to consumers.
2 Regulation (EC) No 178/2002 of the European Parliament and of the Council of 28 January 2002
laying down the general principles and requirements of food law, establishing the European Food Safety Authority and laying down procedures in matters of food safety.
3 GUIDANCE ON THE IMPLEMENTATION OF ARTICLES 11, 12, 14, 17, 18, 19
AND 20 OF REGULATION (EC) N° 178/2002 ON GENERAL FOODLAW. CONCLUSIONS OF THE STANDING COMMITTEE ON THE FOOD CHAIN AND ANIMAL HEALTH
Sammanfattning
Allergener är ämnen, ofta proteiner, som orsakar allergiska reaktioner eller andra överkänslighetsreaktioner. Ofullständig märkning av allergener som mjölk, ägg och olika nötter leder till att personer med allergi och annan överkänslighet inte kan välja bort de livsmedel som gör dom sjuka. Allergiska reaktioner kan yttra sig som kräkningar, astma, eksem och livshotande anafylaktisk chock. Korrekt märk-ning av allergena ingredienser är därför väsentligt och finns reglerat i Förordmärk-ning (EU) nr 1169/20114. Det är livsmedelsföretaget som ansvarar för att de livsmedel
de producerar eller importerar är säkra att konsumera.
Allergener kan förekomma oavsiktlig i livsmedel genom att livsmedel och/eller råvaror kontamineras under framställningsprocessen. Denna rapport är en riskvär-deringsguide som syftar till att beskriva hur en riskvärdering ska gå till när de odeklarerade allergenen mjölk, jordnöt, hasselnöt eller ägg påvisas i vissa sorters livsmedel. Allergi mot mjölk, jordnöt, hasselnöt och ägg är de vanligaste matal-lergierna i norra Europa. Dessa allergen är också de vanligaste orsakerna till svåra anafylaktiska reaktioner. Beräkningarna gör det möjligt att uppskatta den risk ett kontaminerat livsmedel utgör bland allergiker och hos befolkningen i stort.
till-Aims and restrictions
The aim is to describe how a risk assessment should be performed when unde-clared milk (casein), peanut, hazelnut or egg in certain food products is found. The risk assessment is restricted to IgE-mediated allergy to cow´s milk, peanut, hazelnut and egg. The purpose of this risk assessment is not to describe a NOAEL (no-observed adverse-effect level) of allergens but is to describe how calculations can be performed in order to investigate whether a certain food product contains proteins in concentrations that could lead to an intake of a dose that elicits reac-tions in one or ten percent of the most sensitive allergic individuals (ED01 and ED10, respectively). The ED01 and ED10 for the different allergens milk protein, peanut protein, hazelnut protein and egg protein are described in separate chap-ters.
Doses of proteins that trigger allergic
reactions
Allergic individuals show a high variability regarding both which allergic symp-tom/s they react with as well as to which dose they react. The doses of milk, pea-nut, hazelnut and egg proteins that different allergic individuals react to vary be-tween micrograms and grams (1). Double blind placebo controlled food challeng-es (DBPCFC) are the standard method for tchalleng-esting at which dose an allergic indi-vidual reacts. Data from such DBPCFC can be used to calculate eliciting doses at both individual and at population level. Different definitions, regarding allergen doses, are listed below (1,2).
NOAEL = no-observed-adverse-effect level. The highest tested dose that does not trigger an adverse reaction.
LOAEL = lowest-observed-adverse-effect-level. The lowest tested dose that does trigger an adverse reaction.
MED = minimum eliciting dose and MOED = minimum observed eliciting dose are similar to LOAEL but MED/MOED are rather used for allergens and LOAEL for chemicals.
ED01= population-based eliciting dose. A mathematical model is used to calcu-late the dose that one percent of allergic individuals will react to.
Allergen concentration (mg/kg) * Consumed amount (kg)
= Dose (mg)
ED10 = population-based eliciting dose. A mathematical model is used to calcu-late the dose that ten percent of allergic individuals will react to.
Dose, allergen concentration and food consumption.
The dose the allergic individual is exposed to depends on the concentration of the allergen (protein) in the compound food as well as the amount of food consumed. To calculate the dose, allergen concentration data (obtained from chemical analy-sis) can be multiplied with food consumption data.
Food consumption data
The food products listed below are those that have most commonly caused aller-gic reactions due to allergens being wrongly declared or due to cross contamina-tion (3).
1. Chocolate/sweets 2. Bread
3. Pastries e.g. cinnamon buns
4. Fish and meat products (constituting part of a meal), e.g. meatballs, surimi. 5. Ready-made meals (constituting a meal), e.g. lasagne.
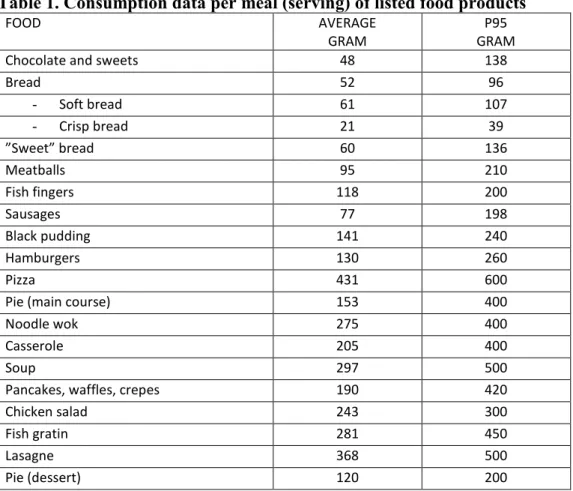
As food allergy is an acute reaction to the intake of a food, consumption data used should be data from one eating occasion (meal). Table 1 describes the average and the 95th percentile of the amount of certain food products consumed by Swedish
adults during one meal. The consumption data is from a Swedish food consump-tion study performed on adults (4). The 95th percentile is recommended as it will
also cover individuals who eat a large quantity of a product and it will thus serve as a safety factor. The calculated dose can then be compared to the listed ED01 and ED10 (see the chapters on milk, peanut, hazelnut and egg allergy, respective-ly).
Table 1. Consumption data per meal (serving) of listed food products
FOOD AVERAGE
GRAM GRAM P95
Chocolate and sweets 48 138
Bread 52 96 - Soft bread 61 107 - Crisp bread 21 39 ”Sweet” bread 60 136 Meatballs 95 210 Fish fingers 118 200 Sausages 77 198 Black pudding 141 240 Hamburgers 130 260 Pizza 431 600
Pie (main course) 153 400
Noodle wok 275 400
Casserole 205 400
Soup 297 500
Pancakes, waffles, crepes 190 420
Chicken salad 243 300
Fish gratin 281 450
Lasagne 368 500
Pie (dessert) 120 200
Food consumption data from (4). Average amount per meal of the different food products consumed
by Swedish adults. The 95th percentile is also described.
Dose and population risk
The allergenic risk increases with the severity of the symptoms of a reaction as well as with the number of individuals who might react. On a population level, exposure to a higher dose increases the risk of a higher number of allergic indi-viduals reacting. Doses of milk protein above the ED10 are estimated to cause a reaction in more than ten percent of milk allergic individuals. Doses of milk protein between the ED01and ED10are estimated to cause a reaction in one to ten percent of milk allergic individuals. Doses below ED01 are estimated to cause a reaction in less than one percent of milk allergic individuals. Prevalence data regarding how common a specific allergy is in the overall population can be used to estimate the risk in the overall population. A high exposure to a food allergen, e.g. milk protein, would cause a reaction in 100 percent of the individuals allergic to this food allergen. If this food allergy occurs with a prevalence of 2 percent in the overall population 1 out 50 would react to that exposure. Similary, 1 out of 500 in the overall population would react to an exposure corresponding to the ED10 of that allergen since 10 percent of the individuals allergic to that allergen would react.
Milk protein allergy
Hazard identification and characterization
Allergy to milk is a reaction to the proteins in contrast to lactose intolerance, where the milk sugar, i.e. lactose causes the problems. Individuals with milk pro-tein allergy must avoid all milk products, including cheese. Individuals with lac-tose intolerance tolerate small amounts of milk products. Milk protein allergy is a serious condition. Even minute amounts of milk/milk proteins can elicit severe allergic reactions in sensitized individuals. The most common milk protein allergy is IgE-mediated allergy in which the individual has IgE-antibodies to milk pro-teins and are thus sensitized to milk propro-teins. The symptoms of an allergic reac-tion can vary from mild to severe and involve one or several organs. Symptoms from the stomach (stomach ache, vomiting, diarrhoea) and skin (eczema and urti-caria) are common. The airways can also be involved with symptoms such as asthma and rhinitis. Systemic reactions, which might develop into an allergic (an-aphylactic) shock, could occur. Under special circumstances, death has occurred. IgE-mediated allergy to cow´s milk affects approximately 1 % of small children and 0.1-0.5 % of adults in northern Europe (data based on food challenges and/or symptom + sensitization) (1). Among children, milk is the fourth most common food responsible for food-induced anaphylaxis (5). In Sweden, milk is the most common undeclared allergen to cause allergic reactions (3).
Doses of milk protein in relation to population risk
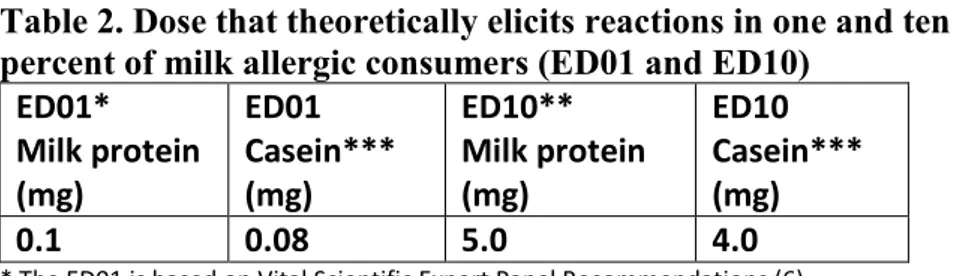
The allergenic risk increases with the severity of the symptoms of a reaction as well as with the number of individuals who might react. On a population level, a exposure to a higher dose increases the risk of a higher number of allergic indi-viduals reacting. The ED01 and ED10 for milk protein converted to casein are listed in table 2. The ED01 is that proposed in the VITAL reference doses (6). The ED10 is presented in reference (7). The clinical challenges, underlying these values of milk proteins, have mainly been performed in children.Table 2. Dose that theoretically elicits reactions in one and ten percent of milk allergic consumers (ED01 and ED10)
ED01* Milk protein (mg) ED01 Casein*** (mg) ED10** Milk protein (mg) ED10 Casein*** (mg) 0.1 0.08 5.0 4.0
* The ED01 is based on Vital Scientific Expert Panel Recommendations (6).
**The ED10 is presented in reference (7). The value presented in table 2 is an average value calculated from the two different mathematical models presented (Log-logistic and Log-normal).
***The ED01 and ED10 are converted to casein by a factor of 0.8.
Methods for analyses of milk proteins
The caseins are the dominating proteins in milk constituting about 80 percent of the proteins. The caseins are heat stable and thus suitable for analysis of milk/milk proteins in food. The Swedish National Food Agency is accredited to perform analysis of casein in the food products described above. The method SLV-m141-f5 is an Enzyme-linked immunosorbent assay (ELISA) whichhas a quantification limit of 2.5 mg casein/kg in food products 2-5 (listed on page 5) and 0.5 mg ca-sein/kg in chocolate/sweets. The measurement uncertainty is 45 percent. An ana-lytical result is restricted to the sample analysed. Milk can be in-homogenously distributed in a contaminated batch and the procedure for sampling is thus im-portant. If the product is only contaminated with whey proteins the chosen method will not find this contamination. The major milk allergen betalactoglobulin is the main part of whey proteins.
Hypothetical examples of risk assessments regarding
undeclared milk in chocolate and crisp bread
• Laboratory analysis of a bar of dark chocolate reveals that the sample con-tains 240 mg casein/kg. Milk is not declared in the labelling. The 95th
percen-tile of chocolate consumption per meal is 138 g (0.138 kg) among Swedish adults. A person consuming 138 g of chocolate would thus consume a dose of 33 mg casein. This is above both the ED01 and the ED10 of 0.08 and 4.0 mg casein, respectively. We do not know the percentage of allergic consumers who may react to 33 mg casein but it is well above 10 percent. The chocolate bar would thus be assumed to entail a risk for a substantial number of allergic consumers if milk is not declared in the labelling. This hypothetical example shows that the chocolate bar would be expected to entail a risk for more than one out of 1000 children and more than one out of 10 000 adults in the overall population (see prevalence data on page 7).
• Laboratory analysis of crisp bread reveals that the sample contains 3.5 mg casein/kg. Milk is not declared in the labelling. The 95th percentile of crisp
bread consumption per meal is 39 g (0.039 kg) among Swedish adults. A per-son consuming 39 g of crisp bread would thus consume a dose of 0.14 mg ca-sein. This is above the ED01 of 0.08 but below the ED10 of 4.0 mg caca-sein. This hypothetical example shows that the crisp bread would be expected to entail a risk for more than one out of 10 000 children and more than one out of 100 000 adults in the overall population (see prevalence data on page 7).
Factors of uncertainty regarding the risk assessment
The two examples above illustrate two different risk levels. The chocolate bar is calculated to entail a higher risk because it contains higher amounts of casein. The measurement uncertainty, however, is 45 percent which means that with 95 per-cent certainty the chocolate bar could contain between 132 and 348 mg casein/kg. In addition, the laboratory analysis only refers to the sample sent to the laboratory but milk could be prevalent to a greater or lesser degree in other parts of a con-taminated batch. In the example above the 95th percentile of chocolateconsump-tion per meal was used in the calculaconsump-tion but the average chocolate consumpconsump-tion is 48 g. The dose of milk protein consumed from the chocolate bar would thus range between 6.3 mg casein (lowest number after calculating with the measurement uncertainty and the average consumption per meal of chocolate) to 48 mg ca-sein/kg (highest number after calculating with the measurement uncertainty and the 95th percentile per meal of chocolate consumption). Both these values are
nev-ertheless above both the ED01 and the ED10.
In the crisp bread example the dose would range between 0.04 mg casein and 0.20 mg casein. The dose of 0.04 mg is below the ED01 of 0.08 mg but the dose of 0.2 mg is above the ED01.
In addition, individuals might consume less than the average amount of choco-late/crisp bread per meal. There are factors of uncertainty regarding both food consumption data and data on food challenges.
EFSA concludes that current clinical, epidemiological and experimental data do not allow determination of safe allergen thresholds that would not trigger adverse reactions in sensitized consumers (1). It is difficult to estimate the severity of a reaction at a certain dose because allergic individuals react with different symp-toms. The data from the allergy registry on the Swedish National Food Agency’s website (8) shows that severe allergic reactions (anaphylactic reactions) have oc-curred to doses at 0.9 and 1.5 mg casein, respectively.
Conclusion
Undeclared milk can constitute a health risk for milk allergic individuals. Symp-toms can vary from mild to severe anaphylactic reactions. Risk assessments re-garding undeclared food allergens such as milk proteins can be performed by cal-culating the dose of milk protein that one meal of the food would contain. This dose is calculated by multiplying consumption data with analytical data of con-centrations of allergen. The calculated dose should thereafter be compared to the dose that elicits reactions in one or ten percent of the most sensitive allergic indi-viduals (ED01 and ED10). A calculated dose corresponding to the ED01 can theo-retically cause a reaction in one percent of the milk allergic population who eat a certain food. Similarly, a dose corresponding to an ED10 can cause reactions in ten percent of allergic consumers. A dose of milk protein below ED01 is assumed to cause a reaction in less than 1 out of 10 000 children and less than 1 out of 20 000 adults in the overall population.
Peanut Allergy
Hazard identification and characterization
Peanut allergy is a serious condition. Individuals allergic to peanut must avoid all food products containing peanut. Even tiny amounts of peanut proteins can elicit severe allergic reactions in sensitized individuals. Peanut allergy is an
IgE-mediated allergy in which the individual has IgE-antibodies to peanut proteins and thus are sensitized to peanut proteins. The symptoms of an allergic reaction can vary from mild to severe and involve one or several organs. Symptoms from the stomach (stomach ache, vomiting, diarrhoea) and skin (eczema and urticaria) can occur as well as symptoms from the airways such as asthma and rhinitis. Systemic reactions, which might develop into an allergic (anaphylactic) shock, might occur. IgE-mediated allergy to peanut is one of the most common childhood allergies in western countries. IgE-mediated allergy to peanut affects approximately 0.1 to 1.8 percent of the population and is dependent on the people’s age and the country of origin (1). Among children, peanut is the most common food responsible for food-induced anaphylaxis (5). In Sweden, peanut is the second most common unde-clared allergen to cause allergic reactions (3).
Doses of peanut protein in relation to population risk
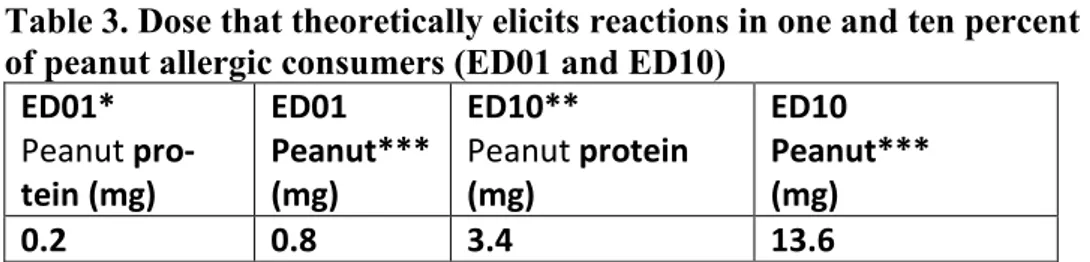
The allergenic risk increases with the severity of the symptoms of a reaction as well as with the number of individuals who might react. On a population level, an exposure to a higher dose increases the risk of a higher number of allergic indi-viduals reacting. The ED01 and ED10 for peanut protein and peanut are listed in table 3. The ED01 is that proposed in the VITAL reference doses (6). The ED10 is presented in reference (7).Table 3. Dose that theoretically elicits reactions in one and ten percent of peanut allergic consumers (ED01 and ED10)
ED01* Peanut pro-tein (mg) ED01 Peanut*** (mg) ED10** Peanut protein (mg) ED10 Peanut*** (mg) 0.2 0.8 3.4 13.6
* The ED01 is based on Vital Scientific Expert Panel Recommendations (6).
**The ED10 is presented in reference (7). The value presented in table 3 is an average value calculated from the three different mathematical models presented (Log-logistic, Log-normal, Weibull).
***The ED01 and ED10 are converted to peanut by a factor of 4 (6). This is done as the method described below expresses the values in terms of peanut and not as peanut protein.
Method for analysing peanut
The Swedish National Food Agency is accredited to perform analysis of peanut in the food products described above. The method SLV–m141-f1 is an Enzyme-linked immunosorbent assay (ELISA) which has a quantification limit of 1 mg peanut/kg, which corresponds to 0.25 mg peanut protein/kg. The measurement uncertainty is 35 percent. An analytical result is restricted to the sample analysed. Peanut is often inhomogenously distributed in a contaminated batch and the pro-cedure for sampling is thus important. Still, observations regarding whether pieces of peanut contaminate products might be equally important.
Hypothetical example of a risk assessment regarding
undeclared peanut in chocolate
• Laboratory analysis of a chocolate bar reveals that the sample contains 110 mg peanut/kg. Peanut is not declared in the labelling. The 95th percentile of
chocolate consumption is 138 g (0.138 kg) among Swedish adults. A person consuming 138 g of chocolate would thus consume a dose of 15.2 mg peanut. This is above both the ED01 and the ED10 of 0.8 and 13.6 mg peanut, respec-tively. We do not know the percentage of allergic consumers who may react to 15.2 mg peanut but the figure is above 10 percent. The chocolate bar would thus be expected to entail a risk for a substantial number of allergic consum-ers if peanut is not declared in the labelling. This hypothetical example shows that the chocolate bar would be estimated to entail a risk for more than one out 10 000 in the overall population (see prevalence data on page 11).
Factors of uncertainty regarding the risk assessment
The measurement uncertainty of the analysis of peanut is 35 percent which means that with 95 percent certainty the chocolate bar could contain between 72 and 149 mg peanut/kg. The laboratory analysis only refers to the sample sent to the labora-tory but peanut is often inhomogenously distributed in a contaminated batch. In addition, in the example above the 95th percentile of chocolate consumption per meal was used in the calculation but the average chocolate consumption is 48 g. The dose of peanut consumed from the chocolate bar would thus range between 3.5 mg peanut (lowest number after calculating with the measurement uncertainty and the average consumption per meal of chocolate) and 20 mg peanut (highest number after calculating with the measurement uncertainty and the 95th percentile
per meal of chocolate consumption). The dose of 3.5 mg peanut is above the ED01 of 0.8 mg peanut but below the ED10 of 13.6 mg peanut.
In addition, individuals might consume less than the average amount of chocolate per meal. There are factors of uncertainty regarding both food consumption data and data on food challenges.
EFSA concludes that current clinical, epidemiological and experimental data do not allow determination of safe allergen thresholds that would not trigger adverse reactions in sensitized consumers (1). It is difficult to estimate the severity of a reaction at a certain dose because allergic individuals react with different symp-toms. The data from the allergy registry on Swedish National Food Agency’s website (8) shows that severe allergic reactions (anaphylactic reactions) have oc-curred at exposure to doses of 4.4 mg peanut.
Conclusion
Undeclared peanut can constitute a health risk for peanut allergic individuals. Risk assessments regarding undeclared food allergens such as peanut proteins can be performed by calculating the dose of peanut protein or peanut that one meal of the food would contain. The dose is calculated by multiplying consumption data with analytical data of concentrations of peanut protein or peanut. The calculated dose should thereafter be compared with the dose that elicits reactions in one or ten percent of the most sensitive allergic individuals (ED01 and ED10). A calculated dose corresponding to the ED01 can theoretically cause a reaction in one percent of the peanut allergic population who eat a certain food. Similarly, a dose corre-sponding to an ED10 can cause reactions in ten percent of peanut allergic con-sumers. A dose below ED01 is assumed to cause a reaction in less than 1 out of 5560 people in the overall population. However, this assumption must be weighed against the fact that nut allergens are generally not homogenously distributed in a contaminated batch.
Hazelnut allergy
Hazard identification and characterization
IgE-mediated allergy to hazelnut is the most common food allergy in northern Europe. Hazelnut allergy is an IgE-mediated allergy in which the individual has IgE-antibodies tos hazelnut proteins and thus are sensitized to hazelnut proteins. Approximately 2.2-4.5 percent of the adult population in northern Europe are al-lergic to hazelnut (1). However, IgE-mediated hazelnut allergy can be divided into two different kinds of allergies. The birch pollen allergen Bet v 1 is homologues to the hazelnut allergen Cor a 1. In northern Europe, a substantial number of indi-viduals are allergic to birch pollen and approximately 80 percent of hazelnut al-lergic individuals are sensitized to Cor a 1 (10). These people often react with only oral allergy syndrome, i.e. itching of the mouth and throat. The other kind of hazelnut allergy is most often due to production of IgE-antibodies to other hazel-nut allergens. This latter allergy is often of a more severe kind and the symptoms might involve one or several organs. Symptoms from the stomach (stomach ache, vomiting, diarrhoea) and skin (eczema and urticaria) can occur as well as symp-toms from the airways suh as asthma and rhinitis. Systemic reactions, which might develop into an allergic (anaphylactic) shock, might also occur. Individuals with this more severe allergy to hazelnut must avoid all products containing ha-zelnut. Even tiny amounts of hazelnut proteins can elicit severe allergic reactions in sensitized individuals. Under special circumstances, death has occurred (1). Among children, hazelnut is the fifth most common food responsible for food-induced anaphylaxis (5).
Doses of hazelnut protein in relation to population risk
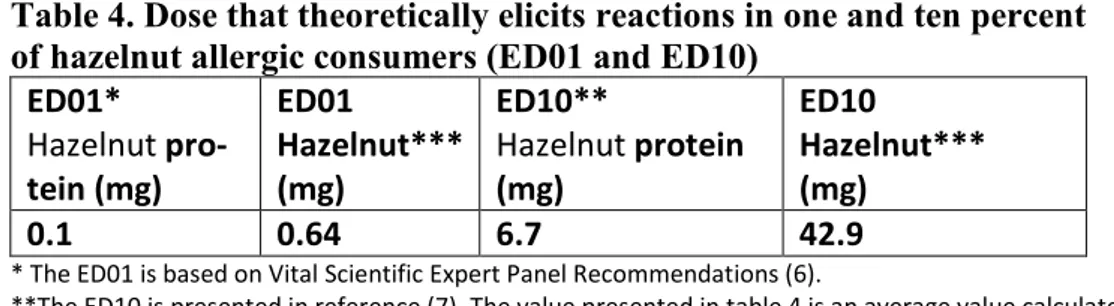
The allergenic risk increases with the severity of the symptoms of a reaction as well as with the number of individuals who might react. On a population level, exposure to a higher dose increases the risk of a higher number of allergic indi-viduals reacting. The ED01 and ED10 for hazelnut protein and hazelnut are listed in table 4. The ED01 is that proposed in the VITAL reference doses (6). The ED10 is presented in reference (7).Table 4. Dose that theoretically elicits reactions in one and ten percent of hazelnut allergic consumers (ED01 and ED10)
ED01* Hazelnut pro-tein (mg) ED01 Hazelnut*** (mg) ED10** Hazelnut protein (mg) ED10 Hazelnut*** (mg) 0.1 0.64 6.7 42.9
* The ED01 is based on Vital Scientific Expert Panel Recommendations (6).
**The ED10 is presented in reference (7). The value presented in table 4 is an average value calculated from the three different mathematical models presented (Log-logistic, Log-normal, Weibull).
***The ED01 and ED10 are converted to hazelnut by a factor of 6.4 (6). This is done as the method described below expresses the values in terms of hazelnut and not as hazelnut protein.
Method for analysing hazelnut
The Swedish National Food Agency is accredited to perform analysis of hazelnut in the food products described above. The method SLV-m141-f2 is an Enzyme-linked immunosorbent assay (ELISA) which has a quantification limit of 2.5 mg hazelnut/kg which corresponds to 0.39 mg hazelnut protein/kg. The measurement uncertainty is 30 percent. An analytical result is restricted to the sample that is analysed. Hazelnut is often inhomogenously distributed in a contaminated batch and the procedure for sampling is thus important. Still, observations regarding whether pieces of hazelnut contaminate products might be equally important.
Hypothetical example of a risk assessment regarding
undeclared hazelnut in bread
Laboratory analysis of a soft bread reveals that the sample contains 400 mg hazel-nut/kg. Hazelnut is not declared in the labelling. The 95th percentile of soft bread consumption is 107 g (0.107 kg) among Swedish adults. A person consuming 107 g of bread would thus consume a dose of 43 mg hazelnut. This is above the ED01 of 0.64 mg hazelnut and at the ED10 of 42.9 mg hazelnut. The bread would thus be expected to entail a risk for a substantial number of allergic consumers if ha-zelnut is not declared in the labelling. This hypothetical example shows that the bread would be expected to posses a risk for more than 1 out of 450 adults. How-ever, the majority of these people would respond with mild oral allergy symp-toms.
Factors of uncertainty regarding the risk assessment
The measurement uncertainty of the analysis of hazelnut is 30 percent which means that with 95 percent certainty the soft bread could contain between 280 and 520 mg hazelnut/kg. The laboratory analysis only refers to the sample sent to the laboratory but hazelnut is often inhomogenously distributed in a contaminated batch. In addition, in the example above the 95th percentile of soft breadconsump-tion per meal was used in the calculaconsump-tion but the average soft bread consumpconsump-tion is 61 grams. This dose of hazelnut consumed from the bread would thus range between 17 mg hazelnut (lowest number after calculating with the measurement uncertainty and the average consumption per meal of soft bread) to 56 mg hazel-nut (highest number after calculating with the measurement uncertainty and the 95th percentile per meal of soft bread consumption). The dose of 17 mg hazelnut
is above the ED01 of 0.64 mg hazelnut but below the ED10 of 42.9 mg hazelnut. In addition, individuals might consume less than the average amount of bread per meal. There are factors of uncertainty regarding both food consumption data and regarding data on food challenges.
EFSA concludes that current clinical, epidemiological and experimental data do not allow determining safe allergen thresholds that would NOT trigger adverse reactions in sensitized consumers (1). It is difficult to estimate the severity of a reaction at a certain dose because allergic individuals react with different symp-toms. The data from the allergy registry on the Swedish National Food Agency’s website (11) shows that severe allergic reactions (anaphylactic reactions) have occurred at exposure of 4.6 mg hazelnut and 38 mg hazelnut.
Conclusion
Undeclared hazelnut can constitute a health risk for hazelnut allergic individuals. Risk assessments regarding undeclared food allergens such as hazelnut proteins can be performed by calculating the dose of hazelnut protein or hazelnut that one meal of the food would contain. The dose is calculated by multiplying consump-tion data with analytical data of concentraconsump-tions of hazelnut or hazelnut protein. The calculated dose should thereafter be compared with the dose that elicits reac-tions in one or ten percent of the most sensitive allergic individuals (ED01 and ED10). A calculated dose corresponding to the ED01 can theoretically cause a reaction in one percent of the hazelnut allergic population who eat a certain food. Similarly, a dose corresponding to an ED10 can cause reactions in ten percent of hazelnut allergic consumers. A dose below ED01 is expected to cause a reaction in less than 1 out of 2200 people in the overall population. However, this assump-tion must be weighed against the fact that nut allergens are seldom homogenously distributed in a contaminated batch. Nonetheless, in northern Europe a substantial proportion of the hazelnut allergic population respond with mild oral allergy symptoms.
Egg allergy
Hazard identification and characterization
Allergy to egg is most often caused by allergy to the proteins in the egg white. Individuals with allergy to egg must avoid all products containing egg. Egg aller-gy is a serious condition. Even tiny amounts of egg proteins can elicit severe al-lergic reactions in sensitized individuals. The most common egg allergy is IgE-mediated allergy, in which the individual has IgE-antibodies to egg white proteins and thus are sensitized to egg white proteins. The symptoms of an allergic reac-tion can vary from mild to severe and involve one or several organs. Symptoms from the stomach (stomach ache, vomiting, diarrhoea) and skin (eczema and urti-caria) are common. The airways can also be involved with symptoms such as asthma and rhinitis. Systemic reactions, which might develop into an allergic (an-aphylactic) shock, might also occur. Under special circumstances, death has oc-curred. IgE-mediated allergy to egg is one of the most common childhood aller-gies in western countries. It affects approximately 0.6-2.6 percenbt of small chil-dren and 0.1 percent of adults in northern Europe (data based on food challenges and/or symptoms + sensitization) (1). Among children, egg is the third most common food responsible for food-induced anaphylaxis (5). In Sweden, egg is the third most common undeclared allergen to cause allergic reactions (3).
Doses of egg protein in relation to population risk
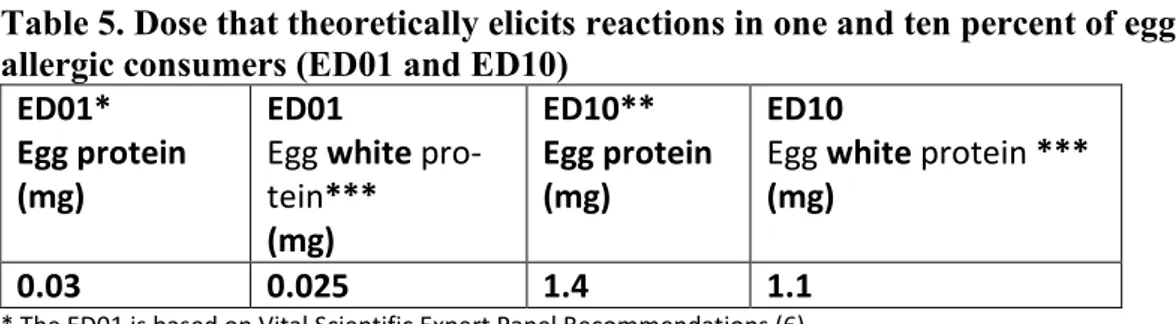
The allergenic risk increases with the severity of the symptoms of a reaction as well as with the number of individuals who might react. On a population level, exposure to a higher dose increases the risk of a higher number of allergic indi-viduals reacting. The ED01 and ED10 for egg protein and egg white protein are listed in table 5. The ED01 is that proposed in the VITAL reference doses (6). The ED10 is presented in reference (7).
Table 5. Dose that theoretically elicits reactions in one and ten percent of egg allergic consumers (ED01 and ED10)
ED01* Egg protein (mg)
ED01
Egg white pro-tein*** (mg) ED10** Egg protein (mg) ED10
Egg white protein ***
(mg)
0.03 0.025 1.4 1.1
* The ED01 is based on Vital Scientific Expert Panel Recommendations (6).
**The ED10 is presented in reference (7). The value presented in table 5 is an average value calculated from the three different mathematical models presented (Log-logistic, Log-normal, Weibull).
Method for analysing egg white proteins
Ovomuciod is a heat stable egg white protein and suitable for the analysis of egg proteins. The Swedish National Food Agency is accredited to perform analysis of egg white proteins in the food products described above. The method SLV-m141-f7 is an Enzyme-linked immunosorbent assay (ELISA) which has a quantification limit of 0.5 mg egg white protein/kg. The measurement uncertainty is 50 percent. An analytical result is restricted to the sample that is analysed. Egg can be inho-mogenously distributed in a contaminated batch and the procedure for sampling is thus important.
Hypothetical example of a risk assessment regarding
undeclared egg in pie (dessert)
Laboratory analysis of a pie (dessert) reveals that the sample contains 24 mg egg white protein/kg. Egg is not declared in the labelling. The 95th percentile of pie (dessert) consumption is 200 g (0.200 kg) among Swedish adults. A person con-suming 200 g pie would thus consume a dose of 4.8 mg egg white protein. This is above both the ED01 and the ED10 of 0.025 and 1.1 mg egg white protein, re-spectively. We do not know the percentage of allergic consumers who may react to 4.8 mg egg white protein but the figure is well above 10 percent. The pie would thus be expected to entail a risk for a substantial number of allergic consumers if egg is not declared in the labelling. This hypothetical example shows that the pie would be expected to posses a risk for more than 1 out of 1670 children and more than 1 out of 10 000 adults.
Factors of uncertainty regarding the risk assessment
The measurement uncertainty of the analysis of egg white protein is 50 percent, which means that with 95 percent certainty the pie could contain between 12 and 36 mg egg white protein/kg. The laboratory analysis only refers to the sample sent to the laboratory but egg white protein might be inhomogenously distributed in a contaminated batch. Also, in the example above the 95th percentile of pie (dessert)consumption per meal was used in the calculation but the average pie (dessert) consumption is 120 grams. This dose of egg white protein consumed from the pie would thus range between 1.4 (lowest number after calculating with the measure-ment uncertainty and the average consumption per meal of pie) and 7.2 mg of egg white protein (highest number after calculating with the measurement uncertainty and the 95th percentile per meal of pie consumption). The lower dose of 1.4 mg
egg white protein is still above both the ED01 and ED10.
In addition, individuals might consume less than the average amount of pie per meal. There are factors of uncertainty regarding both food consumption data and data on food challenges.
EFSA concludes that current clinical, epidemiological and experimental data do not allow determination of safe allergen thresholds that would not trigger adverse reactions in sensitized consumers (1). It is difficult to estimate the severity of a reaction at a certain dose because allergic individuals react with different symp-toms. The data from the allergy registry on the Swedish National Food Agency’s website (12) shows that severe allergic reactions (anaphylactic reactions) have occurred at exposure to doses of 14 and 20 mg egg white protein.
Conclusion
Undeclared egg can constitute a health risk for egg allergic individuals. Risk as-sessments regarding undeclared food allergens such as egg white proteins can be performed by calculating the dose of egg white protein that one meal of the food would contain. The dose is calculated by multiplying consumption data with ana-lytical data of the concentrations of egg white protein. The calculated dose should thereafter be compared with the dose that elicits reactions in one or ten percent of the most sensitive allergic individuals (ED01 and ED 10). A calculated dose cor-responding to the ED01 can theoretically cause a reaction in one percent of the egg allergic population who consume a certain food. Likewise, a dose correspond-ing to an ED10 can cause reactions in ten percent of egg allergic consumers. A dose below ED01 is assumed to cause a reaction in less than one out of 3850 chil-dren and in less than one out of 100 000 adults in the overall population.
Overall conclusion
Risk assessments regarding undeclared food allergens can be performed by calcu-lating the dose of allergen that one meal of the food would contain. The dose is calculated by multiplying consumption data with analytical data of concentrations of the specific allergen. The calculated dose should thereafter be compared to the dose that elicits reactions in one or ten percent of the most sensitive allergic indi-viduals (ED01 and ED10). A calculated dose corresponding to the ED01 can theo-retically cause a reaction in one percent of the allergic population who eat a cer-tain food. Similarly, a dose corresponding to an ED10 can cause reactions in ten percent of allergic consumers. A dose below ED01 is assumed to cause a reaction in less than one percent of the individuals allergic to that allergen. The risk of an allergic reaction in the overall population can be calculated by multiplying the prevalence of the specific food allergy by one or ten percent. The severity of the reaction, however, is difficult to forsee as different allergic individual respond with different symptoms. Milk, peanut, hazelnut and egg have all been causes of anaphylaxic reactions and deaths.
Acknowledgement
We are grateful to Charlotte B. Madsen at the Technical University of Denmark for reviewing the text.
References
1. Scientific Opinion on the evaluation of allergenic foods and food ingredients for labelling purposes EFSA Panel on Dietetic Products, Nutrition and Allergies (NDA). EFSA Journal 2014;12(11):3894.
2. Madsen C.B, Crevel R.W.R, Mills C, Taylor S.L. Risk Management for Food Aller-gy. Elsevier Inc 2014.
3. Milk, the most commonly undeclared food allergen causing unexpected allergic re-actions in Sweden 2004-2011. www.slv.se
4. Swedish nutritional survey 2010-2011, Adults. National Food Agency 2011. 5. Vetander M, Helander D et al Anaphylaxis and reactions to foods in children –
a population-based case study of emergency department visits. Clin Exp Allergy 2012;42:568-77.
6. Taylor S.L, Baumert J.L et al. Establishment of Reference Doses for residues of allergenic foods: Report of the VITAL Expert Panel. Food Chem Toxicology 2014;63:9-17.
7. Remington B, 2013. Risk assessment of trace and undeclared allergens in processed foods. Dissertation and thesis in food science and technology. University of Nebras-ka - Lincoln. Paper 32.
8. National Food Agency website 2015. http://www.livsmedelsverket.se/produktion-handel--kontroll/produktion-av-livsmedel/allergener/mjolk-och-laktos/
9. National Food Agency website 2015. http://www.livsmedelsverket.se/produktion-handel--kontroll/produktion-av-livsmedel/allergener/jordnotter/
10. Datema MR et al. Hazelnut allergy across Europe dissected molecularly: A EuroPre-vall outpatient clinic survey. J Allergy Clin Immunol 2015;136:382-91.
11. National Food Agency website 2015. http://www.livsmedelsverket.se/produktion-handel--kontroll/produktion-av-livsmedel/allergener/notter/
12. National Food Agency website 2015. http://www.livsmedelsverket.se/produktion-handel--kontroll/produktion-av-livsmedel/allergener/agg/
Rapporter som utgivits 2014
1. Exponeringsuppskattningar av kemiska ämnen och mikrobiologiska agens - översikt samt rekommendationer om arbetsgång och strategi av S Sand, H Eneroth, B-G Ericsson och M Lindblad.
2. Fusariumsvampar och dess toxiner i svenskodlad vete och havre - rapport från kartläggningsstudie 2009-2011 av E Fredlund och M Lindblad.
3. Colorectal cancer-incidence in relation to consumption of red or precessed meat by PO Darnerud and N-G Ilbäck.
4. Kommunala myndigheters kontroll av dricksvattenanläggningar 2012 av C Svärd, C Forslund och M Eberhardson.
5. Kontroll av bekämpningsmedelsrester i livsmedel 2011 och 2012 av P Fohgelberg, A Jansson och H Omberg.
6. Vad är det som slängs vid utgånget hållbarhetsdatum? - en mikrobiologisk kartläggning av utvalda kylvaror av Å Rosengren.
7. Länsstyrelsernas rapportering av livsmedelskontrollen inom primärproduktionen 2012 av L Eskilson och S Sylvén.
8. Riksmaten - vuxna 2010-2011, Livsmedels- och näringsintag bland vuxna i Sverige av E Amcoff, A Edberg, H Enghart Barbieri, A K Lindroos, C Nälsén, M Pearson och E Warensjö Lemming.
9. Matfett och oljor - analys av fettsyror och vitaminer av V Öhrvik, R Grönholm, A Staffas och S Wretling. 10. Revision av Sveriges livsmedelskontroll 2013 - resultat av länsstyrelsernas och Livsmedelsverkets
revisioner av kontrollmyndighete av A Rydin, G Engström och Å Eneroth.
11. Kontrollprogrammet för tvåskaliga blötdjur − Årsrapport 2011-2013 − av M Persson, B Karlsson, SMHI, M Hellmér, A Johansson, I Nordlander och M Simonsson.
12. Riskkarakterisering av exponering för nitrosodimetylamin (NDMA) från kloramin använt vid dricks- vattenberedning av K Svensson.
13. Risk- och nyttovärdering av sänkt halt av nitrit och koksalt i charkuteriprodukter - i samband med sänkt temperatur i kylkedjan av P O Darnerud, H Eneroth, A Glynn, N-G Ilbäck, M Lindblad och L Merino. 14. Kommuners och Livsmedelsverkets rapportering av livsmedelskontrollen 2013 av L Eskilsson
och M Eberhardson.
15. Rapport från workshop 27-28 november 2013. Risk- och sårbarhetsanalys - från jord till bord. Samman- fattning av presentationer och diskussioner.
16. Risk- och nyttovärdering av nötter - sammanställning av hälsoeffekter av nötkonsumtion av J Bylund, H Eneroth, S Wallin och L Abramsson-Zetterberg.
17. Länsstyrelsernas rapportering av livsmedelskontrollen inom primärproduktionen 2013 av L Eskilson, S Sylvén och M Eberhardson.
18. Bly i viltkött - ammunitionsrester och kemisk analys, del 1 av B Kollander och B Sundström, Livsmedelsverket, F Widemo, Svenska Jägareförbundet och E Ågren, Statens veterinärmedicinska anstalt. Bly i viltkött - halter av bly i blod hos jägarfamiljer, del 2 av K Forsell, I Gyllenhammar, J Nilsson Sommar, N Lundberg-Hallén, T Lundh, N Kotova, I Bergdahl, B Järvholm och P O Darnerud.
Bly i viltkött - riskvärdering, del 3 av S Sand och P O Darnerud.
Bly i viltkött - riskhantering, del 4 av R Bjerselius, E Halldin Ankarberg och A Kautto.
19. Bra livsmedelsval baserat på nordiska näringsrekommendationer 2012 av H Eneroth, L Björck och Å Brugård Konde.
20. Konsumtion av rött kött och charkuteriprodukter och samband med tjock- och ändtarmscancer - risk och nyttohanteringsrapport av R Bjerselius, Å Brugård Konde och J Sanner Färnstrand. 21. Kontroll av restsubstanser i levande djur och animaliska livsmedel. Resultat 2013 av I Nordlander,
B Aspenström-Fagerlund, A Glynn, A Törnkvist, T Cantillana, K Neil Persson, Livsmedelsverket och K Girma, Jordbruksverket.
22. Kartläggning av shigatoxin-producerande E.coli (STEC) på nötkött och bladgrönsaker av M Egervärn och C Flink.
23. The Risk Thermometer - a tool for comparing risks associated with food consumption, draft report by S Sand,
R Bjerselius, L Busk, H Eneroth, J Sanner Färnstrand and R Lindqvist.
24. A review of Risk and Benefit Assessment procedures - development of a procedure applicable for practical use at NFS by L Abramsson Zetterberg, C Andersson, W Becker, P O Darnerud, H Eneroth, A Glynn, R Lindqvist, S Sand and N-G Ilbäck.
25. Fisk och skaldjur, metaller i livsmedel - fyra dicenniers analyser av L Jorhem, C Åstrand, B Sundström, J Engman och B Kollander.
Rapporter som utgivits 2015
1. Spannmål, fröer och nötter -Metaller i livsmedel, fyra decenniers analyser av L Jorhem, C Åstrand, B Sundström, J Engman och B Kollander.
2. Konsumenters förståelse av livsmedelsinformation av J Grausne, C Gössner och H Enghardt Barbieri. 3. Slutrapport för regeringsuppdraget att inrätta ett nationellt kompetenscentrum för måltider i vård, skola
och omsorg av E Sundberg, L Forsman, K Lilja, A-K Quetel och I Stevén.
4. Kontroll av bekämpningsmedelsrester i livsmedel 2013 av A Jansson, P Fohgelberg och A Widenfalk. 5. Råd om bra matvanor - risk- och nyttohanteringsrapport av Å Brugård Konde, R Bjerselius, L Haglund,
A Jansson, M Pearson, J Sanner Färnstrand och A-K Johansson.
6. Närings- och hälsopåståenden i märkning av livsmedel - en undersökning av efterlevnaden av reglern av P Bergkvist, A Laser-Reuterswärd, A Göransdotter Nilsson och L Nyholm.
7. Serveras fet fisk från Östersjön på förskolor och skolor, som omfattas av dioxinundentaget av P Elvingsson. 8. The Risk Thermometer - A tool for risk comparison by S Sand, R Bjerselius, L Busk, H Eneroth, J Sanner
Färnstrand and R Lindqvist.
9. Revision av Sveriges livsmedelskontroll 2014 - resultat av länsstyrelsernas och Livsmedelsverkets revisioner av kontrollmyndigheter av A Rydin, G Engström och Å Eneroth.
10. Kommuners och Livsmedelsverkets rapportering av livsmedelskontrollen 2014 av L Eskilsson och M Eberhardson.
11. Bra livsmedelsval för barn 2-17 år - baserat på nordiska näringsrekommendationer av H Eneroth och L Björck.
12. Kontroll av restsubstanser i levande djur och animaliska livsmedel. Resultat 2014 av I Nordlander,
B Aspenström-Fagerlund, A Glynn, A Törnkvist, T Cantillana, K Neil Persson, Livsmedelsverket och K Girma, Jordbruksverket.
13. Biocidanvändning och antibiotikaresistens av J Bylund och J Ottosson.
14. Symtomprofiler ‒ ett verktyg för smittspårning vid magsjukeutbrott av J Bylund, J Toljander och M Simonsson. 15. Samordnade kontrollprojekt 2015. Dricksvatten - distributionsanläggningar av A Tollin.
16. Oorganisk arsenik i ris och risprodukter på den svenska marknaden 2015 - kartläggning, riskvärdering och hantering av B Kollander.
17. Undeclared milk, peanut, hazelnut or egg - guide on how to assess the risk of allergic reaction in the populationby Y Sjögren Bolin.