Rapport 12 − 2007
NATIONAL FOOD
LIVSMEDELS
VERKET
Risks and Benefits of Fish
Consumption
A Risk-Benefit Analysis Based on the Occurrence of Dioxin/PCB,
Methyl Mercury, n-3 Fatty Acids and Vitamin D in Fish
Produktion:
Livsmedelsverket, Box 622 SE-751 26 Uppsala, Sweden
Teknisk redaktör: M Olausson Tryck: Kopieringshuset, Uppsala Uppsala 2008-01-07
Livsmedelsverkets rapportserie är avsedd för publicering av projektrapporter, metodprövningar, utredningar m m. I serien ingår även reserapporter och konferensmaterial. För innehållet svarar författarna själva.
Rapporterna utges i varierande upplagor och tilltrycks i mån av efterfrågan. De kan rekvireras från Livsmedels-verkets kundtjänst (tel 018-17 55 06) till självkostnadspris (kopieringskostnad + expeditionsavgift).
Abbreviations/Glossary... 3
Preface... 5
Summary ... 6
Overall conclusions... 6
Consumption of fish in Sweden ... 8
Content of nutrients and environmental pollutants ... 8
Quantitative risk-benefit assessments ... 9
Model calculations using Swedish data ... 10
Expertise requirements for risk-benefit assessments ... 11
Summary of Appendix 1. Health Effects ... 12
Summary of Appendix 2. Risk Management ... 15
Background ... 16
Aims and Scope... 18
Consumption of fish in Sweden ... 19
Adults ... 19
High consumers... 24
Children... 25
Content of nutrients and environmental pollutants ... 27
Nutrients... 27
Environmental pollutants ... 28
Organic environmental pollutants ... 28
Methyl mercury ... 29
Intake of nutrients and environmental pollutants from fish ... 31
Nutrients... 31 Adults ... 31 Children... 31 Dioxins and PCB... 32 Adults ... 32 Children... 33 Methyl mercury ... 34 Adults ... 34 Children... 35
Assessments of benefits and risks ... 36
Assessment of benefits of fish consumption... 36
Risk assessments ... 37
Dioxins and PCB... 37
MeHg... 39
Risk characterisation ... 40
Low fish consumption... 40
Low intake of DHA in pregnancy ... 41
Intake of vitamin D ... 41
Dioxins/PCB ... 42
MeHg... 42
Conclusions... 43
Methods for comparing risks and benefits ... 45
Other risk-benefit assessments of fish consumption ... 48
Conclusions ... 50
Model calculations of intake of nutrients and environmental pollutants using Swedish data ... 51
n-3 fatty acids and dioxin/PCB... 51
Vitamin D and MeHg ... 53
Intake of environmental pollutants based on SNO ... 58
Conclusions ... 60
Overall conclusions ... 61
Recommendations for future work ... 63
Resource and expertise requirement... 64 Appendix 1 Health Effects of Fish Consumption
Appendix 2 Risk Management References
Abbreviations/Glossary
Term Detail
AA Arachidonic acid, 20:4 n-6
Atopy Inherited tendency to develop e.g. allergic conjunctivitis, hay fever, allergic asthma and dry itchy eczema
Benchmark-method
Approach that involves fitting a model to dose-response data. A reference point for risk assessment is derived from the model that also takes into account the uncertainties in the data
CNS Central nervous system, the brain
DDT 1,1,1-trichloro-2,3-bis(4-chlorophenyl)ethylene DHA Docosahexaenoic acid, 22:6 n-3
DPA Docosapentaenoic acid, 22:5 n-3
Dioxins (In common parlance) polychlorinated dibenzo-p-dioxins and dibenzofurans (=PCDD/PCDF)
DL-PCB Dioxin-like PCB congeners EPA Eicosapentaenoic acid, 20:5 n-3
HCB Hexachlorobenzene
HCH Hexachlorocyclohexane Hg Chemical symbol for mercury
JECFA WHO/FAO scientific expert committee: Joint FAO/WHO Expert Committee on Food Additives and Contaminants Cognitive
development
A child’s intellectual development. Cognitive functions include perception, conceptualisation, memory, reasoning, problem solving, concentration
LOAEL Lowest Observed Adverse Effect Level
MeHg Methyl mercury, the chemical form of mercury found in fish NO(A)EL No Observed (Adverse) Effect Level
n-3 fatty acids Fatty acids in the n-3 series n-6 fatty acids Fatty acids in the n-6 series PCB Polychlorinated biphenyls
PCB- congeners Various types of PCB compounds
PCDD/PCDF Polychlorinated dibenzo-p-dioxins and dibenzofurans
PTWI Provisionally tolerable weekly intake. The amount of a substance on a body weight basis that an individual can be exposed to, at population level, during a lifetime without perceptible risk of negative effects. Term used by the WHO/FAO scientific committee in risk assessment of substances that have effects upon chronic exposure.
Reference dose A estimation (with an uncertainty of around one order of magnitude) of daily intake in the population, including all vulnerable groups, that probably does not lead to any harmful effects during a lifetime. Used by e.g. the US authorities.
Term Detail
TEQ Toxic equivalents. 17 congeners of dibenzodioxins/ dibenzofurans and 12 congeners of dioxin-like PCB have been allocated so-called TEF (toxic equivalency factors), which means that their toxicity has been evaluated in relation to the most toxic congener, 2,3,7,8-tetrachlorodiobenzo-p-dioxin (TCDD), which has a TEF factor of 1. The TEF for an individual congener is multiplied by the actual measured concentration (in e.g. pg/g), which results in a TEQ value. The TEQ values of the congeners analysed are added together to give a combined TEQ value that shows the toxicity-weighted content of dioxins in the actual sample. Depending on whether the dioxins (PCDD/PCDF) or dioxin-like PCB have been analysed, a PCDD/DF-TEQ or PCB-TEQ is obtained. If analytical data on both dioxins and dioxin-like PCB are available these can be added to give the total-TEQ. TDI Tolerable daily intake. The amount of a substance on a body
weight basis that an individual can be exposed to, on a population level, during a lifetime without any perceptible risk of negative effects. Term used by the WHO/FAO scientific committee in risk assessment of substances that have effects upon acute exposure
TMI Tolerable monthly intake. See TDI (not applicable for acute exposure)
TWI Tolerable weekly intake. See TDI (not applicable for acute exposure)
Total-TEQ TEQ content comprising both PCDD/PCDF and DL-PCB, see TEQ
WHO-TEQ TEQ contents based on TEF data agreed at the WHO expert meeting on 1998 (van den Berg et al., Environ Health Perspect 1998;106:775-92). Newly published reviews of TEF values will over time give rise to certain changes (van den Berg et al., Toxicol Sci 2006;93:223-241)
Preface
The project Risks and Benefits of Fish Consumption was initiated in 2004 with the aim of studying various methods for assessing the risks and benefits associated with the consumption of fish. The National Food Administration’s advice on fish consumption to date has been based separately on either nutritional advantages or toxicological risk assessments. The project studied methods for risk-benefit assessment and nutritional evaluation that considered the health effects associated with certain organic environmental pollutants (dioxins/dioxin-like PCBs) and methyl mercury, and certain nutrients.
The working group reviewed the scientific literature and reports regarding methods for risk-benefit assessments and the health effects of fish, with the focus on n-3 fatty acids and the abovementioned environmental pollutants. In May 2004, a seminar was organised within the framework of the project on the risks and benefits of fish, with invited representatives from the authorities in Finland and the United Kingdom, in order to exchange experiences and obtain a broader base for the work.
Within the framework of the project, intake calculations for dioxins/PCB from 2002 have been updated using new analytical data. The results have been published in a separate report from the National Food Administration (25/2005). Furthermore, intake calculations for dioxins/PCB and mercury have been made for children using results from the National Food Administration’s investigations on children in 2003. Model calculations have also been made taking into account both environmental pollutants and nutrients in various scenarios.
The results of the project will be used as part of the underlying material for the review of dietary advice on fish taking place during 2007.
The project group consisted of Wulf Becker (Nutrition Department), Rickard Bjerselius (Toxicology Unit), Per Ola Darnerud (Toxicology Unit), Kierstin Petersson Grawé (Toxicology Unit), Marie Aune (Chemistry Unit 2), and Maj Olausson (Communications Unit). Emma Ankarberg (Toxicology Unit) worked on updating the dioxin calculations. Gabriela Concha (Toxicology Unit) was responsible for the intake calculations based on the investigation in children. Anders Glynn (Toxicology Unit) wrote the section on complex mixtures in Appendix 1. Professor Staffan Skerfving, Occupational and Environmental Medicine Clinic in Lund, also external scientific advisor to the National Food Administration, contributed data for the section on the interaction between methyl mercury and cardiovascular disease in Appendix 1. A reference group consisted of Annica Sohlström (Nutrition Department), Anders Glynn (Toxicology Unit), Östen Andersson (Legal Department), Roland Lindqvist (Microbiology Unit), Arne Andersson (Supervisory Department) and Helene Håkansson (Institute of Environmental Medicine, Karolinska Institute).
Summary
In the project Risks and Benefits of Fish Consumption, toxicological and nutritional aspects of fish consumption were highlighted. Evaluation of the risks and benefits associated with fish consumption were limited to certain nutritional compounds (long-chain n-3-fatty acids and vitamin D) and certain environmental pollutants (dioxins/dioxin-like PCBs and methyl mercury, MeHg). Balanced intake calculations were made based on consumption data from Riksmaten [National Diet] 1997-1998 and actual data on concentrations of the compounds studied. The project group reviewed the scientific literature and reports, with the focus on methods for assessing and comparing the health effects of fish consumption.
Overall conclusions
• An increase in fish consumption in accordance with current dietary advice (2-3 times per week) would probably result in a decreased incidence of cardiovascular disease in the population, particularly in those who eat little or no fish and in those with an increased risk of cardiovascular disease. A considerable proportion of the population aged 50 or over has at least one risk factor for an increased risk of cardiovascular disease.
• Increased fish consumption by women of childbearing age who eat little or no fish would probably be positive. n-3 fatty acids are required for normal development of children during the gestation period and early infancy. Fish consumption 2-3 times a week, with 1 portion consisting of fatty fish, provides a satisfactory intake of long-chain n-3 fatty acids for the majority of the population.
• Intake of vitamin D is low in relation to nutritional recommendations for a large proportion of the population. Increased consumption of fish by those who eat little or no fish would considerably improve the intake of vitamin D. Increased intake of vitamin D contributes to improved vitamin D status and thereby decreases the risk of osteoporosis and fractures.
• Regular consumption of certain types of fish (e.g. fatty Baltic fish and freshwater fish) with increased concentrations of environmental toxins can lead to the so-called tolerable intake levels regarding dioxins/dioxin-like PCBs and methyl mercury being exceeded. This primarily concerns children and women of childbearing age as regards dioxins/dioxin-like PCBs, and pregnant and lactating women and children as regards methyl mercury. However, consumption of these types of fish is low for most individuals.
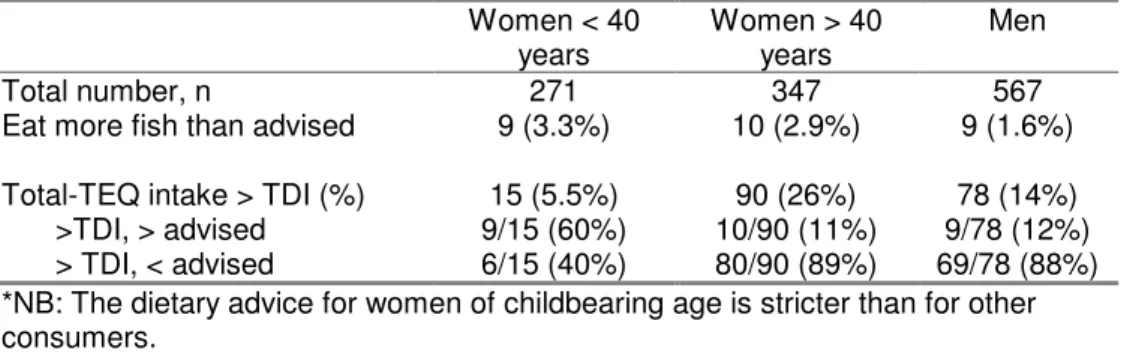
• An estimated 5% of women in the ages 17-40 years have a dioxin intake that exceeds TDI of 2 pg/kg body weight/day, but many of these eat oily Baltic fish more often than the Administration’s current advice of at most once a month. For a woman who eats fish in accordance with the general advice (lean sea fish/freshwater fish 2 times per week and oily fish, e.g. farmed salmon, 1 time per week) and who otherwise eats a diet in accordance with nutritional recommendations, TDI is not exceeded. However, the proportion that exceeds TDI can be around 35% in the following scenario: Total consumption of fish 3 times per week, of which oily Baltic fish 1 time per month (i.e. corresponding to the current dietary advice) and other oily fish (e.g. farmed salmon) 3 times per month. It is therefore not advisable to generally recommend an increase in consumption of oily Baltic fish, since the scope for increased consumption is highly limited for certain groups. However there is no reason to completely advise against consumption of oily Baltic fish.
• It should be emphasised that PCB and dioxins are accumulated in the body over a long time and that it is the total body load of these compounds, and not the actual intake, that is critical from a risk perspective. Exceeding the tolerable intake thus does not mean that health effects immediately arise, but that the safety margin decreases.
• Consumption of freshwater fish is low in the population and intake of methyl mercury does not exceed the JECFA’s provisional tolerable weekly intake (PTWI) of 1.6 µg/kg. Limited consumption of fish with up to 1 mg/kg methyl mercury (at most once per month) is estimated to give a small risk of the tolerable intake being exceeded. However, regular consumption of freshwater fish with higher concentrations can lead to the tolerable intake being exceeded. Pregnant women are the group in the population that is most sensitive to methyl mercury due to the greater sensitivity of effects on the foetus.
• In a large proportion of the population there is scope to increase fish consumption without any fear of the tolerable intake levels of environmental pollutants being exceeded. Consumption of the commonest fish species 2-3 times a week, with a mixture of lean and oily fish species, carries a small risk of exceeding tolerable intake levels. The model calculations carried out demonstrate that increased consumption of fish provides health advantages in the form of improved nutrient intake. However, the scope for oily Baltic fish and fish containing high concentrations of MeHg is limited for certain groups.
• In some examples, balanced quantitative risk parameters such as QALYs (Quality Adjusted Life Years) have been applied to fish consumption and the health effects of n-3 fatty acids and methyl mercury have been
compared. The net result in the form of positive or negative health effects is dependent on whether the entire population is studied or whether different groups are studied separately.
• In some examples, DALYs (Disability Adjusted Life Years) have been applied to nutritional, microbiological and toxicological food-related aspects in order to estimate the consequences for public health at present and after desirable changes in dietary patterns, incl. increased consumption of fish. The results indicate that an increase in fish consumption would provide health benefits expressed as DALY.
• The scientific basis at present does not allow balanced quantitative risk/benefit assessments of all the health effects associated with fish consumption. However from a consumer perspective it is an advantage for experts from different disciplines to jointly draw up a complete picture that illustrates both risk and benefit aspects. This area is being developed and should be actively monitored by the National Food Administration.
Consumption of fish in Sweden
According to the latest national dietary investigation (Riksmaten, 1997-98) consumption of fish and shellfish among adults was on average 30-35 g/day. Between 20 and 30% ate fish more seldom that once per week. Cod and similar fish and fish products (fish fingers, fish balls) were consumed most, followed by other sea fish, shellfish and processed fish. Older people mainly eat more oily fish such as processed herring, salmon and salmonids, while younger people prefer lean fish and fish products such as fish fingers and fish balls. Investigations in pregnant and lactating women indicate lower fish consumption than for adults in general. Results from investigations of the dietary habits of 4-year-olds and children in school years 2 and 5 (Riksmaten – barn, 2003) showed that intake of fish and fish products was on average 17-19 g/day, with small variations between these groups. Between 35 and 45% of the children did not eat fish during the recording period (4 days). The commonest fish meals consisted of fish fingers, fish balls, farmed salmon/rainbow trout and lean sea fish.
Investigations of consumption among ‘high consumers’ (mainly professional fishers and anglers and their families) show that consumption among these groups is up to several-fold greater than consumption in the adult population in general.
Content of nutrients and environmental pollutants
Fish is generally a good source of several nutrients and contributes on average one-quarter of the intake of vitamin D, B12 and selenium. Fish represents one-fifth
of total intake of n-3 fatty acids and 80% of the long-chain n-3 fatty acids in the diet. High consumption of fish is associated with higher intake of e.g. vitamin D and selenium. Low fish consumption generally means that intake of long-chain n-3 fatty acids and vitamin D is too low.
Persistent organic pollutants (POPs) are fat-soluble and are therefore found in oily fish such as North Sea herring and salmonids, but are also present in other foods of animal origin. Intake calculations have shown that around half of the dioxin intake in adults is estimated to come from fish and fish products, with other animal products being responsible for the remaining half. For the fish species commonly consumed in Sweden, the concentrations of dioxins/dioxin-like PCBs are usually under the EU limits for fish by a good margin, but there are exceptions. The highest concentrations are found in oily fish caught in the wild in the Baltic, Bay of Bothnia and Lakes Vänern and Vättern, e.g. salmon, salmon trout, Baltic herring and eel. Median intake of dioxins/dioxin-like PCBs in Swedish consumers is estimated to be around half the tolerable intake. Due to great variation in dioxin intake, at the same time around 5% of women of childbearing age have an intake above the tolerable intake. Dioxin intake, expressed on a body weight basis, is also age-dependent and decreases from infancy to adulthood, before increasing slightly again for people in their thirties and older. The higher intake is children is due to a higher body weight-based nutrient intake, and the reason for the higher intake in older people is probably higher consumption of fish. The highest intake of dioxins is observed in breastfeeding babies, since breast milk contains relatively high dioxin concentrations.
Methyl mercury is present in fish and the concentrations vary depending on fish species and capture site. For those fish that are usually consumed in Sweden methyl mercury concentrations are low as a rule, but there are exceptions. Elevated concentrations are found in predatory fish such as pike, pike-perch, perch, halibut, some tuna and swordfish. For predatory fish captured in inland waters the variation in methyl mercury concentration is very large as a result of several factors. Swedish intake calculations and exposure studies have shown that the vast majority of consumers do not exceed the tolerable intake of methyl mercury, but there are exceptions. Very high fish consumption regardless of fish type, or regular consumption of fish with elevated methyl mercury levels can lead to the tolerable intake being reached or exceeded.
Quantitative risk-benefit assessments
Various methods have been used to quantitatively assess and evaluate the risks and benefits of consumption of different types of food. DALY (disability adjusted life years) and QALY (quality adjusted life years) are different measures of the health status in a population. These measures have been used in recent years to assess the effects of food consumption. A few calculations have been published that include fish, where the content of n-3 fatty acids and methyl mercury has been
considered. The results of these calculations show that the health effects of increased fish consumption are dependent on factors such as the concentration of environmental pollutants in the fish and the target group. With the entire population as the target group, the positive health effects (decreased risk of cardiovascular disease due to n-3 fatty acids) exceeded the negative effects (impaired foetal development due to methyl mercury). When the target group was women of childbearing age, the negative effects were able to dominate due to the content of mercury in the fish consumed, since the risk of suffering from cardiovascular disease is small in this group.
Model calculations using Swedish data
The project group concluded that it was not possible to carry out a balanced quantitative risk-benefit assessment. The reasons include the supporting data not consistently specifying quantification in terms of dose-response for exposure or incidence values for health effects on humans. However, the risks can be quantified in the form of exceedance of tolerable intake expressed as TDI or PTWI and compared with beneficial effects in terms of how intake of nutrients, e.g. n-3 fatty acids and vitamin D, fulfil actual recommendations. This was done in so-called model calculations using dietary data from Riksmaten 1997-98. The model calculations for women of childbearing age show that the risk of intake of dioxin-TEQ exceeding the tolerable weekly intake of 14 pg/kg body weight (TWI) is low for consumption of Baltic herring up to around 1 portion per month if consumption of other fish remains unchanged. With this level of consumption, intake of long-chain n-3 fatty acids in around a third of the women is under the suggested desirable level of 0.2 g/day. If the calculations are instead based on consumption of e.g. farmed salmon, then 1 portion per month, together with the current intake of other fish, would give an intake of marine n-3 fatty acids of around 0.2 g/day in the majority of the women. However, if the women were to increase their total consumption of fish in accordance with the general dietary advice, the proportion exceeding the TDI would be around 35% for the following scenario: total consumption of fish 3 times per week, of which oily Baltic fish 1 time per month (i.e. corresponding to the current dietary advice) and other oily fish (e.g. farmed salmon) 3 times per month.
Corresponding calculations were made for intake of vitamin D and methyl mercury in relation to consumption of freshwater fish with varying concentrations of methyl mercury. The results for methyl mercury show that none of the women exceed the provisional tolerable weekly intake (PTWI) of 1.6 µg/kg body weight at a consumption of freshwater fish with a concentration of 0.5 mg/kg up to 2 times per month. At a concentration of 1 mg/kg, the PTWI is reached by around 1% of the women at a consumption of 2 times per month. The average intake of vitamin D also increases, even though the recommended intake is not completely achieved.
Calculations based on the National Food Administration’s food-based dietary advice (SNO, Swedish Nutrition Recommendations Objectified) show that increasing fish consumption in accordance with the current nutrient-based recommendations to 2-3 portions a week would means intake of long-chain n-3 fatty acids increasing from an average of just over 0.2 g/d to 0.4-0.5 g/d in adults, i.e. being doubled. In addition, intake of other nutrients such as vitamin D and selenium would increase to the recommended levels. Exposure to dioxin/PCBs and methyl mercury was also calculated for an adult woman. If the dietary advice (for fish 2-3 times per week) is followed and if they eat the most commonly occurring commercial fish types such as cod, saithe, haddock, farmed salmon, and fish products such as fish balls, the risk of the tolerable intake being exceeded is small. However, if they regularly eat fish with elevated levels of persistent organic pollutants or methyl mercury, the tolerable intake levels can be exceeded.
Expertise requirements for risk-benefit assessments
If the National Food Administration is to expand its risk assessment work to also include the beneficial aspects, current methods would need to be complemented with others that can evaluate and grade both the risks and benefits. This area is still under development internationally and there is currently no accepted methodology available for use. The National Food Administration should therefore actively monitor progress here. New methods for risk assessments are increasingly being based on the so-called benchmark method. Expertise in understanding and the ability to use these methods is required by the National Food Administration. Methods for intake calculations need to be developed and complemented with e.g. probability-based calculation models, both for acute and long-term exposure, in order to provide a better estimations of uncertainty and variation in exposure. Experience of working with probability models exists in the Microbiology and Toxicology Units and could be utilised for exposure analyses within other areas in the National Food Administration. The fundamental expertise required is mainly of a mathematical, statistical character and the majority of the work consists of analysis and description of data and application of probability models. It is important that such expertise be incorporated into the base organisation.
Work with DALY calculations or similar within the National Food Administration’s areas of activity would require increased expertise in epidemiology and access to empirical models. The project group concluded that it is not a primary objective for the National Food Administration to carry out its own DALY calculations. Resources should instead be devoted to improving the underlying support regarding e.g. concentrations of environmental pollutants and nutrients, consumption data, exposure calculations, health effects and dose-response relationships in humans. Such data can be of benefit in e.g. DALY
calculations or other types of risk-benefit assessments, in collaboration with external experts.
This pilot project demonstrates the advantages of experts from different disciplines meeting in a joint process to provide as complete a picture as possible of the consequences as regards risks and benefits on a population level, so that the choice of risk management measures is optimal from a public health perspective. The most probable scenario in any future risk-benefit assessments is that the potential to quantify both the risks and benefits is generally limited due to lack of quantitative data regarding exposure and effects. Even though there are difficulties in performing quantitative risk-benefit assessments, there are still great advantages in making as balanced an assessment as possible of both risks and benefits in order to provide the consumer with a complete picture. Such an assessment would then be semi-quantitative or qualitative, which is probably preferable to a one-sided risk or benefit assessment.
Summary of Appendix 1. Health Effects
Long-chain n-3 fatty acid supplements during pregnancy can increase the length of pregnancy (1.6 days), but the dose-response relationships are unclear. Increased supply of long-chain n-3 fatty acids can probably be beneficial if the n-3 status before pregnancy is low. Some studies indicate that intake of around 15-20 g fish per day, corresponding to 0.15-0.2 g marine n-3 fatty acids, can be sufficient. A number of studies indicate that supplying mainly long-chain n-3 fatty acids during the foetal stage and in the early years is related to certain cognitive functions in child. The doses have generally been considerably larger than the intake that can normally be achieved via the diet. The supporting data are not sufficient to reliably establish the optimal level of intake of various n-3 fatty acids. Intake of DHA in the order of magnitude of 0.1-0.3 g/d via the diet has been suggested to be adequate during pregnancy. This corresponds to fish consumption 2-3 times per week, with one portion of oily fish.
The importance of intake of fish and n-3 fatty acids for the risk of developing allergies and other inflammatory conditions is still unclear. However there are studies showing beneficial effects of supplying large doses of long-chain n-3 fatty acids in the form of fish oil for certain conditions, e.g. rheumatoid arthritis, while such supplementation has had no clear effects asthma, cystic fibrosis or inflammatory diseases of the intestine.
Lower blood levels of n-3 fatty acids have been demonstrated for various neurological complaints. The importance of intake via the diet for the emergence of such complaints is unclear, but there are epidemiological data indicating that low intake or tissue levels of long-chain n-3 fatty acids can be important for the
development of certain complaints, e.g. dementia. However, results from controlled studies in which supplements containing e.g. n-3 fatty acids were provided have not shown any clear positive effects.
Regular consumption of fish can contribute to decreasing the risk of cardiac mortality. The evidence is strongest for individuals with an increased risk. Cohort studies also indicate that relatively moderate consumption can decrease the risk in the general population. The estimates of dose-response relationships that have been made are based on cohort studies and give variable results, which can be due e.g. to uncertainties in the dietary data, which are usually based on frequency methods. In a meta-analysis of cohort studies, a reduced risk was observed for fish consumption 1 time per week or more often.
The importance of fish consumption and intake of long-chain n-3 fatty acids for the incidence of various forms of cancer is unclear. Reviews of the results from epidemiological studies show little or no effects.
Dioxins and PCB are absorbed reasonably well from the gastro-intestinal tract, with calculations from a generally used degree of absorption of 50% up to an assumed absorption of 90% in some studies. The half-life in the body is considered to be 7-8 years for the most toxic dioxin compound (2,3,7,8-TCDD), but a range from 2 to 16 years has been calculated for the group dibenzodioxins/-furans.
In epidemiological studies, certain effects on gender ratio, length and regularity of the menstruation cycle and sperm status have been reported in populations where dioxin exposure in the acute phase has been very high. However, it is unclear what these observations mean for reproductive ability. In experimental studies on monkeys and rats, reproductive ability was affected (abortions and incomplete gestations), and in rodents there were also foetal abnormalities after dioxin exposure.
A number of human studies have indicated negative effects on child development after exposure to dioxins and PCBs during the foetal and breastfeeding stage. The effects on children born to mothers with high exposure include low birth weight, delayed development during childhood, with e.g. behavioural changes, changes/ malformations of the genital organs, changes in dentition and effects on the immune system. In populations with moderately higher exposure to dioxins and PCB, as in Sweden, it is more difficult to draw conclusions on causal relationships between exposure and effects. Certain studies indicate impaired cognitive and psychomotor development and immunological effects, while other studies have not shown corresponding effects. The effects reported in humans in epidemiological studies are supported by findings in animal studies.
High occupational TCDD exposure has been related to changes in markers for immune system function, but it has not been possible to establish that these
changes are significant for health. In children exposed to background levels, a correlation was observed between dioxin/PCB exposure and changes in the amount of white blood cells, antibodies and in certain cases also an increased risk of ear infections. However the relationship between asthma/allergies and dioxin exposure is difficult to interpret. In animal trials too, an effect on immune status has been seen, e.g. in the form of downregulation of the immune response in rats. The carcinogenic characteristics of dioxins have been described in animal trials, where higher doses have been used. In occupationally-exposed cohorts, a correlation has been observed between dioxin exposure and increased frequency of certain forms of cancer. IARC has classified TCDD as a human carcinogen (group 1), while other dioxin/furan-congeners are unclassified (group 3). It is difficult to use epidemiological data to quantify the cancer risk in humans. There are many failings in the epidemiological studies as regards e.g. treatment of confounding problems and multiexposure. In addition, the exposure analysis is often faulty in many cases. It should also be emphasised that the non-occupationally exposed population is exposed to TCDD levels that are two to three orders lower than the estimated potential lifetime doses in occupationally-exposed groups, i.e. in those cohorts for which a risk increase has been demonstrated.
The effects on the nervous system of exposure to methyl mercury during the foetal stage have been studied in a number of populations with elevated chronic exposure. The two most significant studies have reported contradictory results. In a study from the Seychelles, no correlation was reported between prenatal exposure to methyl mercury and negative effects up to 9 years of age, while a study from the Faroe Islands reported a significant correlation between prenatal exposure to methyl mercury and child development, particularly as regards alertness, language and memory at 7 years of age.
Epidemiological data indicate that there is a correlation between high MeHg-exposure and an increased risk of acute heart attack, but the conclusions on the shape of the dose-response curve are partly unclear. In the Swedish studies that have been carried out no such correlation has been found, and this can probably be explained by the exposure to MeHg having been considerably lower than in e.g. Finnish studies. In fact, in the Swedish studies there has been a positive correlation between exposure to MeHg and decreased risk of heart attack. This can be interpreted as the protective effects of the n-3 fatty acids (and perhaps also selenium) dominating up to a certain intake level at which the MeHg-induced negative effects begin to dominate. However, there are some minor Swedish studies of individuals who eat a lot of fish with elevated MeHg concentrations showing that this exposure can be of the same level as that reported in the Finnish studies. Therefore the possibility cannot be ruled out that within the Swedish population there are groups that have such a high intake of MeHg that the risk of cardiovascular disease in these groups can be elevated. There is no basis for determining the magnitude of this proportion, but it is probably small and limited
to individuals who eat self-caught fish with elevated MeHg concentrations very regularly.
The few studies on rodents that have been reported show that MeHg has the potential to influence the immune response in adults and foetuses. However, these studies do not give a clear answer as regards what the most sensitive immunological parameters are, or in what direction MeHg affects the individual parameters. It is unclear to what extent MeHg exerts effects on the immune response at low exposure levels and also what is the highest exposure level that does not give rise to effects.
Summary of Appendix 2. Risk Management
Appendix 2 describes national and international risk management measures, such as limit values and dietary advice. Dietary advice in all cases involves recommending regular fish consumption, with variations between lean and oily fish types, to the population in general. At the same time, the advice given to sensitive groups involves limiting or completely avoiding consumption of certain fish species.
Background
The work of the National Food Administration is aimed at decreasing the health risks of food and at promoting good dietary habits. This means that it is essential to assess both the risks and benefits of consumption of particular foods. The work on these issues is to be based on the risk analysis model developed at the Administration. For fish, there are general recommendations on increased fish consumption and detailed dietary advice on limiting consumption of specific types of fish in order to avoid high exposure to methyl mercury and persistent organic pollutants. In addition to dietary advice, there are also limit values for the highest permissible concentrations of mercury and dioxins in commercial fish.
The current general advice is that from a health perspective most people should eat more fish, both lean and oily. This advice is based on data from clinical and epidemiological studies showing that regular consumption of fish can decrease the risk of e.g. cardiovascular disease. Fish is also an important source of several vitamins and minerals, e.g. vitamin D, iodine and selenium. Increased consumption is desirable to increase intake of vitamin D, selenium and n-3 fatty acids in particular, and to decrease intake of other less beneficial foods. The dietary limiting advice is primarily directed at the risk groups pregnant women, women of childbearing age and girls, but also at high consumers of fish (see Appendix 2). The advice is based on both animal studies and epidemiological investigations. The studies show that high exposure to methyl mercury and organochloride compounds can have health effects in foetuses and infants.
Dioxins and PCB are groups of environmental pollutants that are broken down very slowly in the environment and that accumulate in fat-rich matrices. These properties mean that the compounds are taken up in the fat fraction in organisms at various levels in the food chain and accumulated at increasing concentrations with increasing distance up the food chain. This so-called biomagnification is particularly efficient in the aquatic environment, which means that animals higher up in the food chain such as ospreys, sea eagles, otters and seals, risk having very high concentrations of dioxins and PCB in their body fat. People who eat fish and other animal-based foods also risk having relatively high body loads and a diet with a small proportion of animal fat can thus decrease exposure to these compounds. Humans also live to a greater age than most other animals, which leads to a relatively high body load since the concentration of these long-life organic compounds in the body increases with age.
Mercury (Hg) can be spread long distances via the atmosphere and is converted in natural processes into methyl mercury (MeHg). MeHg passes easily across the cell membrane and uptake of MeHg in organisms is therefore high. In the ecosystem there is a biomagnification, which means that the muscle tissue of edible fish such
as pike and other predatory fish can contain relatively high concentrations of MeHg. Similarly, predatory fish in the marine environment, e.g. tuna, halibut and swordfish, have higher concentrations of MeHg than fish species further down in the food chain. However, MeHg is present in all fish, even in important food fish – but in considerably lower concentrations. Fish is the clearly dominant source of MeHg exposure in humans.
Aims and Scope
The aim of the present project was to examine the methods and data support used for risk-benefit assessments of fish consumption, i.e. methods that simultaneously take into account and evaluate both negative and positive health effects, and to carry out a risk-benefit assessment of fish consumption based on Swedish conditions. The analyses were restricted to certain nutrients (n-3 fatty acids, vitamin D) and environmental pollutants (dioxins, dioxin-like PCB, MeHg) that the project group deemed to be the most important, and for which data regarding intake and health effects were also available.
The project group carried out an inventory of risk-benefit assessments in which quantitative estimations had been made of the health outcome of fish consumption in terms of e.g. DALY (Disability Adjusted Life Years) or QALY (Disability Adjusted Life Years) based on the content of e.g. n-3 fatty acids and environmental pollutants. The health effects used in these assessments mainly comprise cardiovascular disease and neurological effects during early development. In addition, calculations were made of how varying intake of fish affects the risk of exceeding the current TWI (tolerable weekly intake) for dioxins/PCBs or the PTWI (provisional TWI) for MeHg as the sole parameter in the risk-benefit assessment. It should be pointed out that exceeding the tolerable intake levels does not mean that health effects arise, but that the safety margin is less. Benefit assessments were based on how recommendations for intake of n-3 fatty acids and vitamin D are fulfilled in relation to actual recommendations, including the Swedish nutritional recommendations.
The results of the project will form part of the underlying support for the revision of dietary advice on fish that will take place during 2006-2007. The report can also be used as support for continuing work on risk-benefit assessments at the National Food Administration.
Consumption of fish in Sweden
Statistics on consumption of fish and fish products (excl. angling) are produced by the Swedish Board of Agriculture (SJV, 2005). Since 2000, no details are reported on the total consumption of fish, but rather on certain fish products (SJV, 2005). Catch statistics are reported by the Swedish Board of Fisheries (Fiskeriverket, 2005). Statistics on household spending on fish and fish products are collected in the Central Statistics Bureau investigations of household spending (HUT) (SCB, 2005). Data on consumption of fish are also collected in investigations of dietary habits and in epidemiological studies. The results from some national and targeted dietary investigations are reported here.
Adults
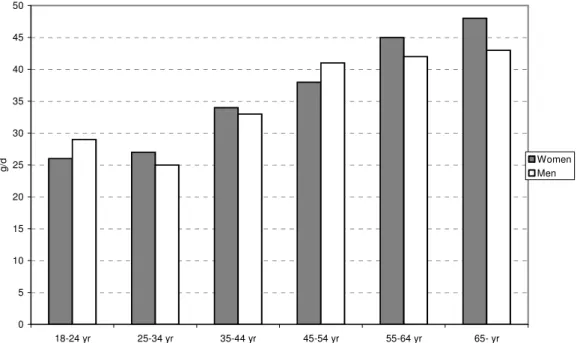
According to the latest dietary survey Riksmaten 1997-98, consumption of fish and shellfish among adults is on average up to 30-35 g/d (Becker & Pearson, 2002). These figures are based on results from 7-day records (menu diaries) of food intake. Consumption is highest among older people, see Figure 1. On average, fish and shellfish were consumed 6.5 times per month.
0 5 10 15 20 25 30 35 40 45 50 18-24 yr 25-34 yr 35-44 yr 45-54 yr 55-64 yr 65- yr g /d Women Men
Fig. 1. Average consumption per day of fish and shellfish in Riksmaten 1997-98 according to age and gender. Data from 7-day menu diaries.
Consumption frequencies for different types of fish and fish products were also collected in Riksmaten with the help of questionnaires. For people in the age range 17-49 years, around 2% stated that they did not eat fish at all, while approx. 8% never ate oily fish. In the older group, 50-74 years, the corresponding figures were 2% and 4%. Only 2% of the younger group stated that they ate fish more seldom than once a month, while the corresponding figure for oily fish was 44%. In the older group, 1% of individuals reported that they ate fish more seldom than once a month, while 21% ate oily fish to the same limited extent. At least one fish dish per week was reported by 73% of the younger group and by 81% of the older group.
The majority of the adult population stated that they ate herring and salmon from the Baltic a few times per year or never. Fifteen percent stated that they ate Baltic herring 1-3 times per month, while 2% stated 1 time per week. One percent reported that they ate Baltic salmon 1-3 times per month and 1% one time per week. Half the individuals stated that they generally did not eat freshwater fish (pike, pike-perch, perch, burbot), 39% ate freshwater fish a few times per month and 6% ate freshwater fish 1-3 times per month.
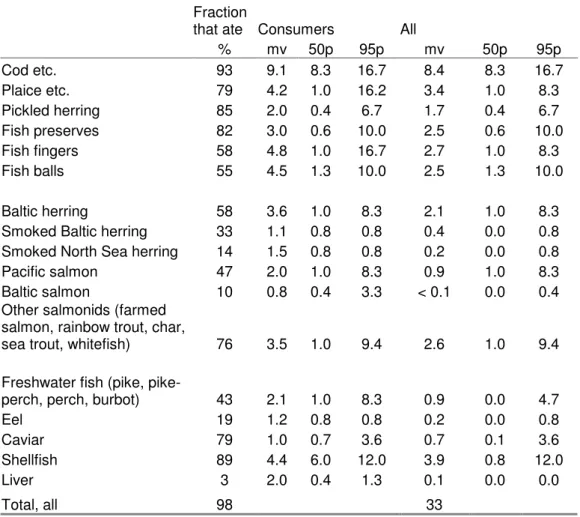
To estimate the amounts consumed, the consumption frequencies were combined with standard portions for the different alternatives. Table 1 shows consumption of different types of fish and fish products. Estimates of total fish consumption from questionnaire data agree well with data from the menu diaries. However, comparisons with catch statistics for Baltic salmon showed that the questionnaire responses gave a large overestimation of consumption (Ankarberg & Petersson Grawé, 2005). This indicates that consumers probably have difficulty in distinguishing between farmed salmon and wild Baltic salmon. Estimates of consumption from the questionnaire responses have therefore been adjusted on the basis of catch statistics (Table 1).
Table 1. Consumption of fish types (g/d) according to a questionnaire in the dietary habits survey Riksmaten 1997-98 (n=1211). Mean values (mv) and 50 and 95 percentiles (50p, 95p)
Fraction
that ate Consumers All
% mv 50p 95p mv 50p 95p Cod etc. 93 9.1 8.3 16.7 8.4 8.3 16.7 Plaice etc. 79 4.2 1.0 16.2 3.4 1.0 8.3 Pickled herring 85 2.0 0.4 6.7 1.7 0.4 6.7 Fish preserves 82 3.0 0.6 10.0 2.5 0.6 10.0 Fish fingers 58 4.8 1.0 16.7 2.7 1.0 8.3 Fish balls 55 4.5 1.3 10.0 2.5 1.3 10.0 Baltic herring 58 3.6 1.0 8.3 2.1 1.0 8.3
Smoked Baltic herring 33 1.1 0.8 0.8 0.4 0.0 0.8
Smoked North Sea herring 14 1.5 0.8 0.8 0.2 0.0 0.8
Pacific salmon 47 2.0 1.0 8.3 0.9 1.0 8.3
Baltic salmon 10 0.8 0.4 3.3 < 0.1 0.0 0.4
Other salmonids (farmed salmon, rainbow trout, char,
sea trout, whitefish) 76 3.5 1.0 9.4 2.6 1.0 9.4
Freshwater fish (pike,
pike-perch, pike-perch, burbot) 43 2.1 1.0 8.3 0.9 0.0 4.7
Eel 19 1.2 0.8 0.8 0.2 0.0 0.8
Caviar 79 1.0 0.7 3.6 0.7 0.1 3.6
Shellfish 89 4.4 6.0 12.0 3.9 0.8 12.0
Liver 3 2.0 0.4 1.3 0.1 0.0 0.0
Total, all 98 33
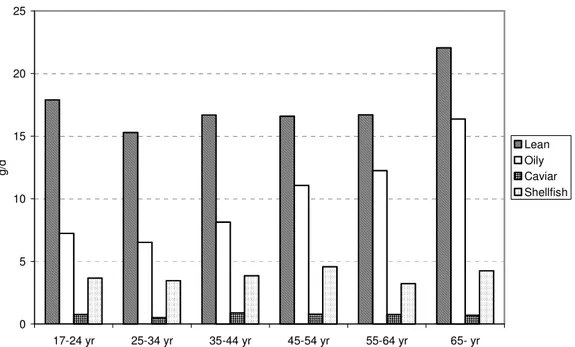
Cod and similar fish and products made from these (fish fingers, fish balls) were consumed most, followed by other saltwater fish, shellfish and fish preserves. Older people mainly eat more oily fish, such as herring products, salmon and salmonids, while younger people prefer lean fish and fish products, e.g. fish fingers and fish balls (Figure 2).
0 5 10 15 20 25 17-24 yr 25-34 yr 35-44 yr 45-54 yr 55-64 yr 65- yr g /d Lean Oily Caviar Shellfish
Fig. 2. Consumption of fish and shellfish according to a questionnaire in the dietary habits survey Riksmaten 1997-98, sub-divided according to age. Mean values (g/day).
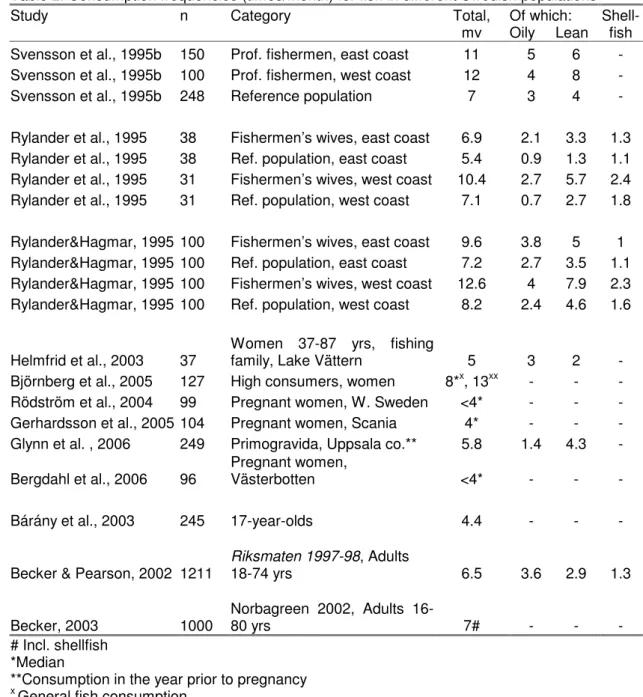
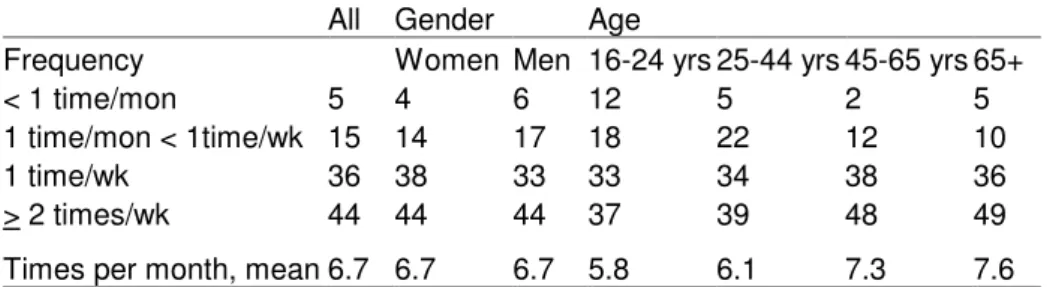
Consumption frequencies for fish and shellfish according to various studies are shown in Table 2. In a questionnaire study on dietary habits among the adult population of Sweden in 2002, fish and shellfish were consumed on average 7 times per month, of which over 5 consisted of fish (Becker, 2002). In this study too, consumption among older people was higher than among younger. Around 75% of people reported that they ate fish, including shellfish, more than once a week or more, which agrees well with the results in Riksmaten, despite there being 4-5 years between the two studies. Around 10% reported that they fish once a month or less, which is more than was reported in Riksmaten.
Table 2. Consumption frequencies (times/month) for fish in different Swedish populations
Study n Category Total,
mv
Of which: Oily Lean
Shell-fish
Svensson et al., 1995b 150 Prof. fishermen, east coast 11 5 6 -
Svensson et al., 1995b 100 Prof. fishermen, west coast 12 4 8 -
Svensson et al., 1995b 248 Reference population 7 3 4 -
Rylander et al., 1995 38 Fishermen’s wives, east coast 6.9 2.1 3.3 1.3
Rylander et al., 1995 38 Ref. population, east coast 5.4 0.9 1.3 1.1
Rylander et al., 1995 31 Fishermen’s wives, west coast 10.4 2.7 5.7 2.4
Rylander et al., 1995 31 Ref. population, west coast 7.1 0.7 2.7 1.8
Rylander&Hagmar, 1995 100 Fishermen’s wives, east coast 9.6 3.8 5 1 Rylander&Hagmar, 1995 100 Ref. population, east coast 7.2 2.7 3.5 1.1 Rylander&Hagmar, 1995 100 Fishermen’s wives, west coast 12.6 4 7.9 2.3 Rylander&Hagmar, 1995 100 Ref. population, west coast 8.2 2.4 4.6 1.6
Helmfrid et al., 2003 37
Women 37-87 yrs, fishing
family, Lake Vättern 5 3 2 -
Björnberg et al., 2005 127 High consumers, women 8*x, 13xx - - -
Rödström et al., 2004 99 Pregnant women, W. Sweden <4* - - -
Gerhardsson et al., 2005 104 Pregnant women, Scania 4* - - -
Glynn et al. , 2006 249 Primogravida, Uppsala co.** 5.8 1.4 4.3 -
Bergdahl et al., 2006 96
Pregnant women,
Västerbotten <4* - - -
Bárány et al., 2003 245 17-year-olds 4.4 - - -
Becker & Pearson, 2002 1211
Riksmaten 1997-98, Adults 18-74 yrs 6.5 3.6 2.9 1.3 Becker, 2003 1000 Norbagreen 2002, Adults 16-80 yrs 7# - - - # Incl. shellfish *Median
**Consumption in the year prior to pregnancy x
General fish consumption xx
Detailed survey of consumption of specific types of fish
Other studies mainly include high consumers of fish, but also reference groups of the general population and pregnant and breastfeeding women. Within the framework of the Environmental Protection Agency’s health-related environmental monitoring, a number of studies have been carried out on exposure to environmental pollutants in pregnant women, where fish consumption has also been reported (Rödström et al., 2004; Gerhardsson et al., 2005; Glynn et al., 2006; Bergdahl et al., 2006). In all cases, selection was random and representative of this population group, with a certain reservation that women born abroad may have been under-represented. Mean or median consumption of fish in all studies of
pregnant women lies in the range <4-5.8 times per month and is lower than that reported for other groups in the population and in Riksmaten (6.5 times/month).
High consumers
A number of investigations on high consumers of fish have been carried out in Sweden. A study of 127 female high consumers of fish was carried out in 2001 to investigate exposure to environmental pollutants (Björnberg et al., 2005a). According to a survey that included questions on consumption of individual fish species, the median value for combined fish consumption was 4.3 meals per week, with large variation. The responses to a general question about how often fish was consumed gave a lower frequency, a median value of 2 meals per week with a variation of 0.5-7 meals.
Women living in the vicinity of Lake Vättern reported that they ate fish 5 times per month (Helmfrid et al., 2003). Sporting anglers are a group that can be expected to have higher consumption of fish than other groups. Among sporting anglers in Hagfors (Lake Vänern), one-third ate freshwater fish (pike and pike-perch) at least once a week (Johnsson et al., 2004). A smaller study from the same area comprised 20 older men and of these, 6 ate freshwater fish at least once a week, 8 ate freshwater fish a few times per month, and 6 did not eat freshwater fish (Johnsson et al., 2005).
Professional fishermen are another group that has been shown to have high fish consumption. Surveys of fish consumption among fishermen on the east and west coast showed that fish consumption was approx. double that in the normal population (Hagmar et al., 1992; Svensson et al., 1995b). In the group fishermen’s wives, which can constitute a particular risk group if the women are of childbearing age, fish intake was also approx. double that in the corresponding section of the general population (Rylander & Hagmar, 1995). Fishermen’s wives ate on average 3-4 meals of oily fish per month, but the variation in intake of oily fish and in total amount of fish was considerable.
A study has been carried out on fish consumers in Sweden and Latvia, where intake of oily Baltic fish, mainly wild salmon and herring, was recorded (Sjödin et al., 2000). High consumers from Sweden reported that they ate oily east coast fish in 16 meals per month (median), with a maximum intake of 20 meals per month. The results from these studies show that consumption among high consumers is up to several-fold as much as in the general adult population, see example in Table 2.
Children
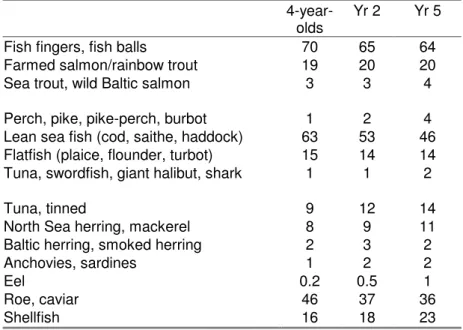
The National Food Administration’s diet investigation Riksmaten – barn 2003, described the dietary habits of 4-year-olds and children in school years 2 and 5 (aged 8 and 11). The study included a questionnaire on consumption frequencies for different types of fish and fish products (Becker & Enghardt Barbieri, 2004). Table 3 shows the proportion of children that ate these types of fish more frequently than once per month and once per week. The children’s food intake was also recorded for four days in a food diary. Intake of fish and fish products was on average 17-19 g/day, with small variations between the ages (Enghardt Barbieri et al., 2006). Between 35 and 45% of the children did not eat fish during the recording period (4 days). The commonest fish dishes consisted of fish fingers, fish balls, lean sea fish and farmed salmon/rainbow trout. Less than 0.5% of the children responded that they ate freshwater fish more often than once a week. In a study of teenagers carried out in 1996, consumption of fish was 4.4 times per month (Bárány et al., 2003).
Table 3a. Percentage of children eating different types of fish more often than once per month
4-year-olds
Yr 2 Yr 5
Fish fingers, fish balls 70 65 64
Farmed salmon/rainbow trout 19 20 20
Sea trout, wild Baltic salmon 3 3 4
Perch, pike, pike-perch, burbot 1 2 4
Lean sea fish (cod, saithe, haddock) 63 53 46
Flatfish (plaice, flounder, turbot) 15 14 14
Tuna, swordfish, giant halibut, shark 1 1 2
Tuna, tinned 9 12 14
North Sea herring, mackerel 8 9 11
Baltic herring, smoked herring 2 3 2
Anchovies, sardines 1 2 2
Eel 0.2 0.5 1
Roe, caviar 46 37 36
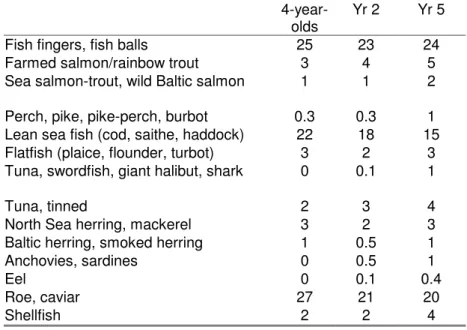
Table 3b. Percentage of children eating different types of fish more often than once per week
4-year-olds
Yr 2 Yr 5
Fish fingers, fish balls 25 23 24
Farmed salmon/rainbow trout 3 4 5
Sea salmon-trout, wild Baltic salmon 1 1 2
Perch, pike, pike-perch, burbot 0.3 0.3 1
Lean sea fish (cod, saithe, haddock) 22 18 15
Flatfish (plaice, flounder, turbot) 3 2 3
Tuna, swordfish, giant halibut, shark 0 0.1 1
Tuna, tinned 2 3 4
North Sea herring, mackerel 3 2 3
Baltic herring, smoked herring 1 0.5 1
Anchovies, sardines 0 0.5 1
Eel 0 0.1 0.4
Roe, caviar 27 21 20
Content of nutrients and
environmental pollutants
Nutrients
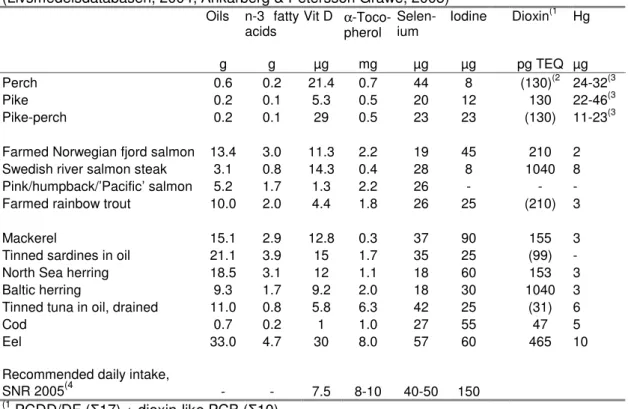
By tradition, fish has been an important part of the Swedish diet. Nutritionally, fish contributes a range of vitamins and minerals, particularly vitamin D, vitamin B12, selenium, iodine and tocopherols (vitamin E). Fish oil is characterised by a high proportion of polyunsaturated n-3 fatty acids (omega-3 series). Examples of the nutrient content in some types of fish are shown in Table 4. The vitamin D content is generally high in oily fish, but a number of lean fish species, such as whitefish, pike-perch and pike, can have equally high or higher concentrations. The iodine content is generally high in fish from salt water, but can also be relatively high in fish from the Baltic Sea and in certain freshwater fish, e.g. salmon-trout and burbot. A 100-150 gram portion of fish provides a large proportion of the recommended daily intake of e.g. vitamin D, vitamin E, iodine and selenium.
Table 4. Content of certain nutrients and environmental pollutants in different fish species (per 100 g edible part). The values shown are means or weighted values (Livsmedelsdatabasen, 2004; Ankarberg & Petersson Grawé, 2005)
Oils n-3 fatty acids Vit D α-Toco-pherol Selen-ium Iodine Dioxin(1 Hg g g µg mg µg µg pg TEQ µg Perch 0.6 0.2 21.4 0.7 44 8 (130)(2 24-32(3 Pike 0.2 0.1 5.3 0.5 20 12 130 22-46(3 Pike-perch 0.2 0.1 29 0.5 23 23 (130) 11-23(3 Farmed Norwegian fjord salmon 13.4 3.0 11.3 2.2 19 45 210 2 Swedish river salmon steak 3.1 0.8 14.3 0.4 28 8 1040 8 Pink/humpback/’Pacific’ salmon 5.2 1.7 1.3 2.2 26 - - - Farmed rainbow trout 10.0 2.0 4.4 1.8 26 25 (210) 3 Mackerel 15.1 2.9 12.8 0.3 37 90 155 3 Tinned sardines in oil 21.1 3.9 15 1.7 35 25 (99) - North Sea herring 18.5 3.1 12 1.1 18 60 153 3 Baltic herring 9.3 1.7 9.2 2.0 18 30 1040 3 Tinned tuna in oil, drained 11.0 0.8 5.8 6.3 42 25 (31) 6
Cod 0.7 0.2 1 1.0 27 55 47 5
Eel 33.0 4.7 30 8.0 57 60 465 10 Recommended daily intake,
SNR 2005(4 - - 7.5 8-10 40-50 150
(1
PCDD/DF (Σ17) + dioxin-like PCB (Σ10) (2
Values within brackets are extrapolated from concentrations in other fish species (3
Examples of mean values, considerably higher concentrations can be observed in certain areas
(4
Environmental pollutants
Organic environmental pollutants
Many targeted investigations of organic environmental pollutants in fish consumed in Sweden have been carried out over the years. The investigations carried out in the period 1985-1995 have been compiled in a report (Andersson et al., 1997). This report presents the concentrations in fish of PCBs, dioxins (PCDD/PCDFs) and a range of chloro-pesticides (DDT, HCB, HCHs, dieldrin, chlordanes, toxaphen). The concentrations of organic environmental pollutants (PCB, dioxins and other compounds) in fish are also reported in a national database within the framework of environmental monitoring (IVL, 2005).
In conjunction with the establishment of common EU limits for dioxins in commercial fish, a comprehensive investigation of dioxins and PCBs in commercial fish was carried out by the National Food Administration in collaboration with other authorities. Around 140 analyses were carried out in the period 2000-2003 of, in the first instance, oily east coast fish (incl. Baltic herring, wild salmon and sea trout, char), but also certain other fish species and shellfish. The results of the dioxin analyses are reported on the National Food Administration website (SLV, 2005). A number of cases of concentrations above the current limit for dioxins in fish (see Appendix 2) were recorded in herring and wild salmon from the Baltic Sea and the Bay of Bothnia. Particularly high dioxin concentrations were observed in Baltic herring caught off the Gästrike and Hälsingland coast (Bålsön, Västra Banken), while Baltic herring caught in the Bay of Bothnia and the southern Baltic Sea have considerably lower concentrations. In a 2005 study, dioxins and dioxin-like PCBs were analysed in Baltic herring from the Bay of Bothnia and the north of the actual Baltic Sea (Bignert et al., 2005). This study showed season-, age- and size-related differences in dioxin concentrations in fish, with Baltic herring caught in spring generally containing considerably higher concentrations than autumn-caught, including on a fresh weight basis. This means that spring-caught Baltic herring in this area in many cases exceed the limit for dioxins, and for dioxins + dioxin-like PCBs.
Dioxin-like PCBs also contribute to total-TEQ. Measurements show that dioxin-like PCBs in fish generally make up 40-60% of total-TEQ. In certain fish species, e.g. eel, dioxin-like PCBs make up 80% of total-TEQ (SLV, 2005).
Temporal trends in environmental pollutants in environmental matrices have been studied for long periods by the Swedish Museum of Natural History. The studies on fish include e.g. Baltic herring and North Sea herring and in these samples a number of organic environmental pollutants, including PCB and dioxins, have been analysed. The concentrations of most of these compounds have displayed a declining trend from the 1970s on. In the case of dioxins, however, the concentrations declined from the 1970s until to about 1990 but since then they have remained at about the same level (Bignert et al., 2005). The reasons for the
halt in the decline are unknown, but it could be due to continuing emissions of dioxins.
Methyl mercury
Mercury in fish occurs predominantly as methyl mercury (MeHg) (Westöö & Rydälv, 1969; Lasorsa & Allen-Gil, 1995; Storelli et al., 2003). The total concentration of mercury (total-Hg) in fish muscle in usually reported and calculations of exposure to MeHg often assume that 100% of the total-Hg in fish is made up of MeHg. For the fish species that are particularly interesting for calculation of mercury exposure in humans, the mercury concentration can vary greatly depending on the capture site (Andersson et al., 1987). Fish in nutrient-poor forest lakes have a higher mercury content than fish in nutrient-rich plains lakes. Other factors affecting the mercury content include the amount of mercury in circulation and a range of chemical, physical and biological factors in the water area. In Scania for example, the mercury content in pike is reported to vary at least tenfold between lakes, from <0.1 mg/kg to over 1 mg/kg in one-kilo pike (Meili et al., 2004). Predatory fish have higher Hg concentrations than other species, but the concentration also increases with size of the individual fish. The mean concentrations for the most commonly consumed marine fish species are <0.05 mg/kg. Certain marine fish species can contain high concentrations of MeHg, e.g. halibut, certain species of tuna, swordfish, shark and ray, for which mean concentrations have been reported to be in the range 0.7-1.8 mg/kg, but can be even higher (Ohlin, 1993; Storelli et al., 2003; Forsyth et al., 2004). In Swedish waters, it is pike, pike-perch, perch, burbot and eel that can particularly accumulate MeHg, but other species can also have elevated Hg concentrations depending on capture site, e.g. salmonids caught in Lakes Vänern and Vättern (Lindeström & Grotell, 1998; Sundström et al., 2004). Local emissions of Hg affect the Hg concentrations in fish to a great extent, as can be seen e.g. in the north of Lake Vänern (Lindeström, 2001). Coastal pike in areas without local impacts can have relatively low MeHg concentrations (Greyerz et al., 2000). As a basis for dietary advice and maximum levels, the National Food Administration in collaboration with the Swedish Board of Fisheries and the Environmental Protection Agency has mapped Hg concentrations in consumption fish. Sampling within the framework of the National Food Administration’s monitoring activities is not carried out at national level, but rather at municipal level. Only a few samples were taken in retail outlets on behalf of the National Food Administration in this mapping project. For details of actual concentrations, see Table 4. Investigations of the Hg concentration in fish have also been carried out by other actors, often within the framework of national and regional environmental monitoring. From an environmental status perspective, however, it is samples other than those from commercial fish that are of interest. It is therefore not always possible to use data from environmental monitoring to calculate exposure in humans. IVL Swedish Environmental Research Institute Ltd. is the database host for reporting of the investigations, incl. Hg in biota, that are carried
out within the framework of national and regional environmental monitoring (IVL, 2005).
No general continuous temporal trend monitoring as regards mercury content in consumption fish has been carried out. In the Environmental Protection Agency’s programme for environmental monitoring of freshwater, there are temporal trend data on mercury concentrations in pike from one lake, Storvindeln, perch from Skärgölen and Bälgsjön and salmon-trout from Abiskojaure. The concentration in pike-perch from Skärgölen has increased by 5% annually, while no trends can be observed in fish from the other lakes (Bignert, 2002).
Intake of nutrients and environmental
pollutants from fish
Nutrients
Adults
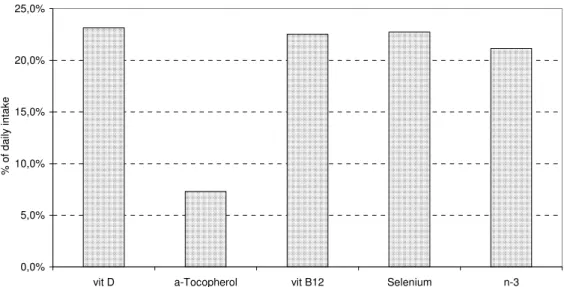
Dietary data from Riksmaten 1997-98 (Becker & Pearson, 2002) show that fish contribute on average one-quarter of the intake of vitamin D, B12 and selenium (Figure 3). Fish make up around one-fifth of the total intake of n-3 fatty acids and 80% of the long-chain n-3 fatty acids in the diet. In addition, fish contribute 5-10% of intake of protein, α-tocopherol and niacin. Previous studies showed that intake of e.g. vitamin D and selenium was higher among individuals who often consumed fish and fish products than among those who consumed fish once a week or never (Becker, 1995). Among high consumers of fish, the mean intake of both vitamin D and selenium was on the level of the recommended intake according to SNR (Swedish Nutritional Recommendations), while those who seldom or never ate fish had a low intake.
Children
According to the National Food Administration’s dietary survey Riksmaten – barn 2003, fish contributed 12-13% of selenium intake, around 10% of vitamin D intake, 52-56% of long-chain n-3 fatty acid intake and 4% of α-tocopherol intake, thus generally a smaller proportion than for adults (Enghardt Barbieri et al., 2006).
0,0% 5,0% 10,0% 15,0% 20,0% 25,0%
vit D a-Tocopherol vit B12 Selenium n-3
% o f d a ily i n ta k e
Fig. 3. Mean percentage contribution of certain nutrients from fish and shellfish in
Riksmaten 1997-98.
Dioxins and PCB
Adults
Intake of environmental pollutants in adults via the diet has been monitored in a number of investigations from the National Food Administration. In the case of organic environmental pollutants, such as PCBs and dioxins, intake estimates of these compounds were made in conjunction with the latest revision of dietary advice on oily Baltic fish (Darnerud et al., 1995; Wicklund Glynn et al., 1996). Data on concentrations used for these estimates were from the beginning of the 1990s and consumption data consisted of the Swedish Board of Agriculture’s per capita statistics for food. In 2002, new intake estimates based on the dietary survey Riksmaten 1997-98 were published (Becker & Pearson, 2002), where samples for concentration data were mainly collected in the period 1998-99 (Lind et al., 2002). The estimated intake of PCBs and dioxins in the latter study was considerably lower, only 20-30% of the values produced in the 1995 study. One explanation may be the decline in concentrations of these compounds that has taken place in the environment during the past decade. For example, a decline in the concentration of PCBs, but also of other organic environmental pollutants, could be observed between 1991 and 1997 in Swedish beef and pork (Wicklund Glynn et al., 2000). However, better analytical methods and changes in consumption patterns may also have played a part.
An updated calculation of dioxin intake was made during 2005. It included new concentration data obtained in targeted investigations and within the framework of