Data Driven Visual Recognition
OMID AGHAZADEH
Doctoral Thesis
Stockholm, Sweden, 2014
TRITA-CSC-A 2014:10 ISSN-1653-5723
ISRN-KTH/CSC/A-14/10-SE ISBN 978-91-7595-197-3
Computer Vision and Active Perception laboratory School of Computer Science and Communication KTH Royal Institute of Technology SE-100 44 Stockholm, Sweden Copyright © June 2014 by Omid Aghazadeh except where otherwise stated. Tryck: Eprint AB 2014
iii
Abstract
This thesis is mostly about supervised visual recognition problems. Based on a general definition of categories, the contents are divided into two parts: one which models categories, and one which is not category based. We are interested in data driven solutions for both kinds of problems.
In the category-free part, we study novelty detection in temporal and spatial domains as a category-free recognition problem. Using data driven models, we demonstrate that based on a few reference exemplars, our methods are able to detect novelties in ego-motions of people, and changes in the static environments surrounding them.
In the category level part, we study object recognition. We consider both object category classification and localization, and propose scalable data driven approaches for both problems. A mixture of parametric classifiers, ini-tialized with a sophisticated clustering of the training data, is demonstrated to adapt to the data better than various baselines such as the same model ini-tialized with less subtly designed procedures. A non-parametric large margin classifier is introduced and demonstrated to have a multitude of advantages in comparison to its competitors: better training and testing time costs, the ability to make use of indefinite/invariant and deformable similarity measures, and adaptive complexity are the main features of the proposed model.
We also propose a rather realistic model of recognition problems, which quantifies the interplay between representations, classifiers, and recognition performances. Based on data-describing measures which are aggregates of pairwise similarities of the training data, our model characterizes and de-scribes the distributions of training exemplars. The measures are shown to capture many aspects of the difficulty of categorization problems and corre-late significantly to the observed recognition performances. Utilizing these measures, the model predicts the performance of particular classifiers on dis-tributions similar to the training data. These predictions, when compared to the test performance of the classifiers on the test sets, are reasonably accurate. We discuss various aspects of visual recognition problems: what is the interplay between representations and classification tasks, how can different models better adapt to the training data, etc. We describe and analyze the aforementioned methods that are designed to tackle different visual recogni-tion problems, but share one common characteristic: being data driven.
Keywords: Visual Recognition, Data Driven, Supervised Learning,
Mix-ture Models, Non-Parametric Models, Category Recognition, Novelty Detec-tion.
iv
Acknowledgments
First and foremost, I’d like to thank my parents and particularly my partner Sara, without the support of whom I would not have been able to start and finish my PhD studies.
I’d like to thank Jan-Olof Eklundh for introducing computer vision to me and getting me interested in the field by inspiring discussions around various related topics; Josephine Sullivan for introducing statistical learning and machine learning to me during my Master’s studies; and Stefan Carlsson for introducing projective geometry to me during the same time.
I’d like to thank Stefan for supporting my interest in various topics that I touched upon during my doctoral studies. I would not have had the same under-standing of what computer vision is, and what it should be about, without Stefan caring about the big-picture aspects of the research we have done together. I’d also like to thank Josephine for supporting me in the beginning of my PhD studies, and for caring about the details of the research we did together.
I’d also like to thank all my colleagues in CVAP. Patric Jensfelt played an important role in creating the Systems, Control and Robotics Master’s programme, during which I got to know and get interested in the great research environment in CVAP. Danica Kragic helped maintain the inspiring atmosphere in CVAP. As a result, I have had many constructive discussions with my close colleagues and friends there. Figure 1 demonstrates my recollection of such discussions. Thank you for this (sorted by the degree of colleagues’ nodes in the graph): Hossein, Stefan, Josephine, Heydar, Oscar, Miro, Vahid, Jan-Olof, Carl-Henrik, Sobhan, Babak, Magnus, Ali, Peter, Mårten, and Niklas. I have also enjoyed the company and support of various other colleagues including Christian, Hedvig, Florian, Friné, Alper, Marin, Oskar, Marianna, Andrzej, Xavi, Virgile, Alessandro, Jeanette, Renaud, Gert, Matthew, Martin, Cheng, Mikael, Püren, Atsuto, Lazaros, and many others. I’d also like to thank Sara, Axonn, Oscar, Jan-Olof, Hossein, and Hedvig for helping me proofread and/or improve this thesis.
I have compiled a list of authors I have cited the most in the 5 papers included in this work. According to that list, the work presented here has been mostly inspired by (in alphabetical order): Pedro Felzenszwalb, Jitendra Malik, Deva Ramanan, Andrea Vedaldi, and Andrew Zisserman.
Last but not least, I’d like to acknowledge funders who supported my PhD studies. Most of the works in this thesis were funded by Swedish Foundation for Strategic Research (SSF); within the project VINST (Wearable Visual Information Systems), and by the European Commission KIC: EIT ICT labs.
v Hossein Stefan Josephine Heydar Oscar Miro Vahid Jan−Olof Carl−Henrik Sobhan Babak Magnus Ali Peter Marten Niklas Computer Vision Machine Learning Statistical Learning Recognition
Object Recognition Low Level Vision Affinity Measures
Parallel Programming
Representations Projective Geometry
Active Perception Generative Models
Pose Estimation
Image Segmentation
Omid
Figure 1: Visualization (of a sparsified version) of the research aspect of my Aca-demic social network within CVAP. An edge in between a colleague’s node and a topic represents my recollection of more than one discussions related to the topic between me and the corresponding colleague. According to the figure, I have had most discussions around Computer Vision, Machine Learning, Statistical
Learn-ing, Recognition, and Object Recognition; mostly with Hossein, Stefan, Josephine,
vi
List of Papers
This thesis is based on the following papers:
[A] Omid Aghazadeh, Josephine Sullivan and Stefan Carlsson. Novelty Detection from an Ego-Centric Perspective. In IEEE Conference on
Computer Vision and Pattern Recognition, 2011.
[B] Omid Aghazadeh, Josephine Sullivan and Stefan Carlsson. Multi View Registration for Novelty/Background Separation. In IEEE Conference
on Computer Vision and Pattern Recognition, 2012.
[C] Omid Aghazadeh, Hossein Azizpour, Josephine Sullivan and Stefan Carlsson. Mixture Component Identification and Learning for Visual Recognition. In European Conference on Computer Vision, 2012. [D] Omid Aghazadeh and Stefan Carlsson. Properties of Training Data
Predict the Performance of Classifiers. In submission to: International
Journal of Computer Vision, 2014.
[E] Omid Aghazadeh and Stefan Carlsson. Large Scale, Large Margin Classification using Indefinite Similarity Measures. In submission to:
Neural Information Processing Systems, 2014.
In addition to the papers [A]-[E], the following papers have been pro-duced in part by the author of this thesis:
• Omid Aghazadeh and Stefan Carlsson. Properties of Datasets Predict the Performance of Classifiers. In British Machine Vision
Conference, 2013.
• Ali Sharif Razavian, Omid Aghazadeh, Josephine Sullivan and Ste-fan Carlsson, Estimating Attention in Exhibitions Using Wearable Cameras. In International Conference on Pattern Recognition, 2014.
Contents
Contents vii
I
Introduction
1
1 Introduction to Visual Recognition 3
1.1 Representation, Classification and Recognition . . . 4
1.2 Category Free and Category Level Recognition . . . 8
1.3 Parametric and Non-Parametric Classifiers . . . 9
1.4 Data Driven Recognition . . . 11
2 Category Free Recognition 13 2.1 Category Free Recognition in Computer vision . . . 13
2.2 Novelty Detection as a Recognition Problem . . . 13
2.3 Novelty Detection in Wearable Visual Systems . . . 14
3 Category Level Recognition 15 3.1 Category Level Recognition in Computer Vision . . . 15
3.2 A Brief Overview of Object Recognition Systems . . . 15
3.3 Data Driven Object Recognition . . . 16
3.4 Modelling Categorization Problems . . . 17
4 Summary of Papers 19 A Novelty Detection from an Ego-Centric Perspective . . . 19
B Multi View Registration for Novelty/Background Separation . . . 21
C Mixture Component Identification and Learning for Visual Recogni-tion . . . 23
D Properties of Datasets Predict the Performance of Classifiers . . . 25
E Large Scale, Large Margin Classification using Indefinite Similarity Measures . . . 28
5 Discussion and Conclusions 31
viii CONTENTS
Bibliography 33
II Included Publications
37
A Novelty Detection from an Ego-Centric Perspective A1
1 Introduction . . . A3 2 Sequence alignment . . . A5 3 Novelty Detection . . . A10 4 Evaluation of the similarity matching . . . A11 5 Results . . . A13 6 Conclusions and Future Work . . . A14 References . . . A16
B Multi View Registration for Novelty/Background Separation B1
1 Introduction . . . B3 2 Foreground/Background Segmentation . . . B5 3 Experiments . . . B12 4 Discussions and Conclusions . . . B17 References . . . B18 Supplementary Materials . . . B20 C Mixture Component Identification and Learning for Visual
Recog-nition C1
1 Introduction . . . C3 2 Visual Similarity Based Mixture Model Learning . . . C6 3 Experiments . . . C13 4 Conclusions . . . C18 References . . . C18 Supplementary Materials . . . C21 D Properties of Training Data Predict the Performance of
Classi-fiers D1
1 Introduction . . . D3 2 Quantifying the Quality of a Training Set . . . D7 3 Constrained Dataset Selection . . . D14 4 Experiments . . . D17 5 Discussion . . . D27 6 Conclusions . . . D30 References . . . D30 E Large Scale, Large Margin Classification using Indefinite
Similar-ity Measures E1
CONTENTS ix
2 Basis Expanding Support Vector Machine . . . E4 3 Experiments . . . E11 4 Conclusion . . . E17 References . . . E17 Supplementary Materials . . . E20
Part I
Chapter 1
Introduction to Visual Recognition
Constructing algorithms which can interpret and acquire understanding of the con-tents of images and videos, has been the holly grail of the computer vision field. Such algorithms, tackling visual recognition, have been identified as a core com-ponent of AI systems which are to interact with people. This interaction might come in different forms such as providing information regarding contents of images, searching large collection of images for instances of object categories, and learning individual preferences. Although humans perform recognition tasks rather triv-ially and almost without any conscious effort, thanks to a billion years of evolution of multi-cellular life forms, developing algorithms which match human vision has proven to be extremely complex.
Visual recognition is not only a complex and interesting academic problem. With the advances in computer hardware, and also in visual recognition algorithms, we have reached a point where industry is taking serious steps towards including visual recognition in their next generation AI systems. The reason that visual recognition has gained much attention from both academia and industry is the ever increasing amounts of data and the ever improving power to process them. What might make construction of robust visual recognition algorithms possible is the ever growing production of better digital cameras – available in various forms such as dSLRs, mobile, and wearable cameras – giving rise to huge collections of images and video footage, and the ability to have data driven models learn different concepts from such data collections. The consequence is that acquiring and processing extremely large bodies of images and video footage have become an extremely fruitful research direction, with the potential to transform the AI technology in the 21st century.
Pursuing the dream of many computer vision scientists and experts, this thesis is dedicated to visual recognition. That is, we seek computational approaches for recognition of visual patterns. We define what we exactly mean by visual
recogni-tion, and discuss how different representations and classifiers affect it in Section 1.1.
We discuss and define what we mean by categories in Section 1.2, and introduce
4 CHAPTER 1. INTRODUCTION TO VISUAL RECOGNITION
the two types of problems we consider in this work: category-free and category level recognition. For both the category-free and category level recognition problems, we consider data driven approaches. After discussing what parametric and non-parametric classifiers are in Section 1.3, we elaborate on what is meant by data
driven, and how it differs from non-parametric classification, in Section 1.4.
To summarize, what we investigate in this thesis is:
Learning, from training data, to classify visual patterns; given (a large amount of) prior knowledge.
The prior knowledge plays a significant role in visual recognition, and it covers very general aspects and assumptions about e.g. the natural world, the imaging process, and the distribution of exemplars sharing particular characteristics under specific representations.
This chapter introduces the background for the problems studied in this work. Category-free recognition is more thoroughly discussed in Chapter 2. Chapter 3 covers category level recognition. Summaries of the included papers are given in Chapter 4. Chapter 5 concludes the thesis.
1.1
Representation, Classification and Recognition
Throughout this thesis, we adopt a definition of recognition which differs from what is defined as recognition in cognitive sciences, biological vision, and also in the mainstream computer vision. In computer vision, recognition usually refers to the study of problems such as object recognition, action recognition, and scene recognition; and problems such as learning to detect boundaries of objects in natural images is not considered to be doing recognition. Such categorization of problems is suitable for fields such as biological (human) vision, where different cells and neural circuits that affect human vision and perception play different roles in transforming the signals captured in retina to a semantic understanding of the natural world. In computer vision, such distinct circuitries for extracting signals from still images or videos do not exist. Furthermore, there is no reason for computer vision to try to adopt a systems approach similar to how signals are transformed in human brain, as 1) computational algorithms are not constrained (or even guided) by evolution, and 2) we still do not have a clear understanding of human vision in a way that allows construction of algorithms that mimic it in a computationally feasible and efficient manner.
As a result of this difference between computational and biological systems, we argue that unless the goal is to exactly mimic the human vision, there is no reason to try to define computer vision tasks in the same way that they are carried out in the human brain i.e. based on the same inputs, outputs, and in the same way the input is transformed to the output. A high level computational task might be implemented in various ways, and one might pick solutions which have lower com-putational complexities, higher accuracies, or have other specific desired properties
1.1. REPRESENTATION, CLASSIFICATION AND RECOGNITION 5
1. As a result of this freedom in implementation of high level visual tasks, the question is then the following: what can be considered a high level visual task? We consider any visual task which is derived by (computational) learning a high level visual task. This is in contrast with the current mainstream definition based on biological counterparts of the tasks being (significantly) constrained by evolution. In other words, we adopt a computationally motivated definition for recognition, as opposed to a biologically inspired one.
The Oxford English dictionary defines recognition as:
“Identification of a thing or person from previous encounters or knowledge.”
In computer vision, we are mostly interested in visual patterns as the ‘thing’ to recognize. In [10], pattern recognition is described as:
“The field of pattern recognition is concerned with the automatic discovery of regularities in data through the use of computer algorithms and with the use of
these regularities to take actions such as classifying the data into different categories.”
Pattern recognition includes problems such as regression, classification, and struc-ture prediction. In this thesis, the focus is on the learning aspect of classification of visual patterns.
Is visual recognition the same as pattern recognition techniques applied to visual patterns? Our short answer is no; with the following motivation. Unlike in tradi-tional pattern recognition and machine learning, where the representation of data is usually fixed and given, the RGB pixel values of images do not constitute a good representation suitable for pattern classification. For example, images acquired by pinhole cameras, represent a projection of the natural world. This projection can perturb properties that exist in the natural world e.g. perpendicular lines are not necessarily perpendicular when projected, or give rise to new ones in images e.g. oc-clusions. However, many properties are preserved such as continuity and linearity. What makes visual recognition particularly hard, is the lack of a good represen-tation of visual patterns which highlights the important information and discards what is irrelevant. The consequence is that the models that are used to classify visual patterns cannot rely on these properties to be reflected in the representation. As a result, the models and/or the representations need to be adapted particularly for visual recognition. 2
1This has been pointed out by Marr [29] in the context of his computational theories. 2It is crucial to note that for any representation, a measure of (dis) similarity needs to be
spec-ified. For example, the χ2distance is a better dissimilarity measure for histogram representations,
in comparison to the Euclidean distance. Similarly, a Gaussian RBF kernel is more appropriate than a linear kernel, as a measure of similarity for representations which result in linearly non-separable data distributions. Therefore, when we refer to representations, we assume that they are accompanied by suitable (dis) similarity measures. In this regard, the choices regarding suit-ability of (dis) similarity measures are as equally important as the algorithms for deriving and extracting the representations from images, videos, etc. For the sake of brevity, in this thesis we
6 CHAPTER 1. INTRODUCTION TO VISUAL RECOGNITION
Although there have been works on how to derive suitable representations, there has not been any consensus even on what constitutes an ideal representation. There are many ways to acquire representations from images, each highlighting specific aspects and suppressing other sources of variance in images; see Marr’s argument on the implementation of computational theories [29]. The most common approaches, arguably inspired by Marr’s representational scheme [29], follow this pipeline: con-struct some local features based on some properties of images, and acquire a global representation based on some sort of aggregation of these local features. The list below gives some examples of such an approach:
• HOG [13] where HOG cells are particularly aggregated and normalized local image gradients, and the global representation is acquired by globally con-catenating the HOG cells on a 2D spatial grid. This representation mostly captures shape, and is invariant mostly to illumination changes and very small local deformations.
• Bag of Words [39] where local regions are somehow identified e.g. dense sam-pling on a grid, or interest regions [30], and somehow described e.g. via SIFT [28], or learned descriptors [37]; and a representation is acquired by somehow aggregating these local descriptors e.g. in a spatially ignorant manner [39], or on hierarchies of 2D spatial grids [25]. Depending on the choice of descrip-tors, this approach can result in a representation invariant to local and global transformations of the input image. For example a plain bag of densely sam-pled SIFT descriptors will be invariant to global translations and rotations, a plain bag of affine covariant interest regions described with SIFT is invariant to global affine transformations, and the same approaches aggregated on 2D spatial grids are only invariant to local deformations.
• Hyper features [1] which are similar to the bag of words approach, but the feature extraction, coding and representation is repeated multiple times in a spatially aware manner.
• Attribute based mid-level representations [17] which describe images, or re-gions of interest, by pooling responses of some (semantically meaningful) clas-sifiers.
For a rather long period of time, image representation usually referred to an approach similar to one of the aforementioned ones, potentially based on different local features, regions, coding techniques, pooling techniques, etc. The represen-tation was defined, derived, and fixed, prior to learning a classifier. However, the rather recent deep learning approach defines representation in an alternative way.
The deep convolutional representation learning, mostly based on Yann Lecun’s convolutional networks [45], gained significant attention from the computer vision
use ‘representation’ to refer to both i.e. we also consider approaches such as metric learning to be (implicitly or explicitly) related to representations.
1.1. REPRESENTATION, CLASSIFICATION AND RECOGNITION 7
community with the success of [23] in ImageNet [14]. In [23], consecutive convolu-tions with locally (shared) convolutional kernels, followed by particular normaliza-tions and max-poolings constitute local features, and concatenation of convolution responses constitutes the (intermediate) representation. This step is repeated mul-tiple times, and the invariance to local deformations is aggregated towards larger and more global invariance to deformations/transformations with the addition of consecutive convolutional layers. The convolutional response of the last convolu-tional layer, or the response of the next (fully connected) layer, is said to constitute a representation suitable for recognition.
The convolutional deep learning approach is similar to Marr’s representational approach in that there is a sequence of increasingly complex representations that achieve the desired generalization and invariance. However, unlike Marr’s approach and other traditional representational schemes, only a description of what will stitute a representation is specified in the method, and the parameters of the con-volutional kernels are learnt jointly with the classifier coupled with a categorization task3. This is in contrast to the other representational approaches that are usually decoupled from particular tasks they might be needed for.
The question is, if we need to consider representation and classification two different components required for recognition, or if they are inter-connected and non-separable? In other words, is the representational part of the deep learning approach the RGB pixel values, and in that case the convolutional layers will be a part of the classifier, or is the representation the convolutional part of the net-work, and thereby the fully connected multi layer network at the end of the deep learning architecture constitutes the classifier? Similarly, are the particular choices for traditional representations (HOG, BoW, etc.) classifier choices, and if they are, the representation will be the RGB pixel values, or are the representations separate from the choice of classifiers? Answering these questions is outside the scope of this thesis. However, we provide a framework in Section D which can be used to select representational schemes which are more suitable for particular datasets and recognition tasks.
While there exist works which suggest that the representation acquired from deep learning might be suitable for various kinds of recognition tasks [36, 32], the deep learning framework was not as popular and accessible when these studies were performed. Therefore, in this thesis we do not investigate the deep learning repre-sentation. Instead, in the category-free part, various representations are considered and evaluated for different recognition tasks. Similarly, in the category level part, the representation is fixed to a slightly modified version of HOG described in [18].
3There are works which use regressors in the last layer [41]. There is no limit on what can
be connected to the network, as long as its (sub) gradients can be computed and used in the back-propagation.
8 CHAPTER 1. INTRODUCTION TO VISUAL RECOGNITION
1.2
Category Free and Category Level Recognition
The definition of categories is a complicated and a rather sensitive topic, specially because in cognitive sciences, what comprises a category is directly translated to our understanding of the reasoning capabilities of humans, and our understand-ings of the world surrounding us [24]. While there are more complex definitions of categories in various fields such as cognitive science and psychology, we are only in-terested in a simplified definition of categories which can be used in a computational framework. Consequently, we take on a rather traditional definition of categories; one which Lakoff relates to ‘the objectivist view’ [24].
Empirical results of our methods (discussed later in Chapter 3 and in Section C and Section D) qualitatively suggest that exemplars of what we consider as cate-gories are not equal, that is, we implicitly make use of graded category memberships [24]. The inequality of exemplar-category memberships might have various reasons such as 1) the biases (photographer and selection bias [40]) involved in the sam-pling process of exemplars, or 2) the difference in the centrality of the exemplars to the category. Although our empirical results suggest that exemplars do not exhibit equal category memberships, and classifiers might be better off ignoring some ex-emplars or model those which are more ‘central’, we do not claim to have followed or avoided prototype theory [24]. Specifying the reason for this inequality, and simi-larly, stating an exact definition of categories irrespective of computational aspects, are outside the scope of this thesis. Instead, we consider a simplified definition of categories, specifically the one the Oxford dictionary provides.
The Oxford English dictionary defines category as:
“A class or division of people or things regarded as having particular shared characteristics.”
where it defines characteristic as:
“A distinguishing feature or quality.”
Depending on how one defines ‘shared characteristics’, categories in computer vision can be defined in various ways. For example, sharing characteristics might be defined as
• being visually similar to a mountain • can be used to sit on
• being harmful to the Ozone layer • having 6 legs
According to this definition of categories, the resulting classifications will be se-mantically meaningful.
1.3. PARAMETRIC AND NON-PARAMETRIC CLASSIFIERS 9
In this regard, what we mean by category-free recognition is a classification problem in which none of the classes form any specific categories; interpreted with regards to the given definition of categories. Particularly, what we consider in the category-free recognition is novelty detection i.e. classification to ‘common’ and ‘uncommon’. None of the ‘common’ or ‘uncommon’ classes match the given definition of a category: being ‘common’ or ‘uncommon’ in a given dataset has nothing to do with any particular characteristic that ‘common’ or ‘uncommon’ exemplars share.
In the category level recognition, we model categories e.g. ‘cars’, ‘people’, and ‘plants’. We do not assume any particular characteristic to be shared between all exemplars of the same category. However, we assume that groups of exemplars from the same category exhibit some sort of similarity in some visual characteristic
e.g. shape, texture, or color. Obviously, the kind of visual characteristics a category
supposedly has puts some constraints on the type of information/features that are to be extracted from images. For example, a color-invariant feature/representation is inappropriate for modelling a category whose most distinctive characteristic is a color. By fixing the representation to HOG, we essentially model the shapes of (prototypes of) categories.
1.3
Parametric and Non-Parametric Classifiers
Consider a binary classification problem. If we know the distributions the exemplars of each class are sampled from, we can directly use a model of these distributions to derive a decision criterion which optimizes the expected value of a given loss function. When these known distributions have specific forms that can be specified by some parameters independent of the actual data e.g. Gaussian, Laplacian, and Poisson, the distribution is referred to as a parametric distribution.
On the contrary, if such a family of distributions does not exist, one can utilize mixtures of parametric distributions e.g. mixture of Gaussians, or non-parametric distributions e.g. Parzen window (kernel density estimation), to approximate the unknown distributions4. Both mixtures of parametric and non-parametric distri-butions can approximate arbitrary distridistri-butions with any desired accuracy5. The main difference is in the way each is constructed: the complexity of mixture of parametric models is controlled by parameters: the number of mixture components and the family of mixtures, and the complexity of non-parametric models is regu-lated mostly by the actual data. In other words, non-parametric distributions have less assumptions about the structure of the data, and consequently, they store and re-use the training data to represent the actual distributions; while in the mixture
4We do not consider mixtures of parametric distributions, a third category in addition to
parametric and non-parametric distributions. While they are parametric by nature, we will argue that the distinction between non-parametric distributions and mixtures of parametric distributions fades away when considering complex enough mixtures of parametric distributions.
5More accurate approximations, in general, demand more samples from the distributions that
10 CHAPTER 1. INTRODUCTION TO VISUAL RECOGNITION
of parametric case, parameters of the mixture models are learnt from the training data, which is discarded afterwards. Therefore, mixtures of parametric models are usually more expensive to ‘train’, but cheaper to ‘test’.
Similarly, if the decision function – for the classification task – can be rep-resented with reasonable accuracy by parametric functions e.g. polynomials and exponentials, the parametric functions can be used to define the decision rule, and the resulting classifier is called parametric. Alternatives are mixtures of paramet-ric classifiers e.g. piecewise quadratic, and non-parametparamet-ric classifiers e.g. nearest neighbor classifier and kernelized SVM equipped with RBF kernels. Similar to parametric and non-parametric distributions, non-parametric classifiers store and re-use copies of the actual data points, and they are usually more expensive than parametric and mixture of parametric classifiers to ‘test’ and cheaper to ‘train’.
There is a crucial interplay between complexity of representations and complex-ity of classifiers. Given a classification task with arbitrary complex class distribu-tions, the more complex the representation is, the less complexity is required from the classifier. For example, one can map linearly non-separable data to a higher dimensional space where the data is more likely to be linearly separable. This can be seen as increasing the complexity of the representation, which is traded off by using a simpler classifier in the higher dimensional space. The kernelized SVMs equipped with RBF kernels, though non-parametric and extremely non-linear, are linear classifiers in an infinite dimensional space. The complexity of the classifier not only is reduced by its linearity, but also by the max-margin constraint of the SVMs, which regulates extra degrees of freedom that are not required to separate the data [35]. Similarly, kernel embedding approaches follow similar reasonings; see
e.g. [43].
Another example is the representation acquired from the deep learning frame-work [23]. The system takes as input RBG pixel values, and outputs a 1000 way classification based on approximately 60 million parameters distributed in multiple layers. The trade-off can be easily seen in this case: depending on what layer one defines the representational part to finish, the classification part is started from the next layer forward. In other words, if the representational part is seen as RGB pixel values, the coupled classifier is extremely complex and consists of multiple layers of convolutions, followed by a few fully connected layers, followed by softmax functions. On the contrary, if the representational part is seen as all the convolu-tional layers followed by two fully connected layers, the coupled classifier is only the softmax at the end of the network.
What makes non-parametric classifiers particularly interesting is that they can adapt their complexity based on the size of the training data: the more training data is provided to them, the more complex decision boundaries they can learn. Despite this great property, their test time complexities make them rather inapplicable to large scale scenarios. Various attempts have been made to reduce the test time complexity of non-parametric classifiers, which mainly involve approximations [11], or directly controlling the complexity of the classifier [26, 44]. We discuss the latter more in Section E.
1.4. DATA DRIVEN RECOGNITION 11
1.4
Data Driven Recognition
The term data driven has been used to emphasize on data-adaptability of non-parametric classifiers, when compared to basic non-parametric classifiers which cannot adapt to arbitrary distributions. As argued in the previous section, mixtures of parametric classifiers have been shown to be able to adapt to arbitrarily complex data distributions, provided that the model’s complexity is not over-regulated i.e. a large number of mixture components is allowed. Also, classifiers exist which are not non-parametric, and therefore parametric, and can adapt to arbitrary data distributions e.g. random forests, artificial neural networks, etc. Therefore, a more modern definition of what constitutes data driven learning would involve classifiers / regressors complex enough to perform the required recognition tasks with any desired level of accuracy, given enough training data.
We have already motivated that the classifier / regressor is tightly coupled with the representation it builds upon. Additionally, we have argued in [3, 5] that the right kind of data for data driven methods will most likely have to satisfy some qualitative constraints. We discuss in Section D that for any complex enough model, there is a very crucial factor which is usually neglected: the distribution of the training data provided to the model. We argue that by considering the data as a design parameter, a new kind of recognition is brought to life, which actually concerns with ‘tuning the training data’. In other words, we will argue that classifiers might learn better from a subset of training data, and they could potentially select, from a large pool of candidate training data, exemplars which will help the classifier generalize better.
Although we motivate and partially demonstrate this in Section D, we think that more solid theoretical or experimental results are needed to verify the extent of validity of this hypothesis. Therefore, our definition of data driven in this thesis will be one which acknowledges the importance of ‘right kind of data’ but does not specify how such data might be acquired:
Data Driven Learning: A process involving the design and training of
classifiers/regressors and representations, which can perform required recognition tasks with any desired performance, given a sufficiently large number of suitable
training data.
It is worth emphasizing that a desired recognition performance dictates require-ments from training data in addition to requirerequire-ments from the model. For example very high categorization performances require
• non-gradual category memberships e.g. high resolution images of cars vs plants
• either
– very strong priors about the natural world e.g. rich enough representa-tions which lead to separable data and a very small Bayes risk
12 CHAPTER 1. INTRODUCTION TO VISUAL RECOGNITION
– a complex enough machinery for learning the representations and classi-fiers + sufficiently many training exemplars from which a representation and a classifier can be learnt that can match the required categorization performance
In other words,
• Problems such as ‘young’ vs ‘old’ will not achieve very high recognition per-formance as the ‘young’ and ‘old’ categories are not mutually exclusive. • In absence of rich representations that provide rather certain information
about occlusions, lighting conditions, pose, etc.
– A linear classifier using HOG representation cannot accurately classify cars from arbitrary view points, no matter how much data is used. – A view point dependent representation requires many samples from
var-ious view points and a complex classifier that can adapt to the (poten-tially) multi modal distribution of positives and negatives, with some mechanism for occlusion reasoning
– An algorithm which learns a view point independent representation and learns a complex classifier that can correctly classify occluded exemplars under the learnt representation, will require many examples of objects in different view points – potentially augmented with correspondences in multiple views – exhibiting various occlusion patterns
Chapter 2
Category Free Recognition
This chapter introduces the category-free recognition problems we consider in this thesis. Section 2.1 overviews category-free recognition problems frequently encoun-tered in computer vision. Section 2.2 discusses novelty detection as a recognition problem. The category-free part of this work mostly involves novelty detection in wearable visual systems, which we introduce and motivate in Section 2.3.
2.1
Category Free Recognition in Computer vision
Many problems in computer vision are category free. For example, object boundary detectors such as [9, 27], involve category-free recognition of pixels in images which correspond to the contours of the objects in the natural images. Having correspond-ing pixels in images end up on salient contours of the object is not a characteristic that parts of objects in real world share. Similarly, non-semantic segmentation methods such as [7, 6], are category-free, and so are general object tracking sys-tems e.g. [21]. Interpreted according to the definition of recognition discussed in the previous chapter, in all these problems some visual pattern from a training set is being re-identified: visual patterns corresponding to pixels on prominent bound-aries of objects, visual patterns that correspond to one prominent object within images, and the visual pattern corresponding to the object that is to be tracked.
2.2
Novelty Detection as a Recognition Problem
As motivated earlier, novelty detection is a form of category-free recognition. Nov-elty detection and outlier detection are sometimes considered the same. We make a subtle distinction between the two. Outlier detection is mostly about identifying data points which do not seem to be similar to the majority of data points. The main reasons for a point to become an outlier might be sensory or manual labelling errors, or not agreeing with a model which explains a significant majority of the data points. Novelty detection on the contrary aims to identify patterns which are
14 CHAPTER 2. CATEGORY FREE RECOGNITION
believed to be of interest, and the reason for identification of those patterns is not believed to be a sensory error, or mis-labelling of the data. In other words, the aim of the outlier detection is to have a model which clearly explains the data, while the aim of novelty detection is identification of rare patterns.
In order to detect novelties, one needs to identify the novel pattern to belong to a certain group or category, and then identify it as being novel in that group or category. In essence, non-novel patterns need to be recognized in order for the novel patterns to be classified as novel. This can be identified in the works that we present in Section A and Section B, where the novel temporal segments are found within sequences of images which partially share structure with non-novel sequences, and novel spatial segments are found within images which partially share structure with non-novel images.
2.3
Novelty Detection in Wearable Visual Systems
Digital cameras are becoming smaller, processors are becoming more powerful and energy efficient, communications are becoming faster, storage units are becoming smaller and support more capacity; and all of them are becoming cheaper. The result is that light devices equipped with small cameras, good processors, plenty of storage capacity, and fast communications are becoming cheap to produce. Many similar devices have existed for quite a few years now: Microsoft SenseCam, Muvi Atom, and GoPro; some have been recently produced: Google glass; and more will be developed and mass marketed soon.
Most of these devices are designed to be continuously worn and/or record lengthy video footage. Each hour of video footage, recorded at 30 HZ, comprises more than 100,000 images. When sub-sampled at 1 HZ, 8 hours of daily recording results in over a million images each year. Storing, processing, or just viewing these images, as might be required by applications such as life logging or memory therapy, will be associated with huge costs in terms of storage, computation, or attention time. An automatic selection process will be crucial to help manage such a large body of images.
Novelty detection can be used to filter out what is most common in such large datasets, leaving only those which are in some sense rare. We propose two different novelty detection frameworks based on wearable footage. The first one, presented in Section A, explores novel ego-motion detection in sequences of images of a subject walking from a metro station to work on a daily basis. We show that the novelties the system detects reflect events such as ‘running into a friend’, ‘meeting a friend’, ‘giving directions’, and ‘buying ice-cream’. The second one, presented in Section B, seeks novel spatial patterns in images of roughly the same physical place e.g. in front of the metro station. We show that what is mostly novel in images of the same outdoors urban areas are ‘people’, ‘bicycles’, ‘cars’, etc., which are not parts of a static environment. We believe these results to reflect a useful ‘filtering process’, which allows the rest of the sequences to be summarized as ‘the usual’.
Chapter 3
Category Level Recognition
This chapter introduces the problems related to category level recognition that we study in this work. Section 3.1 overviews the category level recognition problems frequently encountered in computer vision. Section 3.2 overviews the most promi-nent object recognition systems. Section 3.3 discusses data driven object recogni-tion, and what our works contribute to it. In Section 3.4 we discuss modelling the interplay between representations, classifiers, and the data.
3.1
Category Level Recognition in Computer Vision
Many problems in computer vision are category based. For example, scene recogni-tion [31] aims to classify images of scenes to categories such as ‘indoors’, ‘cinema’, and ‘park’. In object recognition, the aim is to either determine if an object from categories such as ‘chair’, ‘person’, and ‘car’ exists within an image [16, 15], or to localize such instances within images [16, 18]. Semantic segmentation [20] is about partitioning pixels of images according to the categories they belong to. Similarly, in pose estimation [46, 22, 8] and action recognition [12], the ‘human’ category is the focus of the model, and in face recognition [38] categories such as ‘person 1’, ‘person 2’, etc. are considered.
3.2
A Brief Overview of Object Recognition Systems
The category level part of this thesis investigates the object recognition problem. In cognitive neuroscience, object recognition is defined as the ability to perceive objects’ (visual) properties such as shape, texture, and color, and assign semantic attributes to them. In this work, we are not concerned with the semantics associated with objects, other than the categories they belong to. Additionally, since we use the HOG representation, we mostly model shape rather than color or texture.
Object recognition in computer vision is usually divided into three distinct prob-lems: 1) instance level recognition, where the goal is to identify the same object
16 CHAPTER 3. CATEGORY LEVEL RECOGNITION
in novel images, 2) object category classification, where the goal is to determine if instances of different categories exist within an image, and 3) object category localization which aims to localize instances of categories within images. The com-plexities of these problems are usually considered to be in the same order.
Instance level recognition can be performed via local feature matching [28], potentially followed by a geometric verification step e.g. [39], or by other means of modelling the appearance e.g. [21]. The classification problem usually involves holistic reasoning based on (explicit or implicit) global representations [23, 15], and therefore the training and testing samples usually do not exhibit significant scale variation within images. The detection problem is usually considered the most complex, as detectors are expected to handle significant position and scale variations of objects within images. The inference process usually needs to classify all the bounding boxes with varying aspect ratios and scales over an image. The consequences are: 1) the training procedure becomes much more expensive than holistic approaches, as all bounding boxes that do not overlap significantly with the provided ground truth bounding boxes define ‘negative’ samples, and 2) the inference procedure for each image becomes very expensive which renders expensive classifiers rather impractical. There are approaches that do not implement scanning window classifiers, but rather use more sophisticated approaches for pruning the search space, or speeding up the computations e.g. [42, 33, 19]. Nevertheless, the detection problem is considered to be more complex than the classification problem (when dataset sizes are comparable).
In this thesis, we consider both classification and detection problems. In Sec-tion C we present our object detecSec-tion model. Section E describes our object classification system.
3.3
Data Driven Object Recognition
Object Detection: As motivated earlier, we consider mixtures of parametric clas-sifiers as data driven methods, provided that they have a sufficiently large number of mixture components.1 This suggests that such models need to adapt their com-plexity to the training data distributions. Cross-validation can be used to tune the number of mixture components; provided that these models can learn mixtures with different number of components equally well.
As the optimizations involved in training mixture models are non-convex in the absence of fixed data-mixture component associations (latent associations), these models are sensitive to initializations. We consider a data driven cluster-ing step, based on sophisticated visual similarity measures, to provide the initial data-mixture component associations within the mixture learning framework. The
1The deformability of part based models such as [18] can be potentially considered equivalent
to compressing many rigid templates in one deformable component [47]. However, deformable models such as [18] usually limit the deformability of parts and strongly penalize highly deformed part configurations. In this sense, even deformable part based models require many global mixture components in order to be able to handle high intra-class variation.
3.4. MODELLING CATEGORIZATION PROBLEMS 17
approach is shown to adapt the mixture models to the distributions of data better than the simple and common alternative of clustering the data based on the aspect ratio of bounding boxes. This is discussed further in Section C.
Object Classification: One of the most popular non-parametric classifiers is the kernelized SVM equipped with RBF kernels. The RBF kernel performs particularly well when the Euclidean distance on the input representation is a reasonable mea-sure of dissimilarity. The main problem with such a configuration is the expensive training and testing procedures associated with it, in addition to the inappropriate-ness of the Euclidean distance, or other metrics [34], for most of the representations of visual patterns. In Section E, we introduce a non-parametric classifier which has better training and testing costs (computational and memory), while it does not assume metrics, or more accurately positive (semi-definite) similarity measures. What is particularly interesting about this model is that it can be equipped with deformable/invariant similarity measures which are indefinite.
3.4
Modelling Categorization Problems
Due to the interplay between representations, classifiers, and the training data, and due to a lack of understanding about what constitutes a good representation and classifier configuration for particular data distributions, cross-validation has been the dominant approach to select representations and classifiers which perform well on particular training sets. The lack of objective measures for describing and characterizing distributions of data has contributed to the practice of trying vari-ous combinations of representations and classifiers, and selecting the configuration which performs well on held out data.
The cross-validation procedure does not provide much insight on how to select new configurations for unseen distributions of data, nor does it provide any objec-tive measure of what kind of performance one can expect with certain representa-tion - classifier combinarepresenta-tion without going through the expensive training-testing procedure for various combinations [47, 40].
In Section D, we introduce our solution to this problem: we aim to model various factors that affect a recognition system, which in addition to the data-describing measures that we introduce, is able to characterize distributions of data. For example, it can quantify semantic characteristics of training data e.g. intra-class variation, connectivity, etc., and predict the test performance of specific represen-tation/classifier choices with reasonable accuracy.
Chapter 4
Summary of Papers
A
Novelty Detection from an Ego-Centric Perspective
This paper presents a solution for temporal segmentation of novelties in ego motion of a person walking from a metro station to work [6]. The novelty detection pre-sented in the paper is performed in a non-parametric category-free manner. The sequence of images acquired by sub-sampling a new query video are registered to the stored reference sequences and the temporal segments which cannot be regis-tered are identified as novelties. This is demonstrated in Figure 1, and an example is depicted in Figure 2.
The registration is performed by aligning sequences according to a pairwise similarity of ego motion defined on the frame level. As a sequence of similar view points reflects similar ego-motions in the same environment, the similarity between view-points is utilized in a dynamic time warping algorithm to register sequences.
Ego Motion Environment
Novelty
Query sequence Reference sequences
Figure 1: Novelty detection via sequence alignment. Each block represents an image, and each row represents frames sub-sampled from a video. Links represent correspondences between frames.
20 CHAPTER 4. SUMMARY OF PAPERS Al ig n me n t w it h re fe re n ce se q u e n ce Query Sequence
Novelty
Figure 2: Reference sequences are aligned with the query sequence and novelty is detected
Similarity between view-points is approximated by the number of matching local descriptors between pairs of frames. As local appearance based descriptors are ambiguous by nature, Epipolar geometry is utilized to ensure that only the local features that correspond roughly to the same point in the 3D world are matched together.
Experimental parts of the paper suggest that such an approach can identify deviations from an implicitly learned model of ‘normal’ ego motions in the same environment. Storing approximately 5 reference sequences was shown to be suffi-cient in order to recognize environment-specific ‘normal’ ego motions, which in turn results in detection of novelties.
B. MULTI VIEW REGISTRATION FOR NOVELTY/BACKGROUND
SEPARATION 21
B
Multi View Registration for Novelty/Background
Separation
This paper presents a solution for spatial segmentation of novelties in multiple im-ages of the same enviornment [7]. Similar to the previous paper, the environmental setup is that of a person walking from a metro station to work, and recognition is performed in a non-parametric and category-free manner. Given a query image and multiple reference images of the same enviornment, reference images are spa-tially registered to the query image, and novelty is defined as the regions in the query image which cannot be explained by the registered reference images. This is depicted in Figure 3.
What's new?
I've been
here
before
!
Query Image
Output
Reference Images
Figure 3: Our system takes as input a query image and multiple reference images. We assume all these images are of the same environment taken from approximately the same view point but at different times. The algorithm segments out objects in the query image which are not part of the environment. The bottom right figure shows the computed segmentation.
22 CHAPTER 4. SUMMARY OF PAPERS
Figure 4: From top left to bottom right: initial probability of novelty, final proba-bility of novelty, final segmentation, and the ground truth labelling of novelties in an example.
The reference images are registered and warped towards the query frame sep-arately. The appearance-based residuals of warping errors from reference images are then aggregated in a fixed-length vector, which in turn approximates an initial probability of novelty via a regression function. The parameters of this regressing function are learnt in a supervised way, and the resulting estimate is used in multi-ple iterated graph cuts segmentation procedures with different parameter settings representing different priors. The solutions from each of the segmentation proce-dures are then aggregated into a final probability of novelty. The parameters of this regressing function are also learnt in a supervised manner, and a final non-iterated graph cuts segmentation produces the output of the algorithm. The regressed prob-abilities of novelties, the final output and the defined ground truth for an example query image are depicted in Figure 4.
Experimental results of the paper suggest that the proposed method detects spatial novelties in the query image such as ‘cars’, ‘bicycles’, ‘people’, etc. It is shown that the method can produce reasonable outputs, given roughly 5 reference images for a query image.
C. MIXTURE COMPONENT IDENTIFICATION AND LEARNING FOR
VISUAL RECOGNITION 23
C
Mixture Component Identification and Learning for
Visual Recognition
This paper proposes a framework for learning mixtures of rigid templates targeting category level recognition, where the data-component associations are initialized through a sophisticated clustering of category-specific exemplars [2]. Each category is partitioned into a fixed number of clusters, based on pairwise affinity of exemplars within the category. Mixtures of linear classifiers are then learnt based on these clusters in a binary (one vs rest) manner. This is demonstrated in Figure 5.
The pairwise similarity measure used in the clustering step performs feature selection on the exemplar level via discriminative reasoning. This was shown to perform better than coarser measures of similarity such as similarity in aspect ratio of the bounding boxes, or appearance based measures that do not perform feature selection. The similarity measures considered in the paper were rigid i.e. they did not model deformability of the exemplars. Consequently, the resulting mixture components considered are rigid and not deformable.
The clustering algorithm considered does not assume any shape or property for the clusters, but it requires the number of clusters to be determined apriory. Although there are ways to determine the number of clusters based on distributions
Figure 5: The high level overview of our approach. We group visually similar posi-tive instances together and for each cluster, learn a linear classifier which separates the cluster from all negative data. Each color represents a different cluster.
24 CHAPTER 4. SUMMARY OF PAPERS
of the data, they are not studied in this paper. As a part of the clustering step, an embedding of the data is acquired which is qualitatively shown to match our perceptual evaluation of similarity, given that images have sufficient resolutions, and that the considered category does not exhibit “too much intra-class variation”1.
The training of the mixture model involves a non-convex optimization problem, which in turn makes the model sensitive to initial data-component associations provided to the optimization process. It is shown that the clustering equipped with the feature-selecting similarity measure constitutes the best initialization among the ones that were considered. The resulting model was shown to outperform all other non-deformable models that are based on the same feature that was used in our study. Figure 6 visualizes the clusters and the filters learnt for each cluster for the ‘car’ category.
Figure 6: Visualization of the clusters and the filters learnt for each cluster.
1This observation motivated the study in the next paper, where we investigated what
D. PROPERTIES OF DATASETS PREDICT THE PERFORMANCE OF
CLASSIFIERS 25
D
Properties of Datasets Predict the Performance of
Classifiers
Inspired by the observations regarding the intra-class variation and the test perfor-mance in the previous paper, this paper aims to quantify the dependencies between test performance, properties of the datasets, and other factors that affect the test performance [5]. The paper demonstrates that these dependencies can be modelled in a way that under some reasonable assumptions, the resulting model can predict the test performance that particular classifiers will achieve when trained on rather arbitrary training sets. The model that has been used in the paper is demonstrated in Figure 7.
A rather critical assumption in the model is that training sets and test sets are sampled from the same distribution. The distributions of training exemplars, and similarly the testing exemplars, are quantified via aggregations of affinity measures on the training set. A regressing function is then defined which maps these ag-gregated measures to the test performance. As a training step of this model, the parameters of this regressing function are learnt in a supervised manner i.e. the aggregating measures are computed on different training sets, models are trained on the training sets and tested on the corresponding test sets, and the test perfor-mances are provided to the learning algorithm as ground truth regression targets. The test performances predicted by this model are shown to rather accurately agree with the novel test performances. While the model does not consider all the factors involved in the recognition process, we show that it can reasonably predict the majority of the variation in the observed test performances. In particular, the ‘connectivity’ of the training exemplars is shown to play the most significant role in determining the test performance. The correlation of the ‘connectivity’ measure to the test performances is shown to be stronger than that of the ‘intra-class variation’ or other measures. This suggests that the existing models have specific requirements
Feature Training Set
Testing Set Test Performance Train Classifier Pairwise Affinity
Performance Prediction Proposed Measures
Classifier Family
Figure 7: The training-testing process (red boxes) and the proposed test perfor-mance prediction process (green boxes). The direction of arrows determines the flow of information and also the dependencies. Both procedures are dependent on the white boxes.
26 CHAPTER 4. SUMMARY OF PAPERS
Feature Training Set
Testing Set Test Performance Train Classifier Sample Selection
Performance Prediction Proposed Measures
Classifier Family
Figure 8: Illustration of the proposed procedure for sample selection.
about the training data. In other words, the existing models will perform better if they are provided with the right kind of training data.
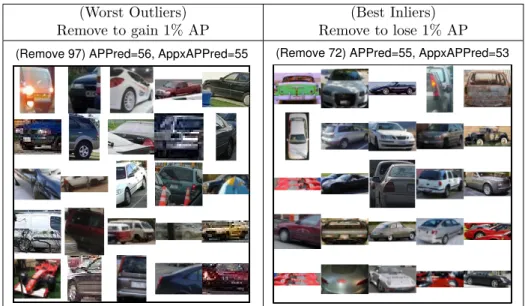
Being able to quantify the quality of a training set, the next step explored in the paper is to modify the training set in a way which best suits particular classifiers, see Figure 8. Due to the assumptions associated with the model used in the paper, the modifications to the training sets are required to be small i.e. radical changes to the training set violate the assumptions of the model, making the resulting predictions invalid. However, the small changes to the training set that are acquired from the current model agree substantially with our expectations in that, what is being suggested to remove from the training set are outliers that are not connected to the
(Worst Outliers) (Best Inliers)
Remove to gain 1% AP Remove to lose 1% AP (Remove 97) APPred=56, AppxAPPred=55 (Remove 72) APPred=55, AppxAPPred=53
Figure 9: Demonstration of Automatic Dataset Selection. For the ‘car’ class of Pascal VOC 2007, exemplars are shown which upon removal from the training set result in 1% change in the predicted test performance.
D. PROPERTIES OF DATASETS PREDICT THE PERFORMANCE OF
CLASSIFIERS 27
rest of the training set; as reflected by the affinity measure. The exemplars which are labelled best inliers on the other hand, are those which keep different groups of training exemplars, distributed in form of clusters in the ‘configuration space’,
connected. In other words, these exemplars ensure that enough support in rather
critically undersampled areas of the ‘configuration space’ is retained. Figure 9
28 CHAPTER 4. SUMMARY OF PAPERS
E
Large Scale, Large Margin Classification using Indefinite
Similarity Measures
This paper proposes a scalable large-margin non-parametric categorizer equipped with deformable indefinite similarity measures [4]. The model, named Basis Ex-pansing SVM (BE-SVM), is based on a normalization of empirical kernel maps based on a restricted set of bases. The resulting optimization procedure is convex, and in fact, general fast approximate linear SVM solvers are used to optimize the model’s parameters.
The pairwise similarity measures used in the paper are generalizations of in-variant kernels, which search for the optimal (global) translation and (local) defor-mations which maximize the similarity between pairs of instances. The measures are more expensive than the RBF kernels, and they are indefinite i.e. not positive (semi) definite. However, it is shown that the negative eigenvectors of the resulting similarity matrices hold significant discriminative information. This suggests that metric restrictions on measures are not necessarily optimal for classification.
The empirical kernel maps are used to acquire a fixed length representation of exemplars based on the given similarity measures. The representation is acquired by evaluating the similarity of the instance to a fixed set of bases. Various basis selection strategies are investigated which did not exhibit significant change in the performance on the CIFAR-10 dataset. It can be expected that on more challenging datasets such as Pascal VOC, the basis selection strategy will be of much more
−1 −0.5 0 0.5 1 −1 −0.8 −0.6 −0.4 −0.2 0 0.2 0.4 0.6 0.8 1
Kernel SVM, gamma=10,100, SVs: 224.9, CV acc: 84.9
(a) Kernelized SVM −1 −0.5 0 0.5 1 −1 −0.8 −0.6 −0.4 −0.2 0 0.2 0.4 0.6 0.8 1 BE SVM P, B=65, gamma=10,100, SVs: 65.0, CV acc: 85.4
(b) BE-SVM primal objective (reduced)
Figure 10: Demonstration of kernelized SVM and BE-SVM using two Gaussian RBF kernels. Figure 10(b) is based on 10% of the data randomly selected as bases. 10 fold cross validation accuracy and the number of support vectors are averaged over 20 scenarios based on the same problem but with different spatial noises. The visualization is on the noiseless data for clarity. Best viewed electronically.
E. LARGE SCALE, LARGE MARGIN CLASSIFICATION USING
INDEFINITE SIMILARITY MEASURES 29
significance, as motivated by the work presented in the previous section.
Although it is expensive to evaluate this fixed length representation, it has the benefit of simplifying the resulting optimizations step. The computational complexities and memory requirements for training and testing of the proposed model are compared to that of the kernelized SVM based on positive definite kernels, and the proposed model is shown to have similar or better computational and memory requirements.
The experimental results on the CIFAR-10 dataset suggest that the proposed model equipped with proper invariant similarity measures outperforms the kernel-ized SVM based on the optimal parameter setting. It is shown that the model outperforms the competitors given the same number of supporting exemplars, or the same number of model parameters. Figure 10 depicts the proposed model in comparison to kernelized SVM on 2D toy data.
Chapter 5
Discussion and Conclusions
In this thesis, we investigated two types of recognition problems: category level recognition which models categories (and the inherent semantics associated with them), and category-free recognition which does not assume any semantics associ-ated with what is to be recognized.
In the category-free part, we considered novelty detection in spatial and tem-poral domains. We showed that having access to roughly 5 reference exemplars allows a non-parametric model to perform novelty detection within the problem domains that we considered. Since the view-point change was limited in our sce-narios, we expect this number to increase when significant view point changes are to be addressed by the system. However, as motivated, the data driven approach can overcome these limitations, simply by making use of more of the right kind of training data, and without any significant changes to the proposed models.
In the category-level part, we demonstrated how particular mixture models can be better adapted to the training data. Particularly, we showed that by using careful clustering of the training data, and using these clusters as initialization for the mixture models, more complex mixture models can be utilized which adapt better to the training data i.e. they can become more data driven.
We also demonstrated how to make use of invariant/deformable similarity mea-sures in a non-parametric manner, while achieving reduced training and testing costs associated with non-parametric models. Particularly we showed that de-formable similarity measures can play a significant role in designing scalable non-parametric classifiers.
Finally, we demonstrated how a model of recognition systems can be constructed which can characterize distributions of data under specific representations, and can quantify the relation between characteristics of data and expected recognition performance on similar test data. We believe this to be a first step towards gaining a more detailed insight on the interplay between data, representations, and the test performance of recognition systems. A more sophisticated version of such models would allow us to optimize data as a design parameter i.e. they could be
32 CHAPTER 5. DISCUSSION AND CONCLUSIONS
used to automatically ensure that the training data satisfies particular qualitative requirements which are shown to significantly correlate to recognition performance.
Future Work
In the category-free part, it will be interesting to investigate other types of novelties that can be extracted from large scale data, potentially acquired from wearable cam-eras. A more detailed insight about how the human brain selects memories would be beneficial for the continuation of the same research path. This would involve inter-disciplinary research between psychologists, neuro-scientists, and computer vision scientists/experts.
In the category level recognition part, it will be interesting to apply the frame-work introduced for analyzing representations, classifiers, and data distributions, to representations other than HOG, in order to gain a more detailed insight on how different representations change properties of the data: do they reduce the intra-class variation, increase data connectivity, or change other measurable properties of the training data?
Developing a more complete model of category recognition systems – one which allows large modifications to the training data – will also be beneficial. This would result in systems which can select optimal training data most suitable for catego-rizing desired target distributions.