[CONCEPTUAL DESIGN AND DEVELOPMENT OF THERMAL MANAGEMENT SYSTEM FOR HYBRID ELECTRIC AIRCRAFT ENGINE]
[A study to develop a physical model and investigate the use of Mobil Jet Oil II as coolant for aircraft electrical propulsion system under different scenarios and time horizons.]
[YASH KHANNA]
School of Business, Society and Engineering Course: [Master’s Degree Project]
Course code: [ERA 304] Credits: [30 hp]
Program: [Sustainable Energy Systems]
Supervisor: [Smruti Sahoo] Examinor: [Dr Valetina Zaccaria] Date: [2019-20-12]
ABSTRACT
The ever-increasing levels of greenhouse gas emissions has led to the scientific community starting to explore the viability of electrical aircraft system, with the most prominent research and product development for hybrid electric system, which forms the transition phase from combustion to fully electric aircrafts. The primary objective of this thesis is to find solutions towards thermal management of the electrical components of a hybrid electric aircraft
propulsion system, which generate a significant amount of heat while operating at heavy load conditions required to propel an aircraft. In view of these objectives a micro channel cold plate liquid cooling system, has been dynamically modelled using a combination of lumped parameter and thermal resistance methods of heat transfer analysis. The study investigates the prospects of using Mobil Jet Oil II, typically used as an aircraft lubricant as a coolant for the thermal management system. The primary components of this model are lithium ion battery, DC-AC inverter, permanent magnet motor, cross flow finned micro channel heat exchanger, centrifugal pump and ducts. The electrical components have been dimensioned according to energy storage and load requirements considering their efficiencies and gravimetric
power/energy. The system has been simulated and analyzed under different scenarios considering the coolant inlet temperature, air temperature across the heat exchanger and on two-time horizons. Analysis has been done to study the dynamic trends of the component temperature and the coolant at different stages of the system. The scope of the study includes an evaluation of the added weight of the thermal management system under different time horizons and their comparison with results from a reference study. From the simulation results it can be concluded that Mobil Jet Oil II is a promising option as a coolant and therefore its use as a common fluid for gas turbine lubrication and as coolant, will benefit the aircraft as now no extra coolant reservoir is required, allowing reduction in weight carried by the aircraft.
Keywords: [Hybrid electric system, Thermal management, Micro channel, Dynamic modelling, Mobil Jet Oil II, Time horizons, Battery, Inverter, Motor]
PREFACE
This report has been written for the Thesis work performed by me within the programme of Master’s in Sustainable Energy Systems at Mälardalen Högskola, Västerås, Sweden. The course corresponds to 30 hp.
I would sincerely like to thank Dr Eva Thorin and Mälardalen Högskola for giving me the opportunity to explore this new and novel field through this thesis course.
This project was conducted under the supervision of Mrs Smruti Sahoo and the examiner of this work is Dr Valentina Zaccaria.
I would like to sincerely thank my supervisor Mrs Smruti Sahoo for guiding me and motivating me through my work. Most importantly I would like to thank my parents for giving me this opportunity to study Master’s abroad and my friends for constantly supporting through the ups and downs throughout this project and motivating me to achieve excellence.
Mälardalen Högskola / Västerås, in December, 2019
SUMMARY
Thermal management of electrical components is a major challenge for aircraft applications by virtue of the large-scale energy and power requirements and operating temperature limits of the components. Further the low energy density and power density causes a potential drawback of added weight to the aircraft. In view of these challenges, this study aims to develop a physics-based model of thermal management system using Mobil Jet Oil II, which is commonly used as an aircraft lubricant as the cooling fluid. Further the study aims to analyse the trends in the temperature of both the coolant and the component and evaluate the added weight of the thermal management system under certain scenarios.
The method of cooling incorporated within this study is micro channel cold plate based, where the coolant flows through rectangular micro channels embedded within a cold plate that is mounted on the electrical components. The system is developed within a serial
architecture where the inlet of the coolant to one component is from the outlet of the previous component. In order to bring the coolant back to initial temperature conditions a heat
exchanger is also modelled which is further connected with a pump.
Theories of fluid flow and heat transfer through closed channel and on analysis of heat exchangers was referred to develop the thermo physical model of the components within the thermal management system. The power and energy storage parameters of the system was based on certain modifications on a reference study by (Lents, Hardin, Rheaume, & Kohlman, 2016), which also formed the basis of sizing the electrical components and the cold plate used.
The simulation was done on Open Modelica tool under various scenarios. The scenarios were classified in accordance with three conditions which were inlet temperature of the coolant to the system, the air temperature across the heat exchanger and the time horizon in which this system is evaluated. The results of the simulation show that under no liquid flow the
temperature of the components follows a continuous increasing curve while when the coolant is used it is maintained within the critical temperature limit of the component, indicates the Further the sensitivity studies indicate the changes in component temperatures by increasing the coolant inlet temperature and the required mass flow rate of the coolant under such scenarios.
This study has also conducted sizing analysis of heat exchanger and pump where the number of turns of coolant within the heat exchanger under steady state conditions is evaluated and the required pump power to overcome the pressure drop of coolant through the system. Based on these results the added weights of the heat exchanger and the pump is evaluated.
Comparison of the system performance and the added weight of the thermal management system was done over the time horizon of current and ten-year future time horizon and a comparison with the reference case study by (Lents, Hardin, Rheaume, & Kohlman, 2016) was also done.
In view of these simulations it is concluded that Mobil Jet Oil II is a good potential coolant for these systems and its use for dual applications for lubricant and coolant will allow weight saving benefits to the aircraft. Further there is an indication of significant reduction of both system weight and required mass flow of coolant over the 10-year time horizon compared to current time horizon.
CONTENT 1 INTRODUCTION ... 1 Background ... 1 Purpose/Aim ... 3 Research questions ... 3 Delimitation ... 3 2 METHOD ... 5
Literature Review and data collection ... 5
Component design and modelling ... 7
Simulation and Analysis ... 7
3 LITERATURE STUDY/THEORETICAL FRAMEWORK ... 8
State of the art electrical propulsion components. ... 8
State of the Art of Thermal Management System ... 9
3.2.1 Air based TMS ... 9
3.2.2 Advanced Liquid based TMS ... 10
3.2.3 Micro channel flow ... 11
Theory ... 11
3.3.1 Lagrange Multiplier method ... 12
3.3.2 Heat Transfer ... 12
3.3.3 Fluid flow through closed channels ... 13
3.3.4 Fins ... 13
3.3.5 Thermal resistance method and overall heat transfer coefficient ... 14
3.3.6 Heat Exchangers ... 15
The rating problem ... 15
The sizing problem ... 15
The effectiveness-NTU method ... 15
Component Specification ... 16
4.1.1 Battery Pack design method. ... 17
4.1.1.1. RACK DESIGN METHODOLOGY ... 17
4.1.1.2. CELL AND PACK CHARACTERISTICS... 19
4.1.1.3. GEOMETRICAL PARAMETER ... 20
4.1.2 DC-AC inverter and motor Sizing ... 21
4.1.3 Micro channel heat sink plate ... 22
4.1.4 Heat Exchanger design ... 26
4.1.5 Material Parameters ... 28
4.1.6 Fluid Properties ... 28
4.1.6.1. CONSTANT FLUID PROPERTIES ... 29
4.1.6.2. DYNAMIC FLUID PROPERTIES ... 29
Component Model formulation ... 29
4.1.1 Duct ... 30
4.1.2 Electrical component Thermal / Fluid Model ... 31
4.1.2.1. CONSERVATION OF MASS ... 31
4.1.2.2. CONSERVATION OF ENERGY ... 32
4.1.2.3. PRESSURE DROP ... 35
4.1.3 Heat Exchanger Thermal / Fluid Model ... 35
4.1.3.1. DETERMINATION OF AIR FLOW RATE ... 36
4.1.3.2. DETERMINATION OF Ε, NTU AND UA ... 37
4.1.3.3. DETERMINATION OF NUMBER OF SLABS ... 37
4.1.3.4. DETERMINATION OF PRESSURE DROPS ... 39
4.1.4 Pump Model ... 40
System Modelling and simulation ... 41
4.2.1 System characteristics. ... 42
Input parameters and system simulation. ... 44
SCENARIO DEFINITION ... 45
5 RESULTS AND DISCUSSIONS ... 47
Overall analysis for current time horizon and model verification. ... 51
5.2.1 Temperature Analysis ... 51
5.2.2 Heat Exchanger Analysis ... 54
5.2.3 Pump Analysis ... 55
Comparison of current horizon over 10-year horizon. ... 56
5.3.1 Temperature and mass flow comparison ... 57
5.3.2 Heat exchanger sizing comparison along with sensitivity study S2. ... 57
5.3.3 Pump sizing comparison along with sensitivity study S2. ... 59
5.3.4 Overall system weight comparison considering sensitivity study S2 ... 59
5.3.5 Comparison with reference study ... 60
6 CONCLUSIONS ... 63
7 SUGGESTIONS FOR FURTHER WORK ... 64
REFERENCES ... 65
LIST OF FIGURES
Figure 1 Micro channel cold plate design for battery and inverter. ... 23
Figure 2 Micro channel cold plate design for motor. ... 25
Figure 3 Micro channel cross flow heat exchanger ... 28
Figure 4 Block diagram of heat transfer mechanism. ... 34
Figure 5 TMS Layout ... 41
Figure 6 Dynamic plot of coolant inlet, outlet temperature and micro channel plate temperature for battery for Scenario 2a. ... 49
Figure 7 Dynamic plot of coolant inlet, outlet temperature and micro channel plate temperature for motor for scenario 2a. ... 49
Figure 8 Dynamic plot of coolant inlet, outlet temperature and micro channel plate temperature for inverter for scenario 2a. ... 50
Figure 9 Plot for battery and motor micro channel plate temperatures under Scenario 1a. ... 51
Figure 10 Dynamic Plot for inverter micro channel plate temperatures under Scenario 1a. ... 51
Figure 11 Electrical component plate temperatures under Scenario 2a. ... 52
Figure 12 Electrical components plate temperatures under Scenario S1. ... 52
Figure 13 Electrical component plate temperatures under Scenario S3. ... 53
LIST OF TABLES Table 1 List of data from literature ... 6
Table 2 Characteristics of NCR 18650 GA cells ... 19
Table 3 Battery pack data for number of cells and modules. ... 20
Table 4 Racked Battery pack geometrical characteristics under different time horizon. ... 20
Table 5 Battery pack dimensioning under single section design. ... 20
Table 6 Micro channel plate specifications for battery and inverter. ... 22
Table 7 Micro channel plate characteristics for motor. ... 24
Table 8 Number of channels for all the three electric components over the time horizons. .... 25
Table 9 Heat exchanger geometrical specifications. ... 26
Table 10 Properties of Aluminium 6063 T5 ... 28
Table 11 Properties of Mobil Jet oil II and Air ... 29
Table 12 Assumed geometrical parameters of duct. ... 30
Table 13 Modified and reference power distribution. ... 43
Table 14 Operating conditions of electrical components over different time horizons. ... 44
Table 15 Input parameters ... 44
Table 17 Heat exchanger air temperature data from reference study... 46
Table 18 Critical temperatures of electric components. ... 47
Table 19 Heat generation at the surface of micro channel plate under different time horizons. ... 47
Table 20 Volume of aluminium for different components under different time horizons. ... 48
Table 21 Component starting temperatures. ... 48
Table 22 Comparison of required coolant mass flow rates for different coolant inlet of current horizon. ... 54
Table 23 Equilibrium temperatures of component plates under different cases of cooling under current horizon. ... 54
Table 24 Parameters for the heat exchanger under different scenarios of current time horizon. ... 54
Table 25 Parameters for the pump under different scenarios of current time horizon. ... 55
Table 26 Equilibrium temperatures and required coolant mass flow comparison for Scenarios 2a and 2b. ... 57
Table 27 Heat exchanger parameter comparison for Scenarios 2a and 2b. ... 57
Table 28 Pump parameters for comparison of Scenarios 2a and 2b. ... 59
Table 29 Overall weight results of the Thermal Management System. ... 59
Table 30 System heat generation comparison ... 60
Table 31 Values of comparison parameters over the reference study. ... 61
Table 32 Values of comparison parameters on the basis of per kW of total system heat. ... 61
NOMENCLATURE
Symbol Description Unit
[𝐴𝐴] [Area] [m2]
[𝐶𝐶] [Heat capacity] [J.s-1.K-1]
[cp] [Specific heat at constant pressure] [J.Kg-1.K-1]
[d] [diameter] [m]
[𝑓𝑓] [Darcy’s friction coefficient] [Dimensionless] [ℎ] [Convective heat transfer coefficient] [W.m-2.K-1]
[𝑘𝑘] [Thermal conductivity] [W.m -1.K -1]
[𝑙𝑙] [Length] [m]
[ṁ] [mass flow rate] [Kg.s-1]
[𝑁𝑁𝑁𝑁𝑁𝑁] [Number of transfer units] [Dimensionless]
[Nu] [Nusselt’s number] [Dimensionless]
[P] [Power] [W]
[𝑑𝑑𝑑𝑑] [Pressure drop] [Pascal]
[Pr] [Prandtl’s number] [Dimensionless]
[𝑄𝑄̇] [Heat transfer rate] [W]
[𝑅𝑅] [Thermal resistance] [K.W-1]
[𝑁𝑁] [Temperature] [C]
[𝑡𝑡] [Thickness] [m]
[𝑁𝑁𝐴𝐴] [Overall heat transfer coefficient] [W.K-1]
[v] [Velocity] [m.s-1]
[V] [Volume] [m3]
[𝑤𝑤] [Width] [m]
[𝑥𝑥] [Dimension] [m]
[ρ] [Density] [Kg.m-3]
[μ] [Dynamic viscosity] [Pa.s]
[𝜀𝜀] [Heat exchanger effectiveness] [Dimensionless]
[θ] [Angle] [radians]
ABBREVIATIONS
Abbreviation Description
[AC] Alternating Current
[ACARE] Advisory Council for Aeronautics Research in Europe [C-GTF] Conventional Geared Turbofan
[CFD] Computation fluid dynamics [H-GTF] Hybrid Geared Turbofan
[DC] Direct Current
[HETA] Hybrid Electric Transport Aircraft
[NASA] National Aeronautics and Space Administration [NTU] Number of Transfer Units
PEFC Polymer Electrolyte Fuel Cells PCM Phase Change Material
[SUGAR] Subsonic Ultra Green Aircraft Research
[SCEPTOR] Scalable Convergent Electric Propulsion Technology Operations Research
[TMS] Thermal Management System [UA] Overall heat transfer coefficient
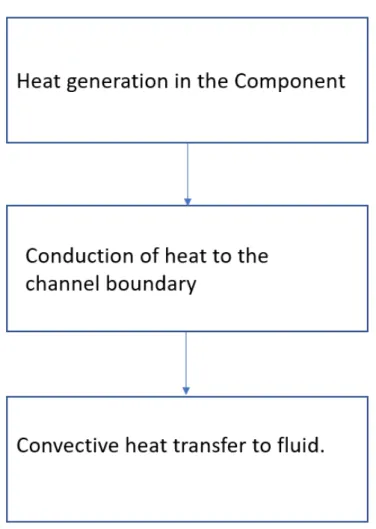
1 INTRODUCTION
Alarming rates of greenhouse gas emissions has made climate change mitigation necessary. The aviation industry is responsible for an estimated 2% of global CO2 (Carbon di-oxide) emissions (Air Transport Action Group (ATAG), 2010). Continuous goals have been made towards reduction in CO2 emissions. Thereby electric propulsion within aircrafts has become quite a significant topic of research within sustainable transportation. Electric propulsion system is broadly a three-step energy transformation process, which includes generation of electrical energy, distribution of electrical energy and finally its conversion to mechanical energy in form of shaft power. This power train consists of mainly three components which are an energy storage unit (usually a battery or fuel cell), a power electronics unit (inverter or converter) and a motor unit. The power electronics unit can be a converter or inverter
depending on whether the motor is Direct current (DC) or Alternation current (AC).
Electrical aircraft can be categorized under hybrid or purely electric architectures. While the former type combines the electrical energy storage system with a gas turbine and the power required for aircraft can be divided, the latter uses only electrical energy for aircraft propulsion.
Background
NASA has been on the fore front of research and development for conceptual designs for electrification of aviation industry. Various conceptual studies have been conducted to understand the benefits and the challenges for electrical aircraft architectures. State of the art studies have identified the sizing of the propulsion system and its integration with a robust TMS (Thermal Management System) as the core challenges for the hybridization of aircraft propulsion.
NASA funded a research study for SUGAR program in collaboration with Boing to analyses future aircrafts for the 2030’s decade. The baseline vehicle Refined SUGAR N+4 which is powered by a second-generation Geared Turbofan Engine. (Lents, Hardin, Rheaume, & Kohlman, 2016) conducted a conceptual design study to compare the Refined SUGAR N+4 aircraft on C-GTF (Conventional Geared Turbofan) and H-GTF(Hybrid Geared Turbofan) to understand the benefits and challenges for H-GTF. This study included an assessment for additional weight consideration for the electrical propulsion system and the TMS (Thermal Management System). Conclusions from the study state that with the added weight and the fuel burn required to charge the battery a fuel burn reduction of 5% is possible in a decade’s horizon considering advancement in material properties such as light weight and better thermal properties.
This thesis was conducted on a similar structural platform as a Boeing 737-800 aircraft. Study conducted by (Pornet & Isikveren, 2015) gives an insight on types of hybridization within hybrid electric aircraft framework. Hybridization gives an indication of the penetration of electrical propulsion within the hybrid framework. This can be defined in two different ways
1. Degree of Hybridization for Power: It can be defined as the ratio of maximum electric power installed to the total power installed power.
2. Degree of Hybridization for Energy: It is described as the ratio of electrical energy storage to the total energy storage.
Hybrid Architectures can be of various types. (Pornet C. , 2015) gives an insight of some of the architectures used in state-of-the-art system
1. Serial hybrid propulsion system: Serial systems incorporate a direct coupling of the gas turbine with the motor-propulsor system. The electrical generator which is driven by a turbine is coupled with the electric motor and these two systems run a common propulsor. An electrical energy storage system can also be coupled with the motor as an additional source of electrical power. Different electrical sources have been explored like electrical battery, fuel cells.
2. Parallel hybrid propulsion system: Such architectures use generator and motor as a common link between the gas turbine and the electrical systems. An example of such architecture is coupled motor to the low-pressure gas turbine shaft, which supports the propulsion. Commonly, the motor is powered by a battery. The greater challenge of this system is mismatch of optimum speed of turbine and motor which forces the turbines to work at part load speed, increasing the inefficiency of the system.
One of the major challenges for hybrid electric propulsion system is the thermal management of the heat generated in the components of the electrical propulsion system. According to (Freeman, Osterkamp, Green, Gibson, & Schiltgen, 2014), the hybrid electric distributed propulsion system by Empirical Systems Aerospace consist of 16 743 Hp motors that are power by two 6384 hp generators. Considering a 95 % motor efficiency at full power, each motor produces 27. 5 kW of heat per hour. In order to ensure smooth running of the
components this heat needs to be dissipated.
Within the scope of this study a parallel hybrid electric geared turbofan aircraft has been taken as the reference framework. This framework corresponds to the work within the study by (Lents, Hardin, Rheaume, & Kohlman, 2016).
Purpose/Aim
Electrical components have a predefined threshold operating temperature, which is constraint to material. Hence, the primary objective of this project is to develop a thermal management system by using the aircraft turbofan lubricant to maintain the temperature of the electrical propulsion system that includes a battery, DC-AC (Direct current to alternating current) power inverter and an AC motor.
Research questions
1. What is the potential of an aircraft lubricant as a coolant for the thermal management system?
2. How does the inlet temperature and mass flow rate of the coolant affect the temperature of the components?
3. What is the added weight to the electrical propulsion system by the thermal management system under conditions of different time horizons and their scenarios?
Delimitation
Although the thermal management system uses a heat exchanger to bring the state of the coolant to the initial stage, the system is displayed as an open system. Under steady state the output of the pump is essentially going to reservoir. Since, the reservoir in this study is
assumed to be the common reservoir for the entire lubrication system, therefore the total mass in the reservoir is indefinite, thereby making this analysis under open system.
The scope of the study does not include a constraint on the pressure drop of the coolant across the system. Therefore, the pressure drop is a variable output of the system.
The study considers the coolant to be Mobile Jet-Oil II, which is an industrial lubricant for geared turbofan engines. Aluminium is the chosen metal for heat sink and heat exchanger plate material.
A detailed thermal network model requires information of the internal layout within the system as well as multi-dimensional heat and fluid flow. Even after considering a
one-dimensional, detailed internal layout of the component is required. This information was only available for the motor (Yoon, Yi, Martin, Chen, & Haran, 2016) and therefore to maintain a uniformity the temperatures of component evaluated are at the surface of the micro channel cold plate. This model is therefore a combination of thermal resistance and lumped parameter methods of heat transfer analysis. The system design and simulation are conducted under two different time horizons which are the corresponding to the current timeframe and future time frame within 10 years.
For the case of simulations, the heat exchanger model is only simulated in steady state conditions. The heat exchanger is built on the concept of sizing problem, the desired
temperature of air at the inlet and outlet of the heat exchanger, and the coolant temperature at the outlet of the heat exchanger are already known. So, it has to be designed based on pre-defined hot fluid and cold fluid. What has been observed in case of dynamic simulation is that there can be instances when the coolant temperature from the heat loads can be lower than the inlet temperature of air as described in detail in section 5.1. This is why if the heat exchanger is run on dynamic conditions there can be situation of disturbance in energy balance leading to Reynolds number taking form of complex numbers within the Nusselt’s number equation, hence forth giving a solver error for determination of number of passes. Hence forth the simulation of heat exchanger at steady state ensures that the coolant inlet temperature is always higher than air inlet and outlet temperature, making the energy balance work. Since, there is no commercially available system and the data of the prototype system is unavailable the model results have not been validated. The model has been verified under a sensitivity study with different coolant inlet temperature under same and different coolant flow rate. Results from the study have been compared with a conceptual study under similar simulating conditions.
2 METHOD
This section gives an overview of the different phases within the project. The project has been done within three phase which are
1. Literature Review and data collection 2. Component design and modelling 3. System Simulation
Literature Review and data collection
Literature has been studied to understand what are the primary aspects that define the development of this project. Further different theories have been studied concerning fluid flow, heat transfer and Lagrange multiplier method. The literature has been categorized under 3 categories
a. Understanding of the state of the art of electrical propulsion component such as battery, inverter and motor.
b. Methods used and proposed for developing a thermal management system? c. Characteristics of fluid flow through a micro channel.
An important task for this project is design of electrical components as well as heat
exchanger. The required parameters have been taken with consideration from different studies on electrical component parameter value prediction ( (National Academies of Sciences, 2016), (Panasonic), (Lents, Hardin, Rheaume, & Kohlman, 2016) and from investigative studies of micro channel heat exchanger design (Khan & Fartaj, 2011). Further the channel design has been motivated from design studies on micro channel heat sinks for power electronics (Biswal, Chakraborty, & Som, 2009) . Material parameters for designing were taken from data sheet of aluminium alloys from the web. It is essential that the thermal management system allows the operation temperature of the component to be below the critical limit. Various studies on electric components as well as thermal management systems have defined these temperatures. Within this project studies were reviewed to compile the critical
temperatures of lithium ion battery, silicon carbide inverter as well as a permanent magnet motor.
Apart from heat load, heat transfer is also taking place in heat exchanger. From the developed model of heat exchanger section 5.1.3, as motivated from theory of heat exchanger sizing problem in order to simulate the heat exchanger, it is essential to know the air temperatures. The air temperatures correspond to the ram air temperature. This means that the heat
exchanger is supposed to heat the air to the required free stream temperature of air at the compressor inlet. This information is based on design of gas turbine propulsion system and again changes in material properties across time horizons play an important role. The data of
air temperatures is taken from (Lents, Hardin, Rheaume, & Kohlman, 2016) paper
corresponding to the aircraft in investigation for both current and 10-year future time horizon. Data for pump gravimetric power was taken for Lowara 15-4/130 eco basic pump. It is considered within this study that pumps have achieved saturation in substantial improvement of gravimetric power and therefore is kept constant for all the time horizons.
The Table 1 shows a compiled list of sources for various data taken from literature.
Table 1 List of data from literature
Data Source
Reference energy storage required (Lents, Hardin, Rheaume, & Kohlman, 2016)
Component efficiency (National Academies of Sciences, 2016), (Lents, Hardin, Rheaume, & Kohlman, 2016)
Motor and Inverter gravimetric power (National Academies of Sciences, 2016) Battery gravimetric energy storage (National Academies of Sciences, 2016) Heat exchanger geometrical parameters (Khan & Fartaj, 2011)
Heat load micro channel dimension (Biswal, Chakraborty, & Som, 2009) Lithium ion cell characteristics (Panasonic)
Air temperature data (Lents, Hardin, Rheaume, & Kohlman, 2016)
Critical temperature of battery (Panasonic)
Critical temperature of motor (Liu, Chow, & Wu, 2015), (Madonna, o.a., 2019)
Critical temperature of inverter (Schnulo, Chin, & Smith, 2017), (Buttay, o.a., 2012), (Buttay, o.a., 2011)
Properties of fluids (Mobil Jet Oil II, Aircraft Type Gas Turbine Lubricant, 2019), (Viscosity of Air,
Dynamic and Kinematic, 2019)
Component design and modelling
Using the data collected various methods were used for designing the component. The design of component includes the material as well the dimensions of the components. The designing of the electrical components and the heat exchanger was conducted on excel. All the
components have been modelled on Open Modelica and the model equations have been coded using the theories of fluid flow and heat transfer. The connectors used for flow of coolant through the components and air through the heat exchanger were also coded.
Simulation and Analysis
The simulations are conducted under two broad conditions. The first condition represents the condition where no coolant is flown through the electric components under situation of continuous operation with constant efficiency. The second condition is analysis with coolant flow activated. Within each of these scenarios there are sub scenarios divided into current and ten years within future time horizons. Further sensitivity studies have been conducted under considerations of change in coolant temperatures, coolant mass flow rate and air temperatures. The system analysis over different time frames has considered improvement in component efficiency, specific energy storage and gravimetric power over the time frames as predicted from state-of-the-art studies. Properties of material for heat sink and heat exchanger remain same over the time frames. The major parameters for evaluation of simulation will be the temperature of component as well as the coolant across each component, the passes of coolant and air for the heat exchanger and the mass flow of coolant as well as air, the weight of the heat exchanger as well as the power rating and weight of the pump. Comparison of results over the scenarios and from previous studies under similar conditions of simulations is also conducted within this Master’s thesis.
3 LITERATURE STUDY/THEORETICAL FRAMEWORK
To understand the state of art concerning hybrid electric aircraft propulsion and their TMS, various research articles and reports were studied.
State of the art electrical propulsion components.
Electrical batteries offer a good breakthrough to reduce dependence on kerosene as source of electrical power with efficiencies ranging above 90%. Considering the state-of-the-art battery technologies, Lithium ion batteries offer highest gravimetric specific energy which is the energy storage per unit mass, however kerosene still has eight times the gravimetric specific energy of these batteries (Kuhn, Falter, & Sizmann, 2011). Hydrogen based PEFC (polymer electrolyte fuel cells) offer three times the gravimetric energy storage with similar operation efficiency as compared to kerosene fuelled gas turbine, the storage of hydrogen makes feasibility of its integration challenging (Kuhn , Seitz, Lorenz, Isikveren, & SIzmann, 2012). According to (Lents, Hardin, Rheaume, & Kohlman, 2016)batteries have a potential of 5 times improvement in gravimetric metric energy density within next 2 decades from 200 hr/Kg to 1000 W-hr/Kg. For the fuel cells the scope of improvement is 2 times within the same time frame from 1.5 kW/kg to 3kW/kg (Kuhn , Seitz, Lorenz, Isikveren, & SIzmann, 2012). Although the specific energy of hydrogen fuelled PEFC is much higher than battery, the additional weight of hydrogen storage and the potential hazards due to its high in flammability makes the trad-off between batteries and fuel cells an important aspect of electrical energy storage for aviation industry. Silicon carbide power inverters have been well adopted within the power electronics industry. Study by ( (Buttay, o.a., 2011) , (Buttay, o.a., 2012)) suggest that silicon carbide has high operational temperature limits. In case of motors permanent magnet motors with Neodymium iron boron, Samarium cobalt offer strong permanent magnet behaviour with wide operation temperature range (Liu, Chow, & Wu, 2015). By virtue of their high operational temperature range Silicon carbide power electronics and permanent magnet motors have great benefits when used within aircraft electrical propulsion system.
Study has been conducted by (National Academies of Sciences, 2016) that analyse factors such as overall component efficiency, the gravimetric power of the power electronics and electric machines, also the energy density of batteries for current as well as future time frames.
State of the Art of Thermal Management System
Thermal management systems for different electric components of electric aircraft propulsion have been conducted.
A literature review for TMS was conducted under three broad categories 1. Air based TMS.
2. Advanced liquid based TMS. 3. Micro channel flow.
3.2.1 Air based TMS
Different layouts for TMS have been explored for electrical transportation. Electrical vehicles are steadily taking up the market share for vehicles. Electrical batteries are the energy source to drive the motors for an electrical vehicle. It is thereby required for the batteries to have high energy density. Amongst the current electrical battery technology Lithium ion batteries have the highest energy density ranging from 110-160 Wh/kg (Hannan, Hoque, Hussain, Yusof, & Ker, 2018). According to (Heesung, 2013), the life of a lithium ion battery reduces by 2 months for a every degree rise in temperature over 40 ˚ C. A common cooling architecture is the forced air circulation cooling using electrical fan. This concept is based on the principle of convective heat transfer between the battery cells and air. Ambient air drawn through the electrical fan is passed between the lithium ion cells from which it takes away heat. The hot air from the outlet of the battery is discharged back to the atmosphere. A study conducted by (Heesung, 2013) on a Lithium ion battery with an energy storage of 1400Wh with a heat flux of 245 W/m2 showed that under tapered air manifold design such systems are capable of controlling the maximum cell temperature within the desired operation limit. The low cost and easy design flexibility make forced air circulation the preferred thermal management system for EV’s on commercial scale.
Conceptual designs of air cooling based on external heat sinks have been proposed for electrical aircraft engines. Review from (Schnulo, Chin, & Smith, 2017) gives information about the SCEPTOR program NASA is working on fully electric distribution propulsion system called Maxwell X-57. For the aircraft of investigation in the study by (Schnulo, Chin, & Smith, 2017) a heat sink based cooling system was designed. The aircraft design included electrical motors installed on the wing tip that provided the propulsion to the aircraft. High velocity air is flown through the motors that maintains the temperature of motors within the desired limit. Finned
aluminum heat sinks have been installed at the downstream of each motor nacelle to cool the air before being exhausted from the motor nacelle. Further the heat sink temperature is maintained by evenly distributing the heat to the composite wing via conduction heat transfer.
3.2.2 Advanced Liquid based TMS
Advanced TMS system have been proposed by (Kang, 2012), including cold plate liquid cooling system. Further cold plates cooling can be of several types like direct spraying, vortex plate cooling, closed channel cooling, finned cold plate cooling etc. Various liquids can be used such as water, oils and refrigerants as the cooling medium for liquid based TMS. (Sakanova, o.a., 2016), (Lents, Hardin, Rheaume, & Kohlman, 2016). Oils offer an advantage over water as a coolant for aircraft as their boiling temperature is over 100 ˚ C, which is a limitation for water. Further since lubrication is an essential requirement for gas turbines, this circulated lubricant can be used for cooling the electrical components. One option for this is Mobil Jet Oil II, the operating temperature of which is between -40˚ C to 204˚ C (Mobil Jet Oil II, Aircraft Type Gas Turbine Lubricant, 2019), therefore making it a potential coolant. On the contrary using a refrigerant as coolant will require an extra reservoir for the system, leading to addition of weight. Different materials like stainless steel, copper, brass, aluminum, glass etc have been explored for heat sinks (Khan & Fartaj, 2011). Within the scope of this study Aluminum is chosen as the material for the micro channel heat sink plate. Various factors like need to considered while choosing the material out which thermal conductivity, strength to weight ratio and ease of extrusion are some of the factors. It has often been concluded that Aluminum offers one of the best combination of properties for a heat sink material. In terms of manufacturing, it is highly malleable and therefore can be fabricated in shapes of fins with low cost (Aluminium, 2017). In terms of structure, the higher strength to weight ratio of aluminum over steel, copper and brass, therefore giving the heat sink structure higher stability and light weight. (Aluminium, 2017). High thermal conductivity is an essential requirement for a heat sink material for it facilitates more effective heat transfer. The ratio of thermal conductivity of aluminum over steel, copper and brass are 4:1, 1:0.532 and 1.88:1 respectively (Thermal Conductivity, 2005). Amongst different alloys of aluminum Al 6060, Al 6061 and Al 6063 are the best option. Theoretically these methods have the potential for a more efficient TMS compared to commercial methods that use air as the cooling medium by virtue of their higher specific heat, better heat transfer coefficient and lower specific volume in comparison to air. Often in such systems liquid to air heat exchangers are incorporated which cool the liquid. However, implementation of these systems on a commercial scale for a hybrid electric aircraft engine has been quite challenging. A conceptual study for a liquid closed circulation cooling for a conceptual H-GTF by (Lents, Hardin, Rheaume, & Kohlman, 2016) proposed a closed loop TMS for the N+4 Refined Sugar Baseline Conceptual H-GTF. The study results concluded that the added weight for to TMS based on current material technology was 391 lb.(convert) out of
which the Ram air heat exchanger used for cooling the liquid coolants were 80% of the gross weight.
3.2.3 Micro channel flow
Micro channel is considered channels whose hydraulic diameter falls below 1mm (Khan & Fartaj, 2011). Various studies concerning micro channels were referred which describes the relations of fluid flow and heat transfer within micro channels. Experimental studies have observed slight deviation of the Darcy’s friction factor and the Nusselt’s number for a fluid flow within micro channel compared to macro channel. The review paper (Morini, 2004) and the experiments conducted by( (Webb & Zhang, 1998), (Yang, Wu, & Chien, 2003) )show that the Poisuille number, which is the product of friction factor and Reynolds number for laminar flow in micro channel is roughly similar to flow through macro channels. Research from (Adams & Abdel-Khalik, 1998) and (Khan & Fartaj, 2011) suggests the relation of friction factor for turbulent flow within micro channels. This correlation is linked with the modified Gnielinski correlation, that has been shown as valid equation of the Nusselt’s number for turbulent flow within a micro channel. Unlike the laminar flow in macro channel where the Nusselt’s number is a constant depending on geometry (Cengel & Ghajar, 2011), the Nusselt’s number for turbulent flow has some correlation when the flow is in laminar flow. Studies by (Peng & Peterson, 1996) , (Choi & Warrington, 1991) describe these relations which have been used for rectangular and circular cross section.
Micro channel shown potential of enhanced cooling by its attributes of high heat transfer over small volumes. A review study by (Khan & Fartaj, 2011) the heat transfer surface area density of micro channels to be 10,000 m2m-3, which for conventional heat exchangers falls within the
range of 700 m2m-3. Experimental study by (Jiang, Si, Fan, & Ren, 2001) evaluated the
potential of volumetric heat transfer coefficient of micro channel heat exchanger to be 100 MW m-3K-1, which for conventional heat exchangers falls by 2 order of magnitude. The high
heat transfer of micro channel has also led to its application for heat sinks, specifically for power electronics. A finite element study of a Gallium nitride (GaN) power module embedded with rectangular micro channel by (Zhang, Yang, Qiao, & Boroyevich, 2016) showed the maximum temperature of the power module dropped by 16 ˚ C compared to conventional GaN power module.
Theory
This section describes the fundamental theoretical framework upon which the physical
models have been developed which can be broadly categorized under fluid flow through pipes conduction heat transfer, convection heat transfer and heat exchangers.
3.3.1 Lagrange Multiplier method
Lagrange multiplier is a method of optimization used for equality constraints. This method can find the maxima or minima of the function under consideration by introducing Lagrange multiplier variable to the list of primary variables. The number of added variables is same as the number of constraints. The primary components of this method are
a. Objective function
b. Constraints which the objective function is subject to
c. The set of independent variables which define the objective function and the constraint.
The general equation of Lagrange multiplier method is
𝜕𝜕𝜕𝜕 𝜕𝜕𝑥𝑥𝑖𝑖+ ∑ 𝜆𝜆𝑘𝑘 𝜕𝜕∅𝑘𝑘 𝜕𝜕𝑥𝑥𝑘𝑘 𝑛𝑛 𝑘𝑘=1 = 0 Equation 3.1 For 𝑖𝑖 = 1 𝑡𝑡𝑡𝑡 𝑑𝑑 Here
𝑓𝑓�𝑥𝑥𝑖𝑖, … … 𝑥𝑥𝑝𝑝� Equation 3.2 forms the objective function.
∅ = �∅𝑘𝑘�𝑥𝑥𝑖𝑖, … … 𝑥𝑥𝑝𝑝�, … . . ∅𝑛𝑛�𝑥𝑥𝑖𝑖, … … 𝑥𝑥𝑝𝑝�� Equation 3.3 Forms the set of constraints
𝜆𝜆 = {𝜆𝜆𝑘𝑘, … … . . 𝜆𝜆𝑛𝑛}Equation 3.4 Forms the set of langrage multipliers corresponding to
respective constraints.
The complete set of independent variables is 𝑉𝑉 = {𝑥𝑥𝑖𝑖, … … 𝑥𝑥𝑖𝑖, 𝜆𝜆𝑘𝑘, … … 𝜆𝜆𝑛𝑛} Equation 3.5
3.3.2 Heat Transfer
Heat transfer is the backbone of modelling this system. The mechanism of heat transfer taken into consideration for this study are by conduction and convection. Heat transfer can occur by three major mechanisms which are conduction, convection and radiation. While conduction and convection require a medium, radiation does not require it. Conduction heat transfer occurs when transfer of energy takes place from one particle of the medium to another. Conduction occurs in solids, liquids as well as gases. Convection is a form of heat transfer which occurs between two mediums when either of them is at motion. Therefore, convection is a form of conduction in which the fluid particle is moving. The heat transfer equations of conduction and convection are as follows
Conduction 𝑄𝑄̇𝑐𝑐𝑐𝑐𝑛𝑛𝑐𝑐 = −𝑘𝑘𝐴𝐴𝑐𝑐𝑐𝑐𝑐𝑐𝑐𝑐𝑐𝑐𝑐𝑐𝑑𝑑𝑐𝑐𝑥𝑥 Equation 3.6
𝑘𝑘 is the thermal conductivity of the solid, 𝐴𝐴𝑐𝑐𝑐𝑐𝑐𝑐𝑐𝑐𝑐𝑐 is cross section area for heat flux, T is the
temperature of the body at distance 𝑥𝑥 , 𝑥𝑥 is the direction of heat flow, ℎ is the convective heat transfer coefficient, 𝐴𝐴𝑐𝑐 is the convective heat transfer area, 𝑁𝑁𝑐𝑐 is the surface temperature of the
body and 𝑁𝑁𝑎𝑎𝑎𝑎𝑎𝑎 is the ambient temperature.
3.3.3 Fluid flow through closed channels
The type of fluid flow through pipes can be understood using Reynolds number. Reynolds number is a non-dimensional number that signifies the ratio of the inertial forces on fluid to viscous forces. This number signifies whether the flow is laminar, transition or turbulent. 𝑅𝑅𝑅𝑅 = 𝜌𝜌𝑑𝑑𝜌𝜌/𝜇𝜇 Equation 3.8
Here Re is the Reynold’s number, ρ is the fluid density, d is the hydraulic diameter of the channel, v is the velocity of the channel, μ is the dynamic viscosity.
Other crucial parameters for fluid flow through channels are the Prandtl’s number and the Nusselt’s number, which help determine the heat transfer coefficient. Equation 3.7 and Equation 3.8 define these parameters
𝑃𝑃𝑃𝑃 = 𝜇𝜇𝑐𝑐𝑝𝑝/𝑘𝑘 Equation 3.9
𝑁𝑁𝑁𝑁 = 𝑓𝑓(𝑅𝑅𝑅𝑅, 𝑃𝑃𝑃𝑃) Equation 3.10
Here Pr is the Prandtl’s number, μ is the dynamic viscosity, cp is specific heat at constant
pressure, k is the thermal conductivity of fluid, Nu is the Nusselt’s number.
Fluid flow through closed channel leads to pressure drop due to viscous effects. The pressure drop occurs with different magnitude for a straight pipe or a bend pipe. Equation 3.9 defines the flow through pipe
𝑑𝑑𝑑𝑑 =𝜕𝜕𝑓𝑓𝑓𝑓𝑐𝑐2𝑐𝑐2 Equation 3.11 Where
𝑓𝑓 is the Darcy friction coefficient, 𝑙𝑙 is the length of the pipe, 𝜌𝜌 is the fluid density,𝜌𝜌 is the average velocity,𝑑𝑑 is the hydraulic diameter, 𝑑𝑑𝑑𝑑 is the pressure drop.
3.3.4 Fins
Fins are extended surfaces which are used to enhance the heat transfer on the basis of
increased surface area. Fins are often used within liquid to gas heat exchanger to compensate the low heat transfer coefficient for gas. Fins are usually added as thin plates to make the design compact.
Fin tips are often associated with convective heat transfer boundary condition. The common approach to design such fins is to consider a corrected fin length that makes the solution simpler. For a rectangular fin this is given as
𝑙𝑙𝑖𝑖 = 𝑙𝑙 +2𝑡𝑡 Equation 3.12
Where
𝑙𝑙𝑖𝑖 is the characteristic length of a straight rectangular fin (m) considering insulated fin tip, 𝑙𝑙 is
the actual fin length under convective boundary at fin tip. 𝑡𝑡 is the thickness of the fin (m).
3.3.5 Thermal resistance method and overall heat transfer coefficient
Often a heat transfer process occurs in combination of different mechanism of heat transfer. Therefore, a thermal resistance method is often incorporated which defines the overall heat transfer. Here different points or nodes are established which define the points where temperature is monitored. A thermal resistance between each of such points is calculated based on equations for conduction, convection and radiation. The governing equations of this model are given as
𝑄𝑄̇ = 𝑅𝑅 ∆𝑑𝑑
𝑚𝑚𝑚𝑚𝑚𝑚𝑖𝑖𝑚𝑚𝑚𝑚 Equation 3.13
Here 𝑄𝑄̇ is the heat transfer rate (W), ∆𝑁𝑁 is the nodal temperature difference (K), 𝑅𝑅𝑎𝑎𝑚𝑚𝑐𝑐𝑖𝑖𝑚𝑚𝑎𝑎 is
the resistance offered between the nodes
The thermal resistance for a medium with conductive and convective heat transfer is given by 𝑅𝑅𝑐𝑐𝑐𝑐𝑛𝑛𝑐𝑐𝑚𝑚𝑐𝑐𝑡𝑡𝑖𝑖𝑐𝑐𝑚𝑚 = 𝐾𝐾𝐴𝐴𝐿𝐿
𝑐𝑐𝑐𝑐𝑐𝑐𝑐𝑐𝑐𝑐 Equation 3.14
𝑅𝑅𝑐𝑐𝑐𝑐𝑛𝑛𝑐𝑐𝑚𝑚𝑐𝑐𝑡𝑡𝑖𝑖𝑐𝑐𝑚𝑚 =ℎ𝐴𝐴𝑐𝑐𝑐𝑐𝑐𝑐𝑐𝑐1 Equation 3.15
Here
𝐿𝐿 is the length of conduction, K is thermal conductivity of conduction medium, 𝐴𝐴𝑐𝑐𝑐𝑐𝑐𝑐𝑐𝑐𝑐𝑐 is the
cross-section area of conduction medium and 𝐴𝐴𝑐𝑐𝑐𝑐𝑛𝑛𝑐𝑐 is the convective heat transfer and ℎ is
the convective heat transfer coefficient.
Often the combined resistance due to different heat transfer mechanisms is also analysed as the overall heat transfer coefficient which can be understood by following set of Equation 3.16 and Equation 3.17
𝑁𝑁𝐴𝐴 = 𝑅𝑅 1
𝑡𝑡𝑐𝑐𝑡𝑡𝑡𝑡𝑡𝑡 Equation 3.16
𝑅𝑅𝑡𝑡𝑐𝑐𝑡𝑡𝑎𝑎𝑓𝑓 = 𝑅𝑅𝑐𝑐𝑐𝑐𝑛𝑛𝑐𝑐𝑚𝑚𝑐𝑐𝑡𝑡𝑖𝑖𝑐𝑐𝑚𝑚+ 𝑅𝑅𝑐𝑐𝑐𝑐𝑛𝑛𝑐𝑐𝑚𝑚𝑐𝑐𝑡𝑡𝑖𝑖𝑐𝑐𝑚𝑚+ ⋯ 𝑡𝑡𝑡𝑡ℎ𝑅𝑅𝑃𝑃 Equation 3.17
3.3.6 Heat Exchangers
Heat exchangers are devices that allow heat transfer to happen between two fluids without mixing them. Heat exchangers are often analysed under two categories of problem
The rating problem
This type of problem considers the inlet temperature and mass flow rates of both hot fluid and the cold fluid to be known. Further the geometry and the size of the heat exchanger are also known. Size of a heat exchanger is usually defined by the number of passes of both the fluid. The objectives are to evaluate the performance of the heat exchanger such as effectiveness of the heat exchanger as well as the exit temperatures.
The sizing problem
The objectives of this type of problem is to define the size of the heat exchanger. The
temperatures of the fluids are known with at least the mass flow rate of either of the fluids. In order to conduct the solution, the essential things to be known are the type of the heat
exchanger must be known i.e. whether the heat exchanger is cross flow, counter flow or parallel flow heat exchanger, the flow pattern of both the fluids and the geometrical
parameters of both the hot fluid and cold fluid channels must be known. The common way of solving this problem is by using the effectiveness-NTU method to determine the UA value which can further be used to calculate the number of passes for the fluids.
The effectiveness-NTU method
The basics of analysing a heat exchanger with this method are 𝑄𝑄̇ = 𝜀𝜀𝑄𝑄̇𝑎𝑎𝑎𝑎𝑥𝑥 Equation 3.18
Where
𝜀𝜀 is the effectiveness of the heat exchanger 𝑄𝑄̇𝑎𝑎𝑎𝑎𝑥𝑥 is the maximum possible heat transfer rate
Another set of crucial equation used is 𝑁𝑁𝑁𝑁𝑁𝑁 =𝐶𝐶𝑈𝑈𝐴𝐴
Where 𝑁𝑁𝑁𝑁𝑁𝑁 = 𝑓𝑓(𝐶𝐶𝑐𝑐, 𝜀𝜀) is the number of transfer units, 𝐶𝐶𝑐𝑐 is the ratio 𝐶𝐶𝑎𝑎𝑖𝑖𝑛𝑛/𝐶𝐶𝑎𝑎𝑎𝑎𝑥𝑥, 𝐶𝐶𝑎𝑎𝑖𝑖𝑛𝑛 and
𝐶𝐶𝑎𝑎𝑎𝑎𝑥𝑥 are heat capacities of fluids, and 𝑁𝑁𝐴𝐴 is the overall heat transfer coefficient of the heat
exchanger.
4 CURRENT STUDY
This section describes the development and simulation of the model with a bottom-up approach. The work begins with describing the specifications of the components including both geometry and material, further the model development of each component is described. The last segment describes the complete system modelling including the model process flow, the operating conditions of the system as well the procedure of simulation.
Component Specification
The operational power of the heat loads is of the order of 1 MW. Further, it is considered that operating voltage of the motor is 1kV (Vratny, Kuhn, & Hornung, Influences of voltage variations on electric power architectures for hybrid electric aircraft, 2017). The battery, inverter and motor are setup in a parallel connection and therefore the operating voltage of all the components is 1kV. To incorporate a thermal network model with evaluating the actual temperature at different nodes of each heat load requires specific knowledge of all the materials used within the component and the dimension of heat load because the micro channel-based cooling plate can only be designed after knowing the dimension.
Battery: The battery pack is sized based on electrical parameters such as required operational voltage, energy density, capacity and then further on the specific dimensional characteristics of the cells used in the battery pack. The battery module size is calculated to minimize the volume occupied by the battery.
Inverter and motor: The sizing of inverter and motor are done using scaling of reference silicon carbide inverter and a permanent magnet motor.
Sizing of plate and micro channel: Each heat load consists of micro channel heat sink plates which have micro channel at its bottom. Based on the total dimension of the heat load and the channel width the number of micro channels in a micro channel heat sink plate is calculated.
Dimensions of components have to be predicted for future time horizons. This is why the information of expected future energy density and component efficiency is essential to scale the components in terms of size.
4.1.1 Battery Pack design method.
From the section 5.1 the operating system voltage is 1kV. Therefore, each battery module must give a power output of 1kV. Therefore, using the data of cell nominal capacity and the battery pack capacity, the number of modules can be determined.
Given, all the cells in the module are connected in series the number of cells in one module is 𝑁𝑁𝑐𝑐𝑎𝑎 = 𝑂𝑂𝑚𝑚𝑡𝑡𝑝𝑝𝑚𝑚𝑡𝑡 𝑐𝑐𝑐𝑐𝑓𝑓𝑡𝑡𝑎𝑎𝑣𝑣𝑚𝑚 𝑐𝑐𝑚𝑚𝑟𝑟𝑚𝑚𝑖𝑖𝑐𝑐𝑚𝑚𝑎𝑎𝑚𝑚𝑛𝑛𝑡𝑡𝑁𝑁𝑐𝑐𝑎𝑎𝑖𝑖𝑛𝑛𝑎𝑎𝑓𝑓 𝑐𝑐𝑚𝑚𝑓𝑓𝑓𝑓 𝑐𝑐𝑐𝑐𝑓𝑓𝑡𝑡𝑎𝑎𝑣𝑣𝑚𝑚 Equation 4.1
Where Ncm is the number of cells in a module.
Further, from the knowledge of the total energy storage required in the system, the battery capacity in Ah is given as
𝐶𝐶𝐶𝐶𝑑𝑑𝐶𝐶𝑐𝑐𝑖𝑖𝑡𝑡𝐶𝐶𝑎𝑎𝑎𝑎𝑡𝑡𝑡𝑡𝑚𝑚𝑐𝑐𝑏𝑏= 𝑆𝑆𝑏𝑏𝑐𝑐𝑡𝑡𝑚𝑚𝑎𝑎 𝑐𝑐𝑝𝑝𝑚𝑚𝑐𝑐𝑎𝑎𝑡𝑡𝑖𝑖𝑛𝑛𝑣𝑣 𝑐𝑐𝑐𝑐𝑓𝑓𝑡𝑡𝑎𝑎𝑣𝑣𝑚𝑚 𝑅𝑅𝑚𝑚𝑟𝑟𝑚𝑚𝑖𝑖𝑐𝑐𝑚𝑚𝑐𝑐 𝐸𝐸𝑛𝑛𝑚𝑚𝑐𝑐𝑣𝑣𝑏𝑏 𝑆𝑆𝑡𝑡𝑐𝑐𝑐𝑐𝑎𝑎𝑣𝑣𝑚𝑚 Equation 4.2
The battery pack contains a number of modules which are connected in parallel. The capacity in Ah represents the current drawn from the module which is constant because all the cells in a module are in series and therefore the total current drawing capacity of the battery pack will be the summation of all the currents. Since, each module represents the same amount of voltage supplied and the cell type in each module is same the current drawing capacity for them will be same and therefore, the number of modules can be given by
𝑁𝑁𝑎𝑎 =𝑅𝑅𝑎𝑎𝑡𝑡𝑚𝑚𝑐𝑐 𝐶𝐶𝑎𝑎𝑝𝑝𝑎𝑎𝑐𝑐𝑖𝑖𝑡𝑡𝑏𝑏 𝑐𝑐𝜕𝜕 𝑐𝑐𝑚𝑚𝑓𝑓𝑓𝑓𝑑𝑑𝑐𝑐𝑡𝑡𝑎𝑎𝑓𝑓 𝐶𝐶𝑎𝑎𝑝𝑝𝑎𝑎𝑐𝑐𝑖𝑖𝑡𝑡𝑏𝑏 Equation 4.3
The above described method has been motivated from the study conducted by (Vratny, Gologan, Pornet, Isikveren, & Hornung, 2013)
4.1.1.1. Rack design methodology
The battery pack is designed in form of racks. This means each battery module consists of a number of sections in which equal number of cells are arranged. The Lagrange multiplier method was followed for this purpose.
The objective function can be described as 𝐶𝐶 = 𝑚𝑚𝑖𝑖𝑚𝑚𝑖𝑖𝑚𝑚𝑖𝑖𝑚𝑚𝐶𝐶𝑡𝑡𝑖𝑖𝑡𝑡𝑚𝑚 (𝜌𝜌𝑡𝑡𝑙𝑙𝑁𝑁𝑚𝑚𝑅𝑅)Equation 4.4
One of the key objectives of planes is lower weight allowance and compact component fitting, which is why objective function is taken as minimization of volume. Since the net density of battery pack material remains constant, minimization of volume achieves the objective of compactness and lower weight.
The volume of the battery pack is given as 𝐶𝐶 = 𝐴𝐴𝑎𝑎𝑎𝑎𝑎𝑎𝑐𝑐𝑚𝑚𝐻𝐻𝑐𝑐 Equation 4.5
Where
𝐴𝐴𝑎𝑎𝑎𝑎𝑎𝑎𝑐𝑐𝑚𝑚, 𝐻𝐻𝑐𝑐 are the area of module base and the height of the cell. In this design the height of
the cell is same as height of the section.
The set of independent variables that describe the objective function and the constraint are 𝑖𝑖𝑚𝑚𝑑𝑑𝑅𝑅𝑑𝑑𝑅𝑅𝑚𝑚𝑑𝑑𝑅𝑅𝑚𝑚𝑡𝑡 𝜌𝜌𝐶𝐶𝑃𝑃𝑖𝑖𝐶𝐶𝑣𝑣𝑙𝑙𝑅𝑅𝑣𝑣 = { 𝑃𝑃 , 𝑑𝑑 , 𝑣𝑣, 𝜆𝜆}Equation 4.6
Therefore, with the cells being cylindrical the area of the base can be given as 𝐴𝐴𝑎𝑎𝑎𝑎𝑎𝑎𝑐𝑐𝑚𝑚=
𝜋𝜋
4𝑑𝑑𝑐𝑐2𝑃𝑃𝑑𝑑. Equation 4.7
Each section of the module is divided into number of rows of cells and number of columns of cells. Therefore, the problem variables are 𝑃𝑃, 𝑑𝑑 𝐶𝐶𝑚𝑚𝑑𝑑 𝑣𝑣 , where r and p represent the number of rows and columns of cells within a section respectively and s represents number of sections. The constraint that the objective function is subject to is the number of cells connected in series within a module which is calculated from the Equation 4.1. The product of number of cell rows, the number of cell columns and the number of sections must be equal to the total number of cells in the module.
∅ = 𝑃𝑃𝑑𝑑𝑣𝑣 − 𝑁𝑁𝑐𝑐𝑎𝑎 Equation 4.8
Using the Lagrange multiplier method on the above problem the problem equations are
𝜋𝜋 4𝑑𝑑𝑐𝑐2𝑑𝑑𝑣𝑣𝐻𝐻𝑐𝑐 − 𝜆𝜆𝑑𝑑𝑣𝑣 = 0 Equation 4.9 𝜋𝜋 4𝑑𝑑𝑐𝑐 2𝑃𝑃𝑣𝑣𝐻𝐻 𝑐𝑐− 𝜆𝜆𝑃𝑃𝑣𝑣 = 0 Equation 4.10 𝜋𝜋 4𝑑𝑑𝑐𝑐2𝑃𝑃𝑑𝑑ℎ𝑐𝑐 − 𝜆𝜆𝑃𝑃𝑑𝑑 = 0 Equation 4.11
Where 𝑑𝑑𝑐𝑐 and ℎ𝑐𝑐 are the diameter and the height of the lithium ion cell. Microsoft excel
solver was used to solve this simultaneous problem which gives the value of the variables. The variables are now used to calculate the dimensions of the module as
𝑙𝑙𝑎𝑎 = 𝑑𝑑𝑑𝑑𝑐𝑐 Equation 4.12
𝑤𝑤𝑎𝑎 = 𝑃𝑃𝑑𝑑𝑐𝑐𝑁𝑁𝑎𝑎 Equation 4.13
Where 𝑙𝑙𝑎𝑎 , 𝑤𝑤𝑎𝑎 the length and width of the entire battery are pack and ℎ𝑎𝑎 is the height of the
module. The plate height and the channel height can be seen from 4.1.3.
4.1.1.2. Cell and pack characteristics
Various types of lithium ion cells were compared to decide the cell characteristics. The cells evaluated were from the official Panasonic datasheet (Panasonic). Amongst the chosen cells Panasonic NCR 18650 GA cell was used. The combination of diameter and length of the cell along with the number of cells and number of modules calculated of this cell type gave the minimum volume of the battery pack. It is assumed that the weight of cell and the nominal voltage of the cell remains the same through the timeframe. Therefore, using the data of energy density for ten-year time horizon and the weight of the cell we calculate the nominal energy of the cell by the following equation
𝑁𝑁𝑡𝑡𝑚𝑚𝑖𝑖𝑚𝑚𝐶𝐶𝑙𝑙 𝐸𝐸𝑚𝑚𝑅𝑅𝑃𝑃𝑒𝑒𝐶𝐶 = 𝑁𝑁𝑡𝑡𝑚𝑚𝑖𝑖𝑚𝑚𝐶𝐶𝑙𝑙 𝑅𝑅𝑚𝑚𝑅𝑅𝑃𝑃𝑒𝑒𝐶𝐶 𝑑𝑑𝑅𝑅𝑚𝑚𝑣𝑣𝑖𝑖𝑡𝑡𝐶𝐶 ∗ 𝑤𝑤𝑅𝑅𝑖𝑖𝑒𝑒ℎ𝑡𝑡 Equation 4.15
Further using the nominal energy and the nominal voltage we can calculate the rated capacity as
𝑅𝑅𝐶𝐶𝑡𝑡𝑅𝑅𝑑𝑑 𝑐𝑐𝐶𝐶𝑑𝑑𝐶𝐶𝑐𝑐𝑖𝑖𝑡𝑡𝐶𝐶 =𝑁𝑁𝑡𝑡𝑚𝑚𝑖𝑖𝑚𝑚𝐶𝐶𝑙𝑙 𝜌𝜌𝑡𝑡𝑙𝑙𝑡𝑡𝐶𝐶𝑒𝑒𝑅𝑅 𝑁𝑁𝑡𝑡𝑚𝑚𝑖𝑖𝑚𝑚𝐶𝐶𝑙𝑙 𝑅𝑅𝑚𝑚𝑅𝑅𝑃𝑃𝑒𝑒𝐶𝐶 Where the rated capacity is in Ah
The Table 2 shows the specific characteristics of the cell chosen
Table 2 Characteristics of NCR 18650 GA cells
Time Horizon Maximum weight (g) Rated capacity (mAh) Nominal voltage (V) Nominal energy (Wh) Nominal Energy Density (Wh/Kg) Current 48.5 3450 3.6 12.42 256.0824742 10 Year 48.5 10104,16667 3.6 36.375 750
The data of energy density for the ten-year time horizon is taken from (National Academies of Sciences, 2016), while the data of the current time horizon for the weight, cell nominal
voltage and the nominal energy is taken from (Panasonic).
Using the method described in section 4.1.1 the characteristics of battery pack are presented in Table 3.
Table 3 Battery pack data for number of cells and modules.
Time Horizon No of cells in series /module No of modules
Current 278 130
10 year 278 41
The reduction in number of required modules is due to increase in energy density for future time horizon.
4.1.1.3. Geometrical Parameter
All the modules are connected together along the width of the battery and the channels in the battery cooling plate are oriented along the length making the flow of coolant will be along the width. Based on Table 3 the effective geometrical parameters of the pack and the cooling plate are evaluated which are shown in Table 4.
Table 4 Racked Battery pack geometrical characteristics under different time horizon.
Time Horizon Current 10 year
Length(m) 0.12768 0.12768
Width(m) 9.4848 2.99136
No of sections 10 10
Height(m) 0.711 0.711
Now when the Lagrange multiplier method is applied on the battery without having rack design, meaning the battery pack only has one section and the arrangement is only along the length and width of the battery module, the dimensions are modified which can be seen from Table 5.
Table 5 Battery pack dimensioning under single section design.
Time Horizon Current 10 year
Length (m) 0.43776 0.43776
Width (m) 28.4544 8.9741
Height (m) 0.0711 0.0711
Clearly when comparing Table 4 and Table 5, the battery packs the length and the width of the battery for racked design are 1/3 of the battery single section. While the length and width are reduced the battery pack height increases for racked model over single section 10 times. Although the height increases, still this number is very small compared to the height of a Boeing 737-800, which is around 12 m.
4.1.2 DC-AC inverter and motor Sizing
The sizing and dimensioning of inverter and motor is done in a simpler way as compared to battery. A brief explanation of sizing method for each of them is described below
1. Inverter: In the case of inverter linear sizing based on state-of-art technology is done. The data for state-of-the-art technology is taken from (Silicon Carbide, 2019)
2. Motor: Since the operating power of motor is on the scale of 1 MW, it is difficult to find the dimension of motor at such scale. Hence, the dimension of the motor is taken from a study conducted by (Yoon, Yi, Martin, Chen, & Haran, 2016). The specific power and the nominal efficiency of this motor model fall in the time horizon of 20 years. Hence the dimensions are scaled to be evaluated within different time horizons. Research from studies from (National Academies of Sciences, 2016) has suggested proposed gravimetric power of power inverters and motor for potential applications in future hybrid electric aircraft. Hence knowledge of operating power and gravimetric power along with information on reference components can be used for scaling.
𝑤𝑤𝑅𝑅𝑖𝑖𝑒𝑒ℎ𝑡𝑡 =𝐺𝐺𝑐𝑐𝑎𝑎𝑐𝑐𝑖𝑖𝑎𝑎𝑚𝑚𝑡𝑡𝑐𝑐𝑖𝑖𝑐𝑐 𝑝𝑝𝑐𝑐𝑃𝑃𝑚𝑚𝑐𝑐𝑃𝑃𝑐𝑐𝑃𝑃𝑚𝑚𝑐𝑐 Equation 4.16
Applying the unitary method, we can estimate the effective dimensioning of the inverter which is
𝑑𝑑𝑖𝑖𝑚𝑚𝑅𝑅𝑚𝑚𝑣𝑣𝑖𝑖𝑡𝑡𝑚𝑚2 =𝑐𝑐𝑖𝑖𝑎𝑎𝑚𝑚𝑛𝑛𝑐𝑐𝑖𝑖𝑐𝑐𝑛𝑛 𝑃𝑃𝑚𝑚𝑖𝑖𝑣𝑣ℎ𝑡𝑡 1 1∗ 𝑤𝑤𝑅𝑅𝑖𝑖𝑒𝑒ℎ𝑡𝑡2 Equation 4.17
Where
𝑑𝑑𝑖𝑖𝑚𝑚𝑅𝑅𝑚𝑚𝑣𝑣𝑖𝑖𝑡𝑡𝑚𝑚2 is the dimension of inverter and the motor with a gravimetric power.
𝑤𝑤𝑅𝑅𝑖𝑖𝑒𝑒ℎ𝑡𝑡2 is the expected weight of the component at a time horizon.
𝑑𝑑𝑖𝑖𝑚𝑚𝑅𝑅𝑚𝑚𝑣𝑣𝑖𝑖𝑡𝑡𝑚𝑚 1 is the dimension of the state of the art inverter and motor.
4.1.3 Micro channel heat sink plate
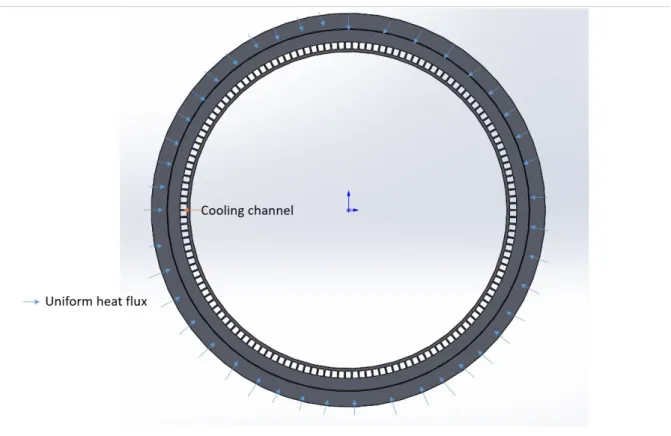
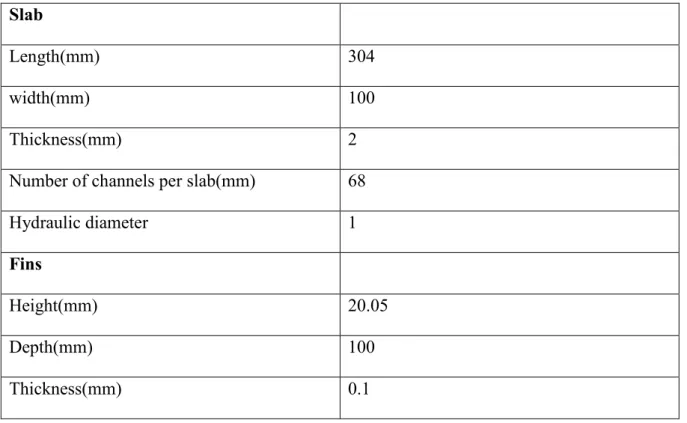
Each heat load is integrated with a micro channel heat sink plate that consists of a series of rectangular micro channels. For the battery pack and the inverter, a micro channel heat sink plate is integrated at the base in the shape of rectangular plates while for the motor the micro channel heat sink plate is of a circular shape and forms the last section of the stator. For a detailed view of micro channel heat sink plate and its assembly in the heat load look at Figure 1 and Figure 2. For the case of battery there are 10 heat sink plate corresponding to each section within the module and for the inverter there is only one plate .The specifications of the micro channel heat sink plate and channel for the electrical components are described below The Table 6 defines the channel and wall dimensions for battery and inverter
Table 6 Micro channel plate specifications for battery and inverter.
Parameter Channel Width(mm) Channel Height(mm) Distance between channel(mm) Plate thickness(mm) Value 1 1 0.5 5
The equations of geometrical parameters of the micro channel heat sink plate are described below
Battery and inverter 𝑥𝑥𝑐𝑐ℎ = 𝑓𝑓𝑐𝑐−0.51.5 Equation 4.18
𝐴𝐴𝑐𝑐ℎ = 𝑤𝑤𝑐𝑐ℎ𝐻𝐻𝑐𝑐ℎ Equation 4.19
𝑉𝑉𝑐𝑐ℎ = 𝑙𝑙𝜕𝜕𝐴𝐴𝑐𝑐ℎ𝑥𝑥𝑐𝑐ℎ Equation 4.20
𝑉𝑉𝑝𝑝= 𝑙𝑙𝜕𝜕𝑙𝑙𝑐𝑐𝑡𝑡 Equation 4.21
Here
𝑥𝑥𝑐𝑐ℎ is the number of channels within the plate cross section
𝑤𝑤𝑐𝑐ℎ, ℎ𝑐𝑐ℎ are the channel width and height respectively
𝑙𝑙𝑐𝑐 is the cross sectional length of the plate, meaning the length along which the channels are
made.
𝑙𝑙𝜕𝜕 is the flow length for the coolant
𝐴𝐴𝑐𝑐ℎ is the cross section area of the channel
Figure 1 Micro channel cold plate design for battery and inverter.
The Figure 1 shows the micro channel heat sink plate within a battery and inverter section. There are rectangular micro channels embedded at the base of the plate. The plate will be connected to the duct but the specific design of the flow is distributed from the duct to the plate is not in the scope of this study
For the motor the cooling plate is attached to the inner surface of the stator yoke. Further from the knowledge of the plate thickness as seen from the design the upper radius of the channel is calculated as
𝑃𝑃𝑐𝑐ℎ_𝑚𝑚𝑝𝑝𝑝𝑝𝑚𝑚𝑐𝑐 = 𝑃𝑃𝑝𝑝𝑖𝑖− 0.005 Equation 4.22
𝑃𝑃𝑐𝑐ℎ_𝑓𝑓𝑐𝑐𝑃𝑃𝑚𝑚𝑐𝑐 = 𝑃𝑃𝑝𝑝𝑖𝑖− ℎ𝑐𝑐ℎ Equation 4.23
Now the angle created by each channel can be calculated as 𝜃𝜃 =𝑃𝑃𝑐𝑐ℎ_𝑚𝑚𝑢𝑢𝑢𝑢𝑚𝑚𝑐𝑐
𝑐𝑐𝑐𝑐ℎ_𝑚𝑚𝑢𝑢𝑢𝑢𝑚𝑚𝑐𝑐 Equation 4.24
In case of motor the plate circumference varies from upper surface to lower. Hence a mean channel width and the mean channel radius are used.
𝑤𝑤𝑐𝑐ℎ_𝑎𝑎𝑚𝑚𝑎𝑎𝑛𝑛 = 𝜃𝜃𝑃𝑃𝑐𝑐ℎ_𝑎𝑎𝑚𝑚𝑎𝑎𝑛𝑛 Equation 4.25 Where 𝑃𝑃𝑐𝑐ℎ_𝑎𝑎𝑚𝑚𝑎𝑎𝑛𝑛 = (𝑃𝑃𝑐𝑐ℎ𝑚𝑚𝑢𝑢𝑢𝑢𝑚𝑚𝑐𝑐+𝑃𝑃𝑐𝑐ℎ_𝑓𝑓𝑐𝑐𝑃𝑃𝑚𝑚𝑐𝑐)/2 Equation 4.26 𝐶𝐶𝑖𝑖𝑃𝑃𝑐𝑐𝑁𝑁𝑚𝑚𝑓𝑓𝑅𝑅𝑃𝑃𝑅𝑅𝑚𝑚𝑐𝑐𝑅𝑅𝑎𝑎𝑚𝑚𝑎𝑎𝑛𝑛= 2𝜋𝜋𝑃𝑃𝑐𝑐ℎ_𝑎𝑎𝑚𝑚𝑎𝑎𝑛𝑛 Equation 4.27 𝑥𝑥𝑐𝑐ℎ = 𝐶𝐶𝑖𝑖𝑐𝑐𝑐𝑐𝑚𝑚𝑎𝑎𝜕𝜕𝑚𝑚𝑐𝑐𝑚𝑚𝑛𝑛𝑐𝑐𝑚𝑚𝑃𝑃 𝑚𝑚𝑚𝑚𝑡𝑡𝑐𝑐 𝑐𝑐ℎ𝑚𝑚𝑚𝑚𝑡𝑡𝑐𝑐+0.5 Equation 4.28 Where
𝑃𝑃ch_upper is the upper radius of the channel
𝑃𝑃pi is the lower radius of the plate
𝜃𝜃 is the angle of the sector formed by one channel wch_mean is the mean channel width
rch_mean is the mean channel radius
Circumferencemean is the mean channel circumference.
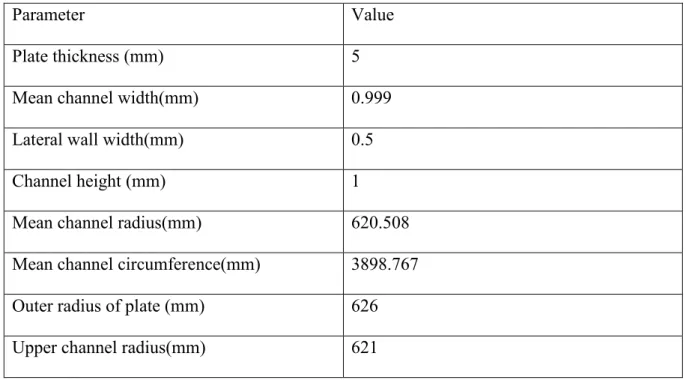
The geometrical parameters for micro channel plate for motor is shown in Table 7.
Table 7 Micro channel plate characteristics for motor.
Parameter Value
Plate thickness (mm) 5
Mean channel width(mm) 0.999
Lateral wall width(mm) 0.5
Channel height (mm) 1
Mean channel radius(mm) 620.508
Mean channel circumference(mm) 3898.767
Outer radius of plate (mm) 626
Upper channel radius(mm) 621
𝐴𝐴𝑐𝑐ℎ = 𝑤𝑤𝑐𝑐ℎ𝑚𝑚𝑚𝑚𝑡𝑡𝑐𝑐𝐻𝐻𝑐𝑐ℎ Equation 4.29
𝑉𝑉𝑐𝑐ℎ = 𝑙𝑙𝜕𝜕𝐴𝐴𝑐𝑐ℎ𝑥𝑥𝑐𝑐ℎ Equation 4.30