J
Ö N K Ö P I N GI
N T E R N A T I O N A LB
U S I N E S SS
C H O O L JÖNKÖPING UNIVERSITYM A S T E R T H E S I S
C a s h t o C a s h C y c l e w i t h a S u p p l y C h a i n P e r s p e c t i v e
Paper within International Logistics and
Supply Chain Management
Authors: Can Duman
Sawanee Sawathanon
Tutor:
Susanne Hertz
Abstract
Title: Master Thesis within Business Administration Authors: Can Duman
Sawanee Sawathanon Tutors: Susanne Hertz
Subject terms: Cash to Cash Cycle, Supply Chain Management, and Dell. _______________________________________________________________
Introduction
This research puts forth a new perspective on cash-to-cash cycle, a performance metric that relates to both finance and supply chain management. In criticism of the existing literature, which virtually views the firm as an isolate body, we look at cash to cash cy-cle optimization through a supply chain lens, in the hope of being able to formulate a more discreet approach. Our study involves a literature review followed by a case study featuring Dell Inc., the American PC manufacturer.
Purpose
This study aims to explore the ways to mitigate negative effects on the firm’s suppliers and customers when the firm sets out to reduce its C2C.
Method
This study involves a qualitative analysis that makes use of secondary data from various sources. A case study of Dell, Inc. is conducted as part of the empirical study.
Conclusion
We discuss the effects of C2C optimization by dissecting the metric into its 3 constitu-ents, whereby we are able to examine the effects of different C2C optimization methods separately. We bring up the caveats posed by these individual methods and also uncover the cases where reciprocal improvement opportunities lie. Lastly, we lay out our find-ings by proposing suggestions to deal with such effects under the defined scenarios and present future research suggestions.
Acknowledgments
We would like to extend our gratitude to Susanne Hertz and Benedikte Borgström, who oversaw our thesis writing process. Their feedback was instrumental in righting our course as we advanced. Likewise, we would like to thank our fellow-students for their suggestions and benevolent attitude.
We are indeed grateful to our families who made it possible for us to make our way to Sweden and study here.
Lastly, we consider ourselves lucky to have had access to the diverse data sources that the university library offers.
Table of Contents
1 Introduction………..…...1
1.1 Background………..………1
1.2 Problem Discussion………..……….….2
1.3 Purpose……….………...2
1.4 Significance of the Study……….……….….2
1.5 Delimitation.………...….….2
1.6 Disposition...……….………..…… 3
2 Literature Review………..4
2.1 Working Capital Management………...4
2.2 Cash to Cash Cycle ……….……….….5
2.2.1 C2C: Definition………..………..………….5
2.2.2 C2C: Computation………..……….…5
2.2.3 C2C: Interpretation……….……….…7
2.2.4 C2C: Relationship between C2C and Profitability…………....………..…...8
2.2.5 C2C: Optimization ……….………...………..8
2.2.6 C2C: A Supply Chain Lens……….9
2.2.7 C2C: Alternatives……….…..10
2.3 Financial Flows in the Supply Chain…….……….…....11
2.4 Credit Management………..12 2.5 Inventory Management……….………...13 2.5.1 Bullwhip Effect……….……….……….……15 2.5.2 Just-in-Time Approach...….……….16 2.6 Demand Management.………..………..16 2.7 Supply Management………....17
2.8 Supply Chain Relationships..……….……….18
3 Methodology……….…….….20
3.1 Qualitative Research..……….………20 3.2 Research Design……….………….20 3.3 Case study………..…..20 3.4 Measurement ………..…23 3.4.1 Internal Validity ……….……23 3.4.2 External Validity……….………23 3.4.3 Reliability……….234 Empirical Study………...………...24
4.1 Company Background (Dell) ……….….24
4.2 Dell’s Working Capital Management………..24
4.3 Dell’s C2C Performance ……….……….……….….….24
4.4 Demand Management……….………....27
4.5 Supply Management……….………...29
5 Analysis…….….……….……….……..…34
6 Conclusion………….………..………….…..…..40
7 Discussion………….………..…..43
Reference List………..………..………..45
Appendix1 ………..………..…………..…..…49
Appendix2 ………..………..………..……..50
Appendix3 ………..………..………..……..51
1. Introduction
_____________________________________________________________________
First, some background on the topic will be provided. That will be followed by a prob-lem discussion. We will then respectively lay out the purpose, significance and limita-tions of the study.
______________________________________________________________________
1.1 Background
Firms need cash to pay debts, wages, taxes and other expenses. In other words, firms need cash in order to start and maintain operations and grow. The difference between current assets and current liabilities of the firm makes up its working capital. Working capital management, as its name suggests, deals with the quantity and composition of working capital and aims to ensure that the firm is able to meet its short term obliga-tions, which include short-term debts and operational expenses.
To measure how well a firm manages its working capital, we can use a financial per-formance metric called cash to cash cycle (abbreviated as C2C and also referred to as
cash conversion cycle), which was developed by Richards and Laughlin (1980). This
metric, which basically indicates the average length of the time frame between paying suppliers and getting paid by customers, has three determinants: days payable out-standing, days of inventory and days receivable outstanding. C2C tells us the average number of days that working capital is invested in the operating cycle. More on how this metric can be interpreted will be provided in our literature review.
Firms in different industries may exhibit great differences in terms of C2C due to its multi-determinant structure. There might be high variations even among firms in a given industry. Firms that have low levels of inventory and get paid by their customers quickly have relatively low C2C; conversely, firms will end up with long C2C if their working capital is tied up in large amounts of inventory and they need to wait long to collect their receivables (Churchill & Mullins, 2001).
Existing studies have revealed a negative correlation between C2C and profitability. Unsurprisingly, many firms in various industries try to reduce their C2C. And the length
of C2C is variable over time, examples of which abound. A low value of this metric has generally been touted as being favorable and it has been
suggested that its trend over time and within-industry benchmarking may help managers better gauge their firms’ standing in terms of C2C (Anders, Farris & Hutchison, 2007). According to Farris II and Hutchison (2002), C2C is highly relevant to two perspec-tives: accounting and supply chain management. They state this as follows:
“For accounting purposes, the metric can be used to help measure liquidity and organ-izational valuation. For supply chain management activities, it serves as a measurement bridging the processes into and out of the firm….The C2C metric is an important meas-urement as it bridges across inbound material activities with suppliers, through manu-facturing operations, and the outbound logistics and sales activities with customers.”
It is the latter that will be focused on in this study, as it has remained relatively unex-plored.
1.2 Problem
Discussion
Various works in the field of corporate finance have dealt specifically with C2C; featur-ing its definition, calculation, significance, benchmarkfeatur-ing and management. Some stud-ies have linked the metric to profitability (See Skomorowsky, 1988; Deloof, 2003; Teruel & Solano, 2007). Most studies favor lowering C2C without much consideration to the supply chain. Yet, this may give rise to negative effects on the firm’s suppliers and customers. Take the case where the firm reduces its C2C by speeding up cash col-lection: Its customers will, as a direct consequence, have to pay faster. The customers’ C2C will, therefore, end up longer. If the firm extends the credit period on its payables, it will then be the suppliers’ C2C that will end up longer.
According to Jespersen and Larsen (2005), the characteristic of successful Supply Chain Management (SCM) co-operations is "fair sharing of advantages and risks". C2C re-duction without due consideration to the supply chain seems to contradict with a col-laborative effort; and C2C optimization is in need of a new lookout. Even though there are some studies that bring up cautions with respect to hasty C2C optimization, they are far from being explicit and maintain their problematic perception of the firm.
1.3 Purpose
This study aims to explore the ways to mitigate negative effects on the firm’s suppliers and customers resulting from a reduction in the firm’s C2C. This raises the following research question:when the firm sets out to lower its C2C, what should it do to mitigate possible negative effects on its suppliers and customers?
1.4 Significance of the study
A reduction in the firm’s C2C may lead to an increase in the C2C of its trading partners. This is what we refer to as a negative effect in this text. Our study will present sugges-tions on dealing with such negative effects.
1.5 Delimitation
Most firms in the service sector inherently engage in cash sales or collect their receiv-ables shortly, and typically hold little inventory or no inventory at all.
For the sake of keeping inventory management part of the discussion, this study will be centered on the manufacturing sector. We will conduct a case study on a single firm. We will confine ourselves to studying the effects on the firm’s immediate suppliers and customers, rather than all trading partners in the supply chain. And the negative effects that are considered are based on the elements of the C2C metric.
1.6 Dispositions
In the introduction, background on the research topic is provided. The points that raise the research question are brought up. Then we define the purpose and significance of the study as well as its limitations.
In the literature review, we present relevant excerpts from existing studies. The concepts of working capital management and cash to cash cycle are introduced, with the latter be-ing in a more detailed fashion. They are followed by discussions of supply chain man-agement processes that have to do with C2C. All of these will serve to support our analysis.
In the next section we elaborate on the methodology that we follow. Research design, case study approach, method of data collection and measurement methods of qualitative research are provided in this section.
A case study that features a firm with excellent performance in terms of C2C constitutes our empirical study. This section starts with the company background, its working capi-tal management and C2C performance. We then examine the company’s demand man-agement, supply management and inventory management.
In the analysis part, we link the information we extract from the case study back to the relevant parts in our literature review. This is where our findings begin to take shape. We present our findings in the conclusion part. To be precise, we propose C2C reduc-tion scenarios, the corresponding effects on suppliers and customers and provide sug-gestions on how to mitigate the negative ones.
2. Literature review
______________________________________________________________________
This study revolves around C2C. Accordingly, our literature review will start with a discussion of working capital management. We will then present a detailed treatment of C2C, including its relationship with profitability. In the remainder of this section, we will talk about financial flows in the supply chain, supply chain relationships and the processes of demand management, supply management and inventory management. ______________________________________________________________________
2.1 Working
Capital
Management
The amount by which the firm’s current assets exceed its current liabilities constitutes its working capital, or net working capital, as it is sometimes referred to as.
Working Capital = Current Assets – Current Liabilities
Current assets include cash, accounts receivable, inventory, marketable securities and prepaid expenses; whereas current liabilities comprise short term debt, accounts pay-able, accrued liabilities and other debts. The current characterization of assets and li-abilities implies that it is within a short duration (1 year, strictly speaking) that they can be converted to cash and they have to be covered, respectively. This definition will make it easier to understand the relevance of C2C to working capital management. According to Gardner, the chief interpretation of working capital is that it determines a firm’s ability to meet its short-term obligations using current assets as opposed to bor-rowed capital (Gardner, 2004). Financial & Investment Dictionary states the function of working capital thus:
“Working capital finances the cash to cash cycle of a business.”
For the time being, cash to cash cycle can be thought of as the time during which
in-come generated by operations is yet to be collected in cash. Obviously, deficiency in working capital is not desirable, as it implies that the firm will
have recourse to outside capital. And too much of it is not good, either: excessive value tied up in current assets may mean that the firm is making sub-optimal use of its re-sources. So, a working capital of zero appears to be optimal, but it is the study of its composition along with its amount that will reveal whether working capital is at an op-timal level, or not. This is where liquidity comes into the picture (Gardner, 2004). Li-quidity of an asset is how quickly it can be converted to cash. The more quickly an asset can be converted to cash, the more liquid it is deemed. Cash, therefore, is the most liq-uid asset of all. Inventory and accounts receivable have varying degrees of liqliq-uidity de-pending on their turnover rate and age, respectively.
A firm may suffer from low liquidity even though it may have positive working capital and consequently may have a hard time covering its liabilities. Too liquid a current asset structure may signal danger as well, in that inventories may be too low to meet demand, causing service levels to suffer.
In evaluating working capital position of a firm, these two facets, namely liquidity and utilization, are of primary importance (Gardner, 2004).
There are a variety of working capital management performance metrics. Five of the most frequently employed ones are the following: the current ratio, the quick ratio, in-ventory turnover, accounts payable turnover and accounts receivable turnover. Each of these metrics reveals a different aspect about working capital position. The last three di-rectly relate to C2C, as will be shown later.
On an interesting note, Investopedia refers to working capital management as a
mana-gerial accounting strategy.
2.2 Cash to Cash Cycle
2.2.1 C2C: Definition
Numerous definitions of cash to cash cycle (which is synonymous with cash conversion
cycle) have been provided in earlier studies. Steward (1995) features the following: “C2C is a composite metric describing the average days required to turn a dollar in-vested in raw material into a dollar collected from a customer.”
Moss and Stine (1993) define C2C as “days between accounts payable and accounts
receivable”. Gallinger (1997) puts it somewhat differently: “The cash conversion cycle measures the number of days the firm’s operating cycle requires costly financing to support it” Operating cycle, Gallinger notes, can be thought of as the number of days of
sales are invested in inventories and receivables. Although definitions vary, the concept is clear. To sum up, cash to cash cycle is a company-specific performance metric indi-cating the average length of the time frame between paying suppliers and getting paid by customers. What makes C2C particularly intuitive is that it is expressed in days.
2.2.2 C2C: Computation
C2C has three determinants: DOI, DRO and DPO, which respectively stand for days of inventory, days receivable outstanding and days payable outstanding.
C2C = DOI + DRO - DPO
In what follows, details about each of these parameters will be provided.
Days of Inventory (DOI) = 365 / Yearly Inventory Turnover = Average Inventory /
(COGS/365)
DOI is computed by dividing the number of days in a year by yearly inventory turnover. Days of inventory, therefore, is directly linked to inventory turnover, which is how many times a company turns over its inventory in a given time frame. Inventory turn-over is computed by dividing the total cost of goods sold by the average inventory that the company keeps during the time frame in question. In other words, inventory
turn-over tells us how many times a company completes a full cycle of producing a product and selling it - and not necessarily getting paid in cash - during a given time frame. However, inventory turnover is a tricky metric as its numerator and its denominator may be correlated (Gardner, 2004). A company may seem to be doing well in terms of inventory turnover, that is, it may have a high inventory turnover, but it may concur-rently be losing sales. Ruling out lost sales, though, it can safely be argued that the higher a company’s inventory turnover, the better it is.
To sum up, DOI is the length of the average time frame that elapses from the purchase of materials from suppliers to the sale of corresponding items to customers. As this met-ric is added up in the calculation of C2C, it may intuitively be said that the lower it is, the better it is for the firm. Trimming inventory will bring about a lower DOI; yet too low a DOI may mean that the firm is compromising its service levels.
Days Receivable Outstanding (DRO) = 365 / Yearly Accounts Receivable Turnover =
Average Accounts Receivable / (Net Sales/365)
DRO is computed by dividing the number of days in a year by yearly accounts receiv-able turnover. For that reason, DRO relates directly to accounts receivreceiv-able turnover. Accounts receivable turnover is calculated through dividing net sales by average ac-counts receivable in a given time frame. It reveals how many times customers are in-voiced and the payments received from them are recorded on the income statement dur-ing the time frame in question.
In simple terms, DRO is the average number of days that elapse from the issuance of a bill to a customer up to the collection of the corresponding cash from that customer. Firms, naturally, would like to be paid on the spot for their products/services. And some do: retailers typically collect their payments quickly and hence have hardly any out-standing receivables. They are, thereby, at an advantage in terms of this metric. And some firms get paid before selling the relevant product or rendering the relevant service, which is by all means a desirable situation to be in. But this may not be feasible for every single firm and its feasibility hinges on industry characteristics (Farris II & Hutchison, 2003).
Days Payable Outstanding (DPO) = 365 / Yearly Accounts Payable Turnover =
Aver-age Accounts Payable / (COGS/365)
DPO is computed by dividing the number of days in a year by yearly accounts payable turnover. Thus, it has a direct linkage to accounts payable turnover, which is calculated through dividing cost of goods sold by average accounts payable in a given time frame. It measures how many times a full cycle of being billed by suppliers and making the corresponding payments to those suppliers is completed in a given time frame. A low value may mean suppliers are being sweated, whereas a high value may signify that the firm is paying its suppliers too early, which suggests that the firm is suffering from power issues in its supply chain. It may be elusive to determine what makes an optimal value when it comes to accounts payable turnover, as payment ability is highly
firm-specific and payment speed, in some cases, is dependent on firm policy (Gardner, 2004).
DPO, in rather simple terms, is the average number of days that elapse from the pur-chase of materials up to making the relevant payment in cash. It is the only component that assumes a minus sign in the calculation of C2C metric. Thus, one can intuitively argue that the higher it is, the better it is for the firm. That is, for the purpose of C2C re-duction, increasing DPO is a legitimate thing to do.
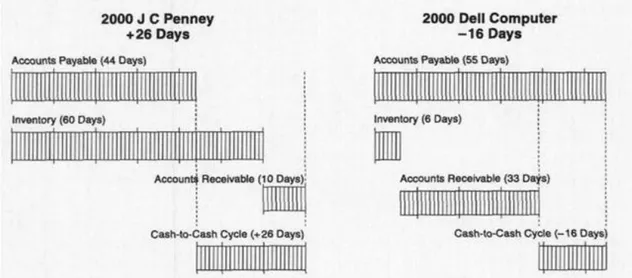
The three metrics that make up C2C metric are all expressed in days, which makes them more intuitive than their turnover counterparts. They can, for that reason, be said to make for an easier analysis. There are other methods that can be used to compute C2C; yet they might require more detailed data. For instance, average values in the formulae may be replaced by median values (Anders et al., 2007). Although this method may yield a more accurate picture, it is more convenient to adhere to the averages, since they only require commonplace financial statement data. An illustration of cash to cash cycle is presented below, with the one on the left having a positive value and the one on the right having a negative value.
Figure 2.2.1 J.C. Penny’s positive C2C vs. Dell’s negative C2C (Farris & Hutchison, 2002).
2.2.3 C2C: Interpretation
C2C may assume both positive and negative values, although the latter is less common. A positive value indicates the length of the time that cash remains tied up in inventory and receivables until receiving payment from customers (Churchill & Mullins, 2001). A negative number may arise from either of the following reasons or a combination thereof:
- The firm is quick to collect its payments (low DRO). - The firm turns over its inventory frequently (low DOI). - It takes long before the firm pays its suppliers (high DPO).
A low C2C suggests that the company is efficient in managing its cash flows, because it turns over its working capital more frequently (Anders et al., 2007). A low C2C may also be an indicator of lean capital operating, but that depends on whether it is attribut-able to lean practices (Bierley, 2008).
2.2.4 Relationship between C2C and Profitability
Apart from the obvious benefits, may C2C be working in an indirect fashion and
affect-ing other aspects of a business than its ability to meet its short term obligations? In one of the early studies looking into the relationship between C2C and profitability,
Skomorowsky (1988) suggests viewing cash as a driver of profits rather than a mere tool to meet short-term obligations. Skomorowsky (1988) goes on to argue that cash flows from previous transactions enable the company to move on to the next transaction that will generate further profits. That is, the lack of cash translates to squandered prof-itability.
Deloof (2003) reveals a negative correlation between C2C and gross operating income, thereby reaffirming the findings of Shin and Soenen (1998), who look into the case of a set of American firms. Garcia-Teruel and Martinez-Solano (2003), based on a large sample of Spanish SMEs, conclude a negative correlation between profitability and C2C, which they deem robust. Then they suggest that working capital management in general and C2C minimization in particular be viewed as sources of value creation. Far-ris, Hasty and Hutchison (2005) refute this link in the case of service and manufacturing firms; yet consider continuous C2C improvement essential to maintaining competitive advantage.
In one of the early quantitative studies, Jose, Lancaster and Stevens (1996) employ two different metrics, namely ROA and ROE, as measures of profitability. They conclude that there is a significant negative correlation between profitability and C2C, and that this relationship is independent of firm size and valid across natural resources,
manufac-turing, services, retail/wholesale and professional services industries. Although there are exceptions, these studies seem to justify C2C reduction with their findings.
2.2.5 C2C: Optimization
Existing body of literature on working capital management generally recommends C2C reduction, which is plausible given that accounting perspectives prevail (Anders et al., 2007; Mullins & Churchill, 2004; Farris II & Hutchison, 2002).
The reasons behind this stance may be various: For instance, companies looking to grow are advised to revisit internal sources, in an effort to uncover avenues where they can free up cash to finance their growth and relieve themselves of the need for soliciting outside investors (Bhide, 2000). Self-financing requires a company to fasten its cash flows. Cash, after all, is the lifeblood of any business organization, certainly even more so in the case a growing company. The relationship of C2C with profitability, which we elaborated on in the previous section, constitutes another justification for reduction.
From the formula provided, it follows that there are three different ways to reduce C2C: - Getting customers to pay faster, which translates to lower DRO.
- Improving inventory turnover, thereby decreasing DOI. - Delaying payments, thereby increasing DPO.
Farris II and Hutchison (2002) elaborate on how to go about doing these: • Reduce average accounts receivable by:
- Following up quickly on delinquent accounts - Assessing interest on delinquent accounts
- Requiring cash on delivery payments for future orders from delinquent customers
- Allowing for automatic deposit of payments
• Shorten production cycle to reduce inventory days of supply by:
- Reducing bad overage inventory, through adopting strategies such as just-in- time delivery, real time inventory tracking, Collaborative Planning Forecasting
and Replenishment (CPFR)
- Synchronizing supply/demand planning
- Cross-docking of material at warehouse locations. • Extend average accounts payable by:
- Paying at the last possible minute or date
- Making partial rather than full payments to vendors - Reducing frequency of payment
- Utilizing interest-free credit cards.
Majority of these suggestions - with the exceptions being listed under “shorten
produc-tion cycle to reduce inventory days of supply” - will increase the C2C of trading
part-ners because they involve shortening customers’ credit period, delaying payments to suppliers, and possibly pushing inventory to upstream or downstream.
2.2.6 C2C: A Supply Chain Lens
Elements of C2C relate to suppliers and customers (DPO and DRO directly, whereas DOI in a roundabout fashion), which entails a closer look into the individual component rather than a binary evaluation of the overall value of the metric.
Figure 2.2.6 The Extended Value Stream and the Cash to Cash Cycle (Bierley, 2008).
Although a low C2C may stem from good management principles, the question of whether it constitutes an end per se remains due to the possible side effects that it may bring about. It is the separate study of the three underlying components that will reveal the possible effects of C2C optimization. Gardner (2004) provides a breakdown of the metric, and talks about ways to optimize each component from a purely arithmetic per-spective. Walker (2005) endorses C2C minimization on the basis of the velocity
princi-ple and goes on to suggest that steps making up the C2C are identified and dealt with
individually. The same author subsequently lays out an extensive list of what can be done with the freed-up cash to justify that. The questions of what kind of implications this may have for supply chain partners, and probably more important, whether a col-laborative effort may improve the C2C standing of all those involved, though, have re-mained unanswered.
C2C reduction, which in some cases results in negative values, dictates caution in that it may bear down on trading partners, whether it is by pressing customers to pay earlier than they can afford to, delaying payments to financially weak suppliers or trimming inventories typically at the expense of upstream actors. Concerning the last one, it is important to make sure that reductions in DOI are emergent from lean practices, rather than discount-driven sales, phantom sales or having upstream actors keep excess inven-tories and bear the burden of the waste in the chain.
According to Hutchison and Farris II (2003), firms should use C2C to examine overall financial flows in the supply chain, not to evaluate merely their own firm performance, because such individualistic attitudes may undermine the supply chain.
We have pointed out some pitfalls in using C2C. In the next section, we will introduce two alternative metrics, and provide comparisons with C2C.
2.2.7 C2C: Alternatives
Walker (2005) suggests the use of network C2C. This approach involves thinking of the network as a single body and computing C2C for it. Although this approach adopts a network perspective and it can be deemed original in that sense, it fails to preclude im-balances among the actors involved.
Operating cycle is another metric that may constitute a substitute for C2C, and it ap-pears to be more innocuous than C2C in that it removes DPO from consideration, but for that very reason it fails to give an accurate picture of cash flows. C2C, in this sense, is more relevant than operating cycle (Gardner, 2004). Hence, for purposes of investi-gating cash flows, C2C can be deemed to be more fitting.
2.3 Financial Flows in the Supply Chain
In order to illustrate how relevant financial flows to the supply chain are, we shall start off with the supply chain definition by Mentzer (2000):
“Supply chain is a set of three or more companies directly linked by one or more of the upstream and downstream flows of product/services, finances, and information from a source to a customer.”
Coyle, Bardi and Langley (2003) provide the following definition, which is similar to that of Mentzer (2000):
“Supply chain is the physical, financial and information networks that involve the
movement of materials, funds, and relate information through the full logistics process, from the acquisition of raw materials to the delivery of finished products to end user.”
Among the three flows featured in the definitions above, financial flows is arguably the one that has drawn the least attention. For instance, Jespersen and Skjøtt-Larsen, in a work that can be considered to be recent, rule out financial flows in their discussion of supply chains:
“The supply chain encompasses all organizations and activities associated with the flow
and transformation of goods from the raw materials stage, through to the end user, as well as the associated information flows. Material and information flow both up and down the chain.” (Jespersen and Skjøtt-Larsen, 2005)
While much has been said on the importance of physical and informational flows in the supply chain, advice on streamlining financial flows seems to be relatively limited. Yet, the fact that 4 percent of cost of goods sold on the average is accounted for by financing - a figure that in some cases surpasses logistics and transportation costs - reveals the importance of financial flows in supply chains (Kerr, 2006). Another aspect that makes financial flows in supply chains worth looking into is that they have become the new avenue where opportunistic behavior set in, following the fairly old tradition of pushing inventory downstream and upstream. As Beth Enslow, senior vice president and supply chain practice leader at Aberdeen Group puts it:
“In a tiresome replay of the "pass the parcel" games once played with inventory, the cost of capital has become the new parcel.” (cited in Kerr, 2006)
Enslow also argues that like inventory, financing costs “are simply transferred, not
re-moved from the supply chain” (cited in Kerr, 2006) and moves on to quote a
practitio-ner: “Those buyers are not considering that if they actually helped the supplier reduce
The fact that financing costs are merely passed on within the chain has the straightfor-ward implication that the end customer will end up incurring these costs, which will have an adverse effect on the competitiveness of the entire chain. That can be said to be antagonistic to supply chain management, if we are to adopt the following definition:
“The management of upstream and downstream relationships with suppliers and cus-tomers to deliver superior customer value at less cost to the supply chain as a whole”
(Christopher, 2005)
And, granted, some chain members, typically the ones who have less power as opposed to the other chain members, will bear more of the resultant burden, as the financing costs will converge in their operations. That can, by all means, be characterized as
“in-efficiency” in the supply chain. Given the increase in the length of supply chains, there
can be said to be more room for such inefficiencies.
2.4 Credit Management
Credit and collections are widely considered problematic business issues (Harrison, 1993). Yet almost all businesses extend credit. Harrison, in her work devoted to credit and collection systems, suggests that extending credit be seen as an opportunity as well as a necessity (Harrison, 1993). In addition to these, credits may be seen as a manifesta-tion of trust.
We have noted that extending credit is a necessity. In certain cases it may make sense to be liberal in terms of the period of these credits. These include cases where inventory levels are traditionally high, competition is fierce and profit margins are high enough to justify the long credit period (Harrison, 1993).
And firms’ involvement with credit is not confined to the cases where they are the creditor, there is the flip side of this scenario: firms make credit purchases themselves. When one thinks of the number of dyadic relationships in a supply chain, it is clear that there may exist many credit relationships. Streamlining these relationships has naturally received attention. Good credit management, Michael Hugos notes, can be likened to good inventory management; in cases where the firm extends credit, it helps tie up less cash in receivables, which is the analogue of inventory in credit management (Hugos, 2003).
In setting receivables and payables to rights, supply chain management principles may come in handy:
It is natural that credit terms vary across customers. As Mentzer (2004) puts it, “not all
customer are created equal”. Those that bear importance to the firm ideally enjoy more
favorable credit terms, which is reasonable considering the basic implication of the term “credit” – crediting the customer with the ability to pay. A firm that chronically has trouble covering its obligations would fail to be strategically important to its trading partners in the first place.
Mentzer, in the same work, suggests looking for synergies and engaging in collabora-tive relationships. He cites “sharing benefits”, “trust” and “helping each other” among others as enablers of collaboration whereas “limited view of the entire supply chain” and “doing things the old way” are two of the impediments to it (Mentzer, 2004). Mentzer exemplifies the “doing things the old way” by conventional accounting prac-tices and suggests that accountants should determine the value of dealing with other firms and protect the company against a partner passing cost on to them. Similarly, un-derstanding total system costs, Mentzer argues, is essential, and the lack thereof indi-cates a “limited view of the entire chain”, which, as noted earlier, acts an impediment to collaboration.
Finding a reasonable approach to making payments and receiving timely payments mat-ters to the well-being of the firm (Harrison, 1993). And, in a Supply Chain Management (SCM) context, value creation for the end customer can take place at many points along the chain, and one way to achieve value creation is by making individual supply chain actors more cost-effective (Mentzer, 2004). SCM, with its guiding principles relating to relationships, holds promise with regard to the establishment of more reasonable credit and collection systems.
Getting back to “helping each other”, one of Mentzer’s enablers of collaboration, we will talk a bit about supply chain finance (SCF), an area of promise in streamlining fi-nancial flows in the supply chain. There are examples of large buyers helping their sup-pliers access cheap credit: Jenkins and Sutton (2007) bring up the case of Votorantim Celulose e Papel, a paper and pulp manufacturer in Brazil, working with ABN AMRO Real to fund small farmers growing eucalyptus, which goes into the making of pulp. A similar case presented in the same work is that of Cargill, who is helping barley growers via ICICI Bank. The barley produced by these farmers is processed into malt by Cargill, to be then shipped to SABMiller, a major brewer.
Kerr (2006) praises the emerging SCF solutions and argues that they help reduce cost of capital for individual actors, thereby increasing the competitiveness of the chain. We will, in the rest of our literature review, talk about the processes of inventory man-agement, demand manman-agement, supply management and lastly supply chain relation-ships. These will provide us with the framework to understand the implications of C2C reduction on the supply chain.
2.5 Inventory
Management
We will insert a lengthy discussion of inventory management here, and it will provide the foundation for our analysis of days of inventory. We will start this section with a formal definition of inventory by APICS, The Association for Operations Management:
“Those stocks or items used to support production (raw materials and work-in-process items), supporting activities (maintenance, repair, and operating supplies), and cus-tomer service (finished goods and spare parts).”
Investment Dictionary provides the following definition:
“The raw materials, work-in-process goods and completely finished goods that are con-sidered to be the portion of a business's assets that are ready or will be ready for sell-ing.”
One thing to note early on is that it is safe to treat inventory as synonymous with stock. Inventory has a number of attributes, which - when extensively laid out - may help us better comprehend what purpose it serves and why there is an entire field dedicated to the study of it. Howard and Lancioni (1978) list the following set of attributes that they think are essential to understanding inventory: type, function, demand, lead time, cost and item importance.
Type: There are, as is common knowledge, three types of inventory: raw materials,
work-in-process, finished goods. Different inventory management approaches propose different treatments of each. Just-in-time inventory management, for instance, is par-ticularly intended to reduce work-in-process inventory (Peterson, Pyke & Silver, 1998).
Function: Inventory, in taking the three forms noted above, serves as working stock,
safety stock, anticipation stock and pipeline stock.
Demand: Demand, in this case, means the requirement for a particular item over a
defi-nite time frame (Howard, 1984). Howard (1984) brings up a misconception and sug-gests that demand be distinguished from sales and usage, which don't necessarily amount to it.
Lead time: Lead time is the length of the time that elapses from order placement on to
delivery. Magnitude as well as variability of lead time are of importance as they relate to when to order and how much to hold in stock at any given time.
Cost: Quantitative studies of inventory take cost as their bases. Inventory poses three
types of cost: ordering cost, carrying cost and stock-out cost.
- Ordering cost (analogous to set-up cost) results from issuing a purchase requisi-tion, preparing the necessary paperwork to submit an order, processing of an or-der or from issuing a manufacturing requisition, carrying out the necessary plan-ning and scheduling, setting up the machine and other one-off expenses in cases where the item is to be manufactured.
- Carrying cost (also referred to as holding cost) comes in the form of capital cost, storage expenses, insurance payments, taxes levied on inventories, costs associ-ated with shrinkage. Carrying cost, on an important note, can be said to be the one that is the most relevant in a working capital management context.
- Stock-out cost encompasses all costs that are incurred when an item is out of stock.
Item importance: In this context, it is typically the financial value of the item that
classifi-cation have overgeneralizing aspects to them, they are deemed to hold good for the
most part.
The theory of the firm, which is aimed at explaining the raison d'etre of firms, may guide us in understanding the purpose of inventory management. Regardless of whether the firm is driven by profit maximization, sales maximization or some sort of satis-ficing, it seeks to keep inventories just high enough so as not to pass up sales and low enough not to incur unnecessary carrying costs. Inventory management can be said to boil down to managing this tradeoff, which concurrently serves the various purposes proposed in the theory of the firm.
2.5.1 Bullwhip Effect
“A phenomenon that is relevant in the current discussion is the bullwhip effect, which is
also termed supply chain rollercoaster effect or supply chain nervousness” (Crum &
Ireland, 2005). This phenomenon relates to the days of inventory metric that has been introduced earlier.
So, how does the bullwhip effect manifest itself? For reasons that will be laid out shortly, the variability in demand that upstream actors in the chain face is greater than that faced by those downstream. That is to say, the further away from the end-customer a supply chain actor is, the less accurate its demand information will be, if the bullwhip effect is at play. See the following illustration.
. Figure 2.5.1 The Bullwhip Effect (Trump University, 2009).
Hugos (2003) cites five reasons for this phenomenon:
- Demand Forecasting: Forecasting may yield an inaccurate picture if it is based on
or-ders rather than end-user demand.
- Order Batching: Due to order batching, the amount of orders diverges from the actual
demand, and this divergence grows further upstream in the chain.
- Product Rationing: Rationing is what firms resort to in the event of a shortage. In order
that are larger than usual, in view of the fact that the available supply will be allocated proportionally to the size of their orders. That creates a misrepresentation of the actual need.
- Product Pricing: Changes in price may lead customers to buy less or more than they
normally would.
- Performance Incentives: In an effort to meet preset performance targets, managers may
be urged to push the available supply to customers, while there is no actual demand for the relevant product.
Bullwhip effect, whether it be caused by any of the individual factors above or an inter-play of them, has been empirically proven to be real (Peterson et al., 1998). Deviations from the actual demand basically result in either shortages or overages, none of which are favorable circumstances for the chain. Overages mean higher days of inventory, which deteriorates the working capital position of the firm. And shortages lead to lost sales. In either case, the implications bear upon the rest of entire chain as well. How-ever, this is not bound to be the case for all supply chains. Preclusive actions are avail-able. And they basically involve information sharing. Crum and Ireland (2005) argue that this is why “supply chain collaboration makes plain old commonsense”
2.5.2 Just-in-Time Inventory Management
JIT philosophy emerged in Japan and spread to the rest of the world. It basically in-volves sourcing parts right before they are needed on the assembly line (Peterson et al., 1998). JIT inventory management brings about reductions in all three types of inven-tory, although it is particularly intended to reduce work-in-process inventory (Peterson et al., 1998).
JIT systems depend on high quality components and capable logistics systems to attain small lot sizes and short lead times (Coyle et al., 2003).
Atkinson (2005b) points out the pitfalls in implementing JIT inventory management. There are, for instance, risks associated with heavy reliance on particular suppliers. Should there happen to be an interruption in the supply of a certain item, production comes to a halt as the firm holds either minimal or no buffer stock.
2.6 Demand
Management
Larry Lapide, Research Director at MIT’s Center for Transportation & Logistics, de-fines demand management as “matching of supply and demand over time” (Lapide, 2006).
The goals of demand management are to gather and analyze information about custom-ers’ needs and problems, move the functions to the channel member performing effec-tively and share logistical information with supply chain members (Coyle et al., 2003).
Demand management involves long-term, medium-term, short-term and real-time plan-ning processes (Lapide, 2006). These include updating the product, brand, marketing and sales plans (Crum, 2003).
According to the American Production and Inventory Control Society, the definition of demand forecast is “estimate of future demand” (Crum, 2003). Demand forecasting plays an important role in shaping demand plans and customer service activities such as establishing customer segments and matching service programs to those segments. The traditional supply chains incur distortion in demand information because only the firm facing the end-customer enjoys visibility of demand while other supply chain members merely receive orders from their immediate customer (Jones & Towill, 1997). PC industry used to constitute an example of this: There was chronical misalignment between demand and supply, that is, differences among actual end-user demand, pro-duction volumes and channel orders (Coyle et al., 2003). Right after a product was launched, demand for it would peak and production volumes wouldn’t suffice to meet the whole demand due to unstable production processes. Consequently, product short-ages would come about. In the wake of this, distributors and resellers would start accu-mulating the product, in an effort to preclude stock-outs. And later on, when demand dropped, these actors would end up with excessive stocks.
Towill (1996) suggests that all members within the supply chain should seamlessly work together to minimize delay and distortion of demand information (cited in Jones & Towill, 1997). Likewise, Crum (2003) states that demand collaboration can preclude the bullwhip effect and views “substituting demand information for inventory” as essential. Demand collaboration involves sharing demand information throughout the chain, so that each trading partner knows the rate of the actual demand, resulting in reduced un-certainty (Jones & Towill, 1997).
Gunasekaran and Ngai (2005) point out that build-to-order systems reduce inventory levels and production costs (cited in Gunasekaran & Ngai, 2008). They cite the PC in-dustry as an example, where build-to-order systems allowed firms to be more respon-sive and cost-effective.
Price/quality ratio and customization can be seen as aspects of customer service (Coyle et al., 2003). Lead time is also one of the factors considered in developing customer service policy and performance measurement standards (Coyle et al., 2003).
2.7 Supply
Management
This section will start with the definitions of the concepts of procurement and supply. Procurement is “the act of purchasing the goods and services” or it may be defined
rather broadly as “the process of obtaining goods and services for the firm” (Coyle et al., 2003). Effective procurement can beget competitive advantage (Coyle et al., 2003). According to Harland, Lamming and Cousins (1999), the concept of supply are “the
purchasing, use, and transformation of the resources to provide goods or service pack-ages to satisfy end customers today and in the future”.
There is a trend to work with fewer suppliers by forging closer relationships with them and in some cases taking those relationships to alliance level (Harland et al., 1999; Coyle et al., 2003). Firms, in doing so, seek to ensure the proper quantity and quality of supply (Harland et al., 1999).
Manufacturing companies view sourcing decisions as strategically important. The tradi-tional “make or buy?” analysis is resulting in more “buy” than before, which elevates the importance of sourcing (Harland et al., 1999).
Hong and Holweg (n.d.) provide the following description of global sourcing:
“Products are made with parts sourced from abroad as part of a global procurement strategy to satisfy local demand or foreign demand.”
Fawcett and Birou (1992) mention that global sourcing often involves transportation over large distances and in large batches whereas just-in-time systems dictate frequent deliveries of small shipments (cited in Hong & Holweg, n.d.). Vickery (1989) studies the practices of three US companies aimed at reconciling JIT requirements with those of global sourcing and proposes the key success factors for global JIT sourcing (cited in Hong & Holweg, n.d.):
- Improved logistical planning, production planning and scheduling by the buyer
- Establishment of effective buyer-seller communication links with consid-eration to time zone differences
- The development of long term buyer-seller relationships with consequent logistical advantages
- Expeditious clearance and movement through customs.
2.8 Supply Chain Relationships
In this section, we will present a model that describes supplier-buyer relationships in
order to illustrate how firms in the supply chain interact with one another. Supplier-buyer relationships can be characterized by a continuum, the extremes of
which are transactional and collaborative relationship (Whipple et al., 2009).
Transactional relationship is marked by low interdependence and antagonism between parties as well relative insignificance of the tasks and functions involved. Hoyt and Huq (2000) characterize transactional relationships by opportunistic behavior in the absence of preclusive governance mechanisms. There is no reason for a buyer to stay in the rela-tionship if another supplier comes along with a better offering. If the governance mechanism in place dictates otherwise, then firms involved will end up less responsive,
because there will typically be no compromises from either side, leading to mutual loss. Arm's length contracting closely fits the transactional relationship paradigm, and it is
marked by the repetition of the transaction. Interests of the parties involved are typically conflicting, though.
The other extreme of this continuum, i.e. collaborative relationship, is characterized by mutuality, lastingness and interdependence. There is, in addition to the economic ele-ment which is present in transactional relationships as well, a social eleele-ment to collabo-rative relationships. In collabocollabo-rative relationships, information sharing is typical, as is changing business practices for the sake of the relationship. These two are especially reminiscent of the alliance definition by Whipple and Frankel (2000):
“A long term relationship where participants cooperate and willingly modify their busi-ness practices to improve joint performance”
Wagner (1987) brings up the following outcomes of collaborative relationships: - Seller enjoys orders of higher volumes.
- Seller develops a greater understanding of the buyer and is able to cater to its special needs in terms quality, cost etc.
- There are more exchanges in terms of sensitive information.
- There is recognition of dependence and consideration for mutual benefit. For example, if the buyer faces problems out of the seller’s mistake, the seller may take responsibility.
Although more and more relationships are evolving towards collaborative relationships - i.e. shifting away from the transactional paradigm - and it may thus be luring to think of collaborative relationships as superior, whether collaborative relationships lead to more favorable outcomes than those with a transactional nature is a research question per se and Whipple et al. (2009) seek to answer this particular question. Hoyt and Huq (2000) argue that long term relationships based on trust make for sustainable competi-tive advantage, by helping garner resources that give firms an edge. Many companies, though, choose to maintain antagonistic relationships with their supply chain partners and keep making use of bid-buy methods, for reasons that may be justified or not. Hoyt and Huq (2000) also bring up the essential role information plays in initiating collabora-tion and keeping it up. They state that tradicollabora-tional demarcacollabora-tions between firms are a hin-drance to trust, and thereby a lasting relationship (Hoyt & Huq, 2000).
3. Methodology
______________________________________________________________________
In this section, the methodology to be used in the empirical study as well as its criticism will be provided.
______________________________________________________________________
3.1 Qualitative
Research
Creswell (2003) has suggested that the choice of the methodology should be based on the nature of the research topic (cited in Quinton & Smallbone, 2006). Qualitative analysis can be considered an appropriate way for the purposes at hand. Qualitative analyses provide detail, process, richness and sensitivity to context. According to Tharenou, Donohue and Cooper (2007), qualitative analyses are appropriate if the aim is to build theoretical explanations.
3.2 Research
Design
This research concerns two fields of study, namely working capital management and supply chain management. In the literature review, we presented a detailed treatment of the C2C metric under study and relevant supply chain management processes.
We will conduct a case study and explore how a firm with a negative C2C implements the processes of demand management, supply management and inventory management. We have selected a firm that is doing remarkably well in terms of C2C, and we will ex-amine its practices which bring about a negative C2C position and how they bear on its trading partners. We will also talk about the rationale behind our selection.
Following the case study, we will provide a critique of the business practices of the firm in question based on the literature review and the empirical study. We will then present the results of our study.
3.3 Case
study
A case study is an in-depth empirical investigation of a single instance to explain the processes of a phenomenon in context (Tharenou et. al., 2007). Hartley (1994) has out-lined the following eight steps involved in conducting a case study (cited in Tharenou et al., 2007):
1. Choose the case study organization
As part of the empirical study, Dell Inc. is selected as the case study organization to un-derstand how C2C reduction can be achieved while maintaining close relationships with suppliers and customers.
We look into how Dell implements the processes of demand management, supplier management, and inventory management.
There are two reasons that led us to select Dell: Firstly, Dell has been able to reduce its C2C while maintaining close relationships with its suppliers and customers. Secondly, various sources of information such as books, interviews, articles, case studies, and
cor-porate documentation concerning the company are available. That is, there is no short-age of secondary data. AMR Research (2008) has released a ranking of its “Supply Chain Top 25” companies with respect to C2C (See Appendix1).
Dell is one of the 4 companies that have a negative C2C and second to only Apple Computer among the “Supply Chain Top 25” companies.
2. Gain and maintain access
Surveys rely greatly on respondents and require large samples to generate reliable re-sults. Interviewing, too, may not be the right way to go, since the research question has to do with corporate strategy. Firms might be reluctant to reveal their opinions on the is-sue. Therefore the authors will not employ primary data from survey and/or interview in this research.
According to Calantone and Vickery (2009), there are significant advantages of using archival and secondary data sources in supply chain management research. Secondary data sourced from archives are generally more objective than survey data since they are free from contamination by respondent perceptions and bias on the part of the re-searcher. We utilize secondary data which can be accessed via Jonkoping University’s Library.
3. Choose an initial theoretical framework
In the previous section, we conducted a literature review, which constitutes the frame-work of our study. We employed the following keywords: “cash to cash cycle”, “frame-work- “work-ing capital management” and “supply chain management”. The authors have compared similar and contrasting points of view on each topic. The empirical study will be carried out based on the structure adopted in the literature review, which will facilitate figuring out what kind of information is needed.
4. Collect systematic data
The empirical study will be conducted following the structure provided in the literature review. We will access various databases via Jonkoping University Library, namely ABI/Inform for scientific journals, Business Source Premier for company information, Emerald Fulltext for scientific journals and ScienceDirect for scientific journals. In ad-dition to these, we have found a student thesis which features a case study on Dell. We have sifted through the reference list of this thesis and located some sources that might be useful to us, including Direct From Dell, authored by Michael Dell. In addition, some non-academic articles and corporate documents available online provide us with in-depth information concerning Dell’s business practices. Dell has frequently been mentioned in studies featuring cash to cash cycle, build-to-order manufacturing and just-in-time inventory management, so we can extract quite a bit of information from those studies and insert them into relevant contexts.
We obtained up-to-date background information on the company, released in 2008 by Datamonitor, a business information and market analysis company. We accessed this source via Business Source Premier.
For the majority of the topics, we started our search in the library databases. However, some articles were outdated so we needed to double-check on them to determine if they were still relevant. And some studies were only available in abridged versions, whereas some lacked enough detail although they were seemingly relevant.
We conducted web searches and tracked down useful articles regarding Dell’s working capital management practices, some of which talk about C2C in particular. Both topics are mainly based on a few article written by Fisher (1998) and Byrnes (2003) and data are crosschecked with annual reports, other articles and the book by Michael Dell,
Di-rect from Dell (We incidentally found out that Dell prefers the term “cash conversion
cycle” to “cash to cash cycle”; however, to prevent confusion, we have adopted the term C2C throughout this text). C2C figures have been extracted from the company’s finan-cial reports.
Based on direct experience and our studies in International Logistics and Supply Chain
Management, we knew that Dell operates on a direct sales model, offers on-site service,
and implements build-to-order manufacturing and JIT inventory management.
These have served as keywords in our searches. Regarding demand management at Dell, we mainly relied on Dell (1993) at the beginning. Later, we figured that the infor-mation in this article is rather outdated and Dell might be implementing new strategies; therefore, we had recourse to the book, Direct from Dell (published in 1999), and more recent articles on ABI/Inform. Regarding supply management, we based our findings largely on Kraemer & Dedrick (2002) and Breen (2007). As for inventory management, we again made use of the articles that have just been mentioned, namely Breen (2007), Kraemer & Dedrick (2002) and Byrnes (2003).
We didn’t confine ourselves to these articles: We searched for more information on other databases and the web and found miscellaneous sources. The data sources con-sulted in the empirical study are dated from 1993 up to 2009. The book “Direct from
Dell”, as it is the product of firsthand experience, is an especially reliable source, and it
allowed us to double-check on information that we obtained from various studies. Studies that feature direct quotes from Dell insiders have been particularly useful as they offer better insight into the company’s practices. And serendipity was at play at times: Searching for information on a particular topic, we ran into sources that proved valuable in other contexts.
5. Manage the data collection
In the empirical study, data, upon collection from various sources, will be inserted into one of the following contexts: working capital management, C2C, demand manage-ment, supply management and inventory management. Irrespective of the context, we will do crosschecking on the data. If we happen to find a contradiction, we will look for new data sources and decide on one that we deem reliable and up-to-date.
6. Analyze the data
After gathering information regarding Dell Inc. in the empirical study, we will provide a critique of Dell’s business practices in connection with its C2C position. Our critique will be supported by the literature review we have made.
7. Write Up
In the analysis part, we will clarify how the three constituents of C2C, i.e. DRO, DPO and DOI, relate to the processes of demand management, supply management, and in-ventory management respectively. We will conduct a case analysis to look into the di-rect and indidi-rect effects on suppliers and customers.
8. Leave the Case
Lastly, we will list C2C reduction scenarios and corresponding effects on the supply chain. Thereafter, we will lay out propositions to mitigate the negative effects and these will constitute the results of our study.
3.4 Measurement
Maximizing reliability and validity of the empirical research is the key to ensuring proper quality in the work (Tharenou et al., 2007).
3.4.1 Internal validity
In order to increase internal validity, we will try to gather data from various researchers and identify similarities and contrast in those data. The empirical study will be con-ducted based on the structure adopted in the literature review. And we will refer to the literature in the analysis part in order to analyze the data obtained.
3.4.2 External validity
External validity was originally seen as the generalizability of the research (Quinton & Smallbone, 2006). It is difficult to generalize by conducting a single case study. Due to the time constraint and limited access to information on corporate strategies, the authors can’t perform multiple case studies. In case studies, generalization has to do with extrapolation to theoretical propositions (Tharenou et al., 2007). Taking this into account, we will keep the range of our proposi-tions as wide as possible.
3.4.3 Reliability
There are a number of ways to increase research reliability, such as using different data sources and different data collection tools (Quinton & Smallbone, 2006). We use infor-mation from various sources, which come in the form of articles, reports, statistics, in-terviews, etc. This serves to crosscheck information provided in different sources. The authors rely mostly on corporate documents, such as annual reports and form 10-k, as well as accounts of Dell’s top management.
4. Empirical Study
______________________________________________________________________
This chapter will start with company background. That will be followed by an examina-tion of Dell’s working capital management practices and its C2C posiexamina-tion. And we will look into how Dell implements demand management, supply management and inventory management processes.
______________________________________________________________________
4.1 Company
Background
Dell is one of the world’s largest suppliers of PCs and PC related products. It designs, manufactures, markets, and services personal computers, servers, printers and other products. Michael Dell started the company in 1984 (it was at the time named Dell
Computer Corporation) in order to sell personal computer systems directly to
end-customers. Today, the company’s customer portfolio includes large corporations, gov-ernmental institutions, healthcare and education companies, small and medium-sized enterprises and individual customers (See Appendix2). Dell offers products in six cate-gories: desktop computer systems, mobility products, software and peripherals, servers & networking products and storage products. Dell operates in the Americas, Europe, the Middle East and Africa, and Asia Pacific-Japan (DataMonitor, 2008).
4.2 Dell’s Working Capital Management
In 1986, Dell decided to focus on growth. But it was not long before it found out that the direct sale model limited its performance in a niche market (Fisher, 1998). With the limitations of its strategy (direct sales with build to order manufacturing), Dell decided to deliver some of its products through PC superstores and other retailers such as CompUSA, Wal-Mart and Best Buy (Fisher, 1998; Dell, 1999). In 1994, quality prob-lems surfaced and it began to take more cash to sustain growth to remain a first-tier PC provider (Byrnes, 2003). Dell was suffering from a serious cash shortfall. In the fiscal year ending in January 1994, sales had surged to 2.8$ billion but the income statement was alarming: the company reported a net loss of $36 million (Dell annual report, 1995).
In order to remedy this situation, Dell decided to implement just-in-time inventory man-agement and the results were extremely satisfactory: days of inventory dramatically dropped. Instead of tying cash up in inventory, Dell was able use the freed-up cash to fuel its growth (Byrnes, 2003). Dell subsequently achieved strong positive cash flow and subsequently strong profitability as indicated in its financial reports.
4.3 Dell’s C2C Performance
In 1993, Dell was undergoing rapid growth with high inventory levels while its working capital was going down (Barr, 1998). In the wake of a fast growth mode that led it to run out of cash, Dell suffered its first loss in 1994, as noted earlier. According to Tho-mas J. Meredith, Dell's Chief Financial Officer, who joined the company in 1993, focus-ing only growth could destabilize profitability and liquidity (cited in Fisher, 1998).
Meredith therefore identified cash to cash cycle as a key performance metric to balance the objectives of growth, liquidity and profitability (Barr, 1998).
Meredith points out that Dell’s employees are committed to this metric. Employees from the lowest to the highest level must grasp the importance of the metric (Fisher, 1998).
In late 1994, Dell’s C2C stood at +41 days. As a result of improvements in inventory management, component cost and quality, Dell was profitable again in fiscal year 1995 and its C2C dropped to +35 days (Dell annual report, 1995).
Dell’s success actually stemmed from a simple idea, eliminating the middlemen. Thereby, it allows Dell eliminate the substantial resellers’ mark-up and avoid the costly inventories (Dell, 1999). Dell is able to deliver its products directly to end-customers for lower prices and provide high service and support (Dell, 1993). After the new perform-ance metric, C2C, was adopted in 1994, Dell sharpened its direct-sales and build-to-order strategies (Barr, 1998). Dell continued to grow and it incorporated liquidity into its strategic concerns (Dell, 1999).
Fisher (1998) looks into Dell’s working capital management and identifies three reasons that Dell's direct model makes for C2C improvement:
- It keeps little or no finished-goods inventory as it sells directly to end-customers.
- It keeps very little semi-finished goods inventory as it purchases components on a just-in-time basis.
- Cash flow remains positive as customers often pay Dell before Dell pays its suppliers. 56 41 35 40 -4 -8 -12 -18 -21 -36 -37 -40 -42 -44 -42 -36 -60 -40 -20 0 20 40 60 80 100 1993 1994 1995 1996 1997 1998 1999 2000 2001 2002 2003 2004 2005 2006 2007 2008 DSI DSO DPO C2C