Postprint
This is the accepted version of a paper published in Political Psychology. This paper has been peer-reviewed but does not include the final publisher proof-corrections or journal pagination.
Citation for the original published paper (version of record): Eriksson, K., Funcke, A. (2015)
A Below-Average Effect with Respect to American Political Stereotypes on Warmth and Competence.
Political Psychology, 36(3): 341-350 http://dx.doi.org/10.1111/pops.12093
Access to the published version may require subscription. N.B. When citing this work, cite the original published paper.
Permanent link to this version:
A below-average effect with respect to American political
stereotypes on warmth and competence
Kimmo Eriksson1,2 and Alexander Funcke1,2
1
Mälardalen University, Västerås, Sweden
2
Stockholm University, Stockholm, Sweden
Contact information: Kimmo Eriksson, Centre for the Study of Cultural Evolution, Stockholm University, SE-10691 Stockholm, Sweden. Phone: +46 21 101533. Fax: +46 21 101330. Email: kimmo.eriksson@mdh.se
Acknowledgments
We thank Pontus Strimling and several anonymous reviewers for helpful advice.
Funding
This research was supported by the Swedish Research Council [grants 2009-2390 and 2009-2678].
A below-average effect with respect to American political stereotypes on
warmth and competence
Abstract
The “above-average effect” is the phenomenon that people tend to judge themselves above average on desirable traits. Based on social identity theory, we propose that a “below-average effect” may arise when individuals rate themselves and the “below-average ingroup member on traits stereotypically associated with the ingroup. In two studies Republican and Democrat participants rated themselves and the average political ingroup member on possession of desirable traits related to warmth and competence. Current political stereotypes in America associate the former dimension with Democrats and the latter with Republicans. Consistent with our hypothesis, the above-average effect was moderated by political group and
dimension in interaction. In particular, Democrats rated themselves below the average Democrat on warmth and Republicans rated themselves below the average Republican on competence.
Keywords: above-average effect, below-average effect, self-enhancement, ingroup bias, political stereotypes
Introduction
When people judge themselves and others on desirable characteristics, they tend to judge themselves as above the average in a given group to which they belong (Alicke, Klotz, Breitenbecher, Yurak, & Vredenburg, 1995; Alicke & Govorun, 2005). This phenomenon is known as the above-average effect (or, alternatively, the better-than-average effect). The aim of this paper is to investigate, particularly for politically based groups, a condition under which this effect vanishes, and sometimes even reversed to a below-average effect. A general below-average effect has previously been demonstrated in judgments of abilities in domains where it is rare for people to have good abilities (e.g., juggling), consistent with people egocentrically focusing on their own ability (Kruger, 1999). In contrast, we propose that a below-average effect will be seen in judgments of desirable traits that are stereotypically associated with the ingroup.
Our proposal is based on judgment biases predicted by social identity theory. It is well-known that judgments of desirable traits are subject to bias. Indeed, some papers (e.g.,
Loughnan et al., 2011) refer to the above-average effect simply as self-enhancement bias, i.e., a tendency to rate oneself unfairly high. Biases may, however, also affect the rating of the average ingroup member. In line with a large body of research based on the social identity approach pioneered by Tajfel and Turner (1979, 1986), and later developments such as optimal distinctiveness theory (Brewer, 2003), we should expect ingroup bias. In the present context of ratings on desirable characteristics, ingroup bias would entail a tendency to rate ingroup members unfairly high.
An illustrative example of ingroup bias in ratings is a study in Australia where students who identified either with the Labor Party or the Liberal-National Coalition judged people’s ability to withstand influence from political campaigns (Duck, Hogg, & Terry, 1995). In both
camps, participants judged supporters of the same party to be less influenced than supporters of the rival party. In the same study (Duck et al., 1995), participants’ ratings of their own ability to withstand influence were even higher than their ratings of the ingroup’s ability. In other words, self-enhancement bias dominated over ingroup bias, creating an above-average effect.
Because the above-average effect has been documented in a large number of contexts, it would seem a robust conclusion that people tend to enhance their own desirable traits more than the average ingroup member’s. We propose a modification of this conclusion based on another component of social identity theory: the tendency to accentuate prototypical
differences between ingroup and outgroup members on evaluative dimensions that are believed to be relevant to the categorization (Duck et al., 1995, p. 198). Thus, with respect to traits stereotypically associated with the ingroup we expect individuals to exaggerate their positive evaluations of the average ingroup member (as well as make exaggeratedly negative evaluations of the outgroup). This exaggeratedly positive evaluation of the prototypical average ingroup member may not carry over to evaluations of self, which is a less
prototypical group member (Turner, 1985). If ingroup exaggeration is large enough it may therefore dominate over self-enhancement bias, resulting in a below-average effect. Our specific hypothesis is that the above-average effect will be attenuated, or even reversed, if two conditions are met: first, the rated trait should be stereotypically associated with the ingroup; second, social categorization in ingroup and outgroup must be salient.
For the case of religious groups, this prediction is supported by a recent unexpected finding of Eriksson and Funcke (2012, Study 3). The focus of their study was to test whether religious self-stereotyping would make more religious individuals rate their own warmth particularly high above the average American. To obtain a measure of the religious
stereotype, the researchers also asked participants to rate the average person sharing their religious persuasion. Unexpectedly, religious participants tended to rate the warmth of the average religious ingroup member even higher than their own warmth. In other words, despite their high self-ratings the religious participants exhibited a below-average effect within their religious ingroup. This finding applied only to ratings of warmth, not competence. Our hypothesis readily suggests an explanation of this surprising finding.1 It is known that the American religious stereotype is associated with warmth rather than competence (Fiske, Cuddy, Glick & Xu, 2002). If religious people exaggerate the distinction between their religious ingroup and outgroup based on this stereotype, we would expect them to exhibit a below-self effect with respect to warmth but not with respect to competence.
The purpose of the present paper is to test our hypothesis in the context of political groups. Partisans are expected to be inclined to maximize distinctions between political ingroup and political outgroup (Greene, 2004). Two studies provide compelling empirical evidence of this phenomenon (Graham, Nosek, & Haidt, 2012; Robinson, Keltner, Ward, & Ross, 1995). In both studies, liberal and conservative participants stated their own political position as well as estimated the position of typical liberals and typical conservatives. Liberals tended to think that other liberals would take more extreme liberal positions (and mutatis mutandis for conservatives). We can think of this as partisans judging themselves to be “below average” on the values of their political ingroup. This would, of course, not constitute a genuine below-average effect, since there is no consensus on any particular political values
1 Another speculation was offered in the original study: Assuming that religious people think warmth-related
traits (e.g., being kind or cheerful) reflect living up to a religious ideal, and further assuming that this ideal is
difficult to live up to, such that religious individuals would tend to think they should be even warmer persons
given their religion, the observed below-average effect might fit in the difficult-domain framework of Kruger (1999).
being better or more desirable. However, our hypothesis is that the same phenomenon of exaggeration of the ingroup’s stereotypical traits in comparison to self will occur also when these traits are generally desirable.
Recent research on political stereotypes in America points to a Republican stereotype high on competence-related traits such as power, leadership, and assertiveness, and a Democrat stereotype high on warmth-related traits such as likability, compassion and empathy (Hayes, 2005, 2011; Rule and Ambady, 2010; Winter, 2010). Our hypothesis therefore implies that, when partisan social categorization is salient, party affiliation (Democrat or Republican) will interact with the dimension of evaluation (warmth or competence) in moderating the above-average effect in political ingroups. Specifically, Republicans are predicted to give lower (possibly negative) above-ingroup ratings on competence than on warmth, whereas Democrats are predicted to show the opposite pattern. We tested these predictions in two studies.
Study 1
The first study analyzes data from Eriksson and Funcke (2012, Study 3). For a more detailed description of the data collection we refer to the original study.
Participants
Eight hundred participants from the United States (51% female, age ranging from 17 to 80 with mean value 33 years) were recruited on the Amazon Mechanical Turk (mturk.com) and received a compensation of one US dollar to answer a survey advertised as “Rate yourself and others on various characteristics.”
Materials and methods
The questionnaire was divided into three parts. In each part, respondents rated a certain target on possession of each of 14 characteristics, seven of which were related to warmth (e.g., kind, enthusiastic, sociable) and another seven related to competence (e.g., capable, organized, determined). In prior research these characteristics had all been be judged by Americans as highly desirable (Loughnan et al., 2011). Characteristics were presented in a random (but fixed) order. Every rating was made on a 7-point Likert scale labeled from -3 = much less than the average American to 3 = much more than the average American, with midpoint labeled 0 = just as much as the average American. Thus positive ratings constitute better-than-the-average-American judgments. However, the focus of our analysis is the difference of ratings between two targets: self and the average political ingroup member (“the average person sharing my political persuasion”). Ratings of a third target, the average religious ingroup member were extensively analyzed in the original study and will not be further mentioned here.
After all ratings were completed, participants were asked about their political persuasion. Response options were Republican, Democrat, and Independent.
Results
Ten participants did not complete all fields and were excluded in the original analysis. In addition, we here excluded 291 participants who stated they were Independents. This left 351 Democrats and 148 Republicans, a total of N=499 participants, for the subsequent analysis of the effect of political stereotypes.
A factor analysis of self-ratings of the fourteen traits supported a two-factor solution with seven warmth-related traits loading on one factor and seven competence-related traits
loading on the other (details omitted, available from the authors). Measures of warmth and competence for each of the two rating targets (i.e., self and average ingroup member) were computed as mean ratings of the two corresponding seven-trait sets (Cronbach’s αs between .78 and .82). Following the so-called indirect method to study the above-average effect (Alicke and Govorun, 2005), we then computed above-ingroup measures as the differences between respondents’ self-ratings and their ratings of the average ingroup members. Table 1 presents descriptive statistics.
A two-by-two mixed ANOVA was employed to evaluate the effects of dimension (warmth or competence) and political ingroup (Republican or Democrat) upon above-ingroup measures. No main effect of dimension was found, F(1,497) = 0.52, p = .47, but a main effect of political ingroup, F(1,497) = 11.19, p = .001, with above-ingroup measures higher among Republicans (M = 0.12) than among Democrats (M = -0.17), d = 0.32. The main result is the predicted interaction of political ingroup and dimension, F(1,497) = 17.68, p < .001. Analyses of simple effects revealed lower above-ingroup measures on warmth than on competence among Democrats, t(350) = 3.23, p = .001, d = 0.17, while Republicans showed the opposite pattern, t(147) = 2.84, p = .005, d = 0.23.
As indicated in Figure 1, comparison of above-ingroup measures with zero levels show that Democrats exhibited a statistically significant below-average effect on warmth and a null effect on competence; Republicans, on the other hand, exhibited a significant above-average effect on warmth and a null effect on competence.
FIGURE 1 ABOUT HERE Discussion
Our hypothesis was that Democrats and Republicans would exaggerate stereotypical virtues of their ingroups. Thus, relative to self-ratings, Democrats would rate their ingroup particularly high on warmth; Republicans would similarly rate their ingroup particularly high on competence. The predicted pattern was obtained.
Because the data was originally collected for another purpose, the design had some weaknesses for the purpose of this study. Most importantly, the operationalization of political ingroup as “the average person sharing my political persuasion” may have been interpreted as a finer-grained grouping than partisanship, and may not have made ingroup-outgroup
categorization as salient as an operationalization explicitly based on party affiliation. Further, no ratings were made of the political outgroups. We could therefore not test whether
respondents exaggerate the ingroup-outgroup distinction on stereotypical ingroup virtues also by rating the outgroup particularly low, as we would expect from previous studies of
exaggerated partisan judgments (Graham et al., 2012; Robinson et al., 1995).
Study 2
A second study was conducted to replicate the findings of the first study while
addressing the abovementioned weaknesses. Thus, participants were asked to rate themselves, the average Democrat and the average Republican on a number of characteristics related to warmth and competence. We also asked participants to rate targets on how good a driver they are, a domain for which the above-average effect is well-established (Svenson, 1981). Quality of driving should be irrelevant to social categorization based on partisanship. Thus, we
predicted that ratings of driving skills would not be subject to exaggeration to increase group distinctiveness and should therefore exhibit clear above-average effects regardless of political ingroup. In contrast, exaggeration of ingroup warmth among Democrats and ingroup
competence among Republicans was predicted to lead to below-average effects for these specific combinations of domains and political ingroups.
Participants
One hundred ninety three participants from the United States (51% female, age ranging from 18 to 73 with mean value 36 years) were recruited on the Amazon Mechanical Turk (mturk.com) and received a compensation of 0.60 US dollar to participate in a survey advertised as in Study 1.
Materials and methods
The questionnaire was divided into three parts, one for each of three targets: (a) the respondent, (b) the average Republican, (c) the average Democrat. The order of the last two parts was randomized; no order effects were identified. Respondents used the same scale as in Study 1 to rate targets on possession of four warmth-related traits (enthusiastic, kind,
optimistic, sociable) and four competence-related traits (ambitious, capable, confident, determined). In addition, respondents rated targets on their being a good driver.
Results
There were 81 Democrats and 59 Republicans in our sample; 53 Independents were excluded from further analysis as they do not constitute an ingroup in this study design. We conducted a factor analysis of self-ratings of the eight traits related to warmth or competence. The expected two-factor solution was supported (details omitted, available from the authors). Mean ratings of the average warmth and competence of each of the three targets were
computed (Cronbach’s α ranged between .6 and .8, indicating reasonable reliability). Following Study 1, we obtained an above-ingroup measure by computing the differences
between respondents’ self-ratings and their ratings of the average ingroup members (i.e., for Democrat participants their ratings of the average Democrat, and analogously for Republican participants). Analogously, an above-outgroup measure was computed as the difference between ratings of self and the average outgroup member. Descriptive statistics are presented in Table 2.
Analysis of the above-ingroup measure
A two-by-two mixed ANOVA evaluating the effects of dimension and political ingroup upon above-ingroup measures essentially replicated the findings of Study 1. There was no main effect of dimension, F(1,138) = 1.60, p = .21; there was a main effect of political ingroup, F(1,138) = 4.03, p = .047, with above-ingroup measures higher among Republicans (M = -0.34) than among Democrats (M = -0.73), d = 0.34; and there was the predicted interaction of political ingroup and dimension, F(1,138) = 25.63, p < .001, with lower above-average measures on warmth than on competence among Democrats, t(80) = 4.58, p < .001, d = 0.51, while Republicans showed the opposite pattern, t(58) = 2.76, p = .008, d = 0.36.
As indicated in Figure 2, Democrats exhibited a statistically significant below-average effect on warmth (but no significant effect on competence); Republicans, on the other hand, exhibited significant below-average effect on competence (but no significant effect on warmth).
FIGURE 2 ABOUT HERE
Analysis of the above-outgroup measure
We expected respondents to exaggerate the ingroup-outgroup distinction on
stereotypical ingroup virtues not only by rating the ingroup particularly high but also by rating the outgroup particularly low. This would imply political ingroup and dimension interacting
in the opposite way for the above-outgroup measure compared to the above-ingroup measure. We conducted a two-by-two mixed ANOVA of the effects of dimension and political ingroup upon above-outgroup measures. There was no main effect of dimension, F(1,138) = 0.10, p = .92; there was a main effect of political ingroup, F(1,138) = 5.11, p = .025, with the above-outgroup measure higher among Republicans (M = 0.62) than among Democrats (M = 0.11), d = 0.38. Most importantly, there was the predicted interaction between political ingroup and dimension, F(1,138) = 25.63, p < .001, with the above-outgroup measure higher on warmth than on competence among Democrats, t(80) = 3.55, p = .001, d = 0.39, and higher on competence than on warmth among Republicans, t(58) = 2.52, p = .015, d = 0.33. This is the opposite pattern to that exhibited by the above-ingroup measure.
Ratings of the characteristic “is a good driver”
Figure 3 shows how Democrats and Republicans rated the driving skills of themselves, the average Democrat, and the average Republican. As expected, ratings of driving skills showed no exaggerated political ingroup bias. Instead both Democrats and Republicans exhibited clear above-ingroup effects, both ps < .001.
FIGURE 3 ABOUT HERE
Discussion
The second study replicated and strengthened the findings of the first study. In particular, below-average effects were found in warmth ratings of Democrats and in competence ratings of Republicans.
On the whole, ingroup ratings were higher than in Study 1. This indicates that, compared to the phrase used in Study 1 (“the average person sharing my political
thus created stronger ingroup bias. Due to the generally high ratings of ingroups, null effects rather than above-average effects occurred for the non-stereotypical combinations of partisans and traits. Nonetheless, both groups showed significant above-average effects when they rated driving skills. Thus it seems that even when not stereotypically associated with the own political group, competence and warmth are qualities that partisans are inclined to ascribe to ingroup members at above-average levels, presumably because these qualities are politically desirable.
This study extended Study 1 by including outgroup ratings. These ratings showed the opposite pattern to ingroup ratings, i.e., for those stereotypical traits where ingroup ratings were particularly high, outgroup ratings were particularly low. This strongly supports the hypothesis of exaggeration of differences in stereotypical traits.
A somewhat curious finding is that Democrats tended to give the average Republican a rather high rating on competence. However, a closer look at the ratings of each of the four competence-related traits reveals that while Democrats rated the average Republican as ambitious, confident and determined compared to the average American (means between 1.21 and 1.48), they did not rate the average Republican as capable (mean -0.30). Thus, in the context of rating Republicans, Democrat respondents may have interpreted the former three traits as reflecting only the pretense of competence rather than real competence.
General Discussion
The above-average effect is the near-universal tendency of individuals to rate themselves above average in any given group to which they belong. Many researchers attribute this effect to self-enhancement (e.g., Alicke & Govorun, 2005; Loughnan et al., 2011). In this paper we have studied how social categorization mechanisms may make the
above-average effect go away, or even be reversed. First, if social categories are salient, ingroup bias may generally increase ratings of the average ingroup member. Second, in case the trait to be rated is stereotypically associated with the ingroup, individuals may be
motivated to exaggerate the ingroup-outgroup distinction by giving particularly high ratings to the average ingroup member.
In our studies we used American political parties as a particularly interesting example of social categories (Greene, 2004). According to previous research on American political
stereotypes, Democrats and Republicans are associated with attributes related to warmth and competence, respectively. As expected from self-enhancement and ingroup bias, respondents tended to rate both themselves and the average political group member above the average American. Our interest focused on the balance between self-enhancement and ingroup effects. Consistent with our argument, political ingroup and rating dimension interacted such that ingroup ratings tended to surpass self-ratings on warmth for Democrats, and on competence for Republicans. Also consistent with our argument, the political outgroup tended to obtain exaggeratedly low ratings on the same dimensions. Contrasting with these exaggerated views of ingroup and outgroup members, there were only small differences in self-ratings between Democrats and Republicans. (These differences showed a consistent pattern, with
Republicans consistently making slightly higher self-ratings than Democrats. This unexpected finding is potentially interesting and should be explored further.)
Exaggeration of ingroup-outgroup differences between liberals and conservatives have previously been documented for political positions and values (Chambers, Baron & Inman, 2006; Graham et al., 2012; Robinson et al., 1995). The present findings show that similar exaggeration arises also on generally desirable characteristics stereotypically associated with the ingroup. A difference must be noted, though, in that the previous studies found both
liberals and conservatives exaggerating political differences. In contrast, only the group favored by the stereotype exaggerated differences in warmth and competence in our study. Given the general desirability of these characteristics, this lack of perfect symmetry is unsurprising. Republicans would not be motivated to rate their ingroup low on warmth, nor would Democrats be motivated to rate their ingroup low on competence.
We believe a novel feature of our studies is that social categorization was made salient. Previous research on the above-average effect will typically have involved asking participants to compare themselves to others in a group without emphasizing the distinctiveness of that group. In our first study, we achieved greater salience of social categories by asking respondents to compare the average ingroup member to the average American. The second study asked respondents to rate both the average Republican and the average Democrat in relation to the average American. This would cue ingroup-outgroup distinction even more strongly. Following our theoretical argument, attenuation or even reversal of the above-average effect should be obtained in many groups if ingroup-outgroup differences are made salient, and in particular if the evaluative dimension is one on which the ingroup is
stereotypically high. In the introduction we discussed how the hypothesis seems to apply to the case of religious groups and warmth. It would obviously be interesting to investigate the hypothesis also with respect to, say, race and gender stereotypes.
References
Alicke, M. D., & Govorun, O. (2005). The better-than-average effect. In M.D. Alicke, D.A. Dunning, & Krueger J.I. (Eds.), The Self in Social Judgment, p. 85-106. Psychology Press: NY.
Alicke, M. D., Klotz, M. L., Breitenbecher, D. L., Yurak, T. J., & Vredenburg, D. S. (1995). Personal contact, individuation, and the better-than-average effect. Journal of Personality and Social Psychology, 68, 804-825.
Brewer, M. B. (2003). Optimal distinctiveness, social identity, and the self. In M. Leary & J. Tangney (Eds.), Handbook of self and identity (pp. 480–491). New York, NY: Guilford.
Chambers, J. R., Baron, R. S., & Inman, M. L. (2006). Misperceptions in intergroup conflict: Disagreeing about what we disagree about. Psychological Science, 17, 38-45.
Duck, J., Hogg, M., & Terry, D. (1995). Me, us and them: political identification and the third-person effect in the 1993 Australian federal election. European Journal of Social Psychology, 25, 195-215.
Eriksson, K., & Funcke, A. (2012). Humble self-enhancement: Religiosity and the better-than-average effect. Available at SSRN: http://ssrn.com/abstract=2160752.
Fiske, S.T., Cuddy, A.J.C., Glick, P., & Xu, J. (2002). A model of (often mixed) stereotype content: competence and warmth respectively follow from perceived status and competition. Journal of Personality and Social Psychology. 82, 878–902.
Graham, J., Nosek, B. A., & Haidt, J. (2012). The moral stereotypes of liberals and conservatives: Exaggeration of differences across the political spectrum. PLoS ONE, 7, e50092. doi:10.1371/journal.pone.0050092
Greene, S. (2004). Social identity theory and party identification. Social Science Quarterly, 85, 136-153.
Hayes, D. (2005). Candidate qualities through a partisan lens: A theory of trait ownership. American Journal of Political Science, 49, 908–923.
Hayes, D. (2011). When gender and party collide: Stereotyping in candidate trait attribution. Politics & Gender, 7, 133-165.
Kruger, J. (1999). Lake Woebegon be gone! The “below-average effect” and the egocentric nature of comparative ability judgments. Journal of Personality and Social Psychology, 77, 221–232.
Loughnan, S., Kuppens, P., Allik, J., Balazs, K., de Lemus, S., ..., & Haslam, N. S. (2011). Economic inequality is linked to biased self-perception. Psychological Science, 22, 1254-1258.
Robinson, R. J., Keltner, D., Ward, A., & Ross, L. (1995). Actual versus assumed differences in construal: "Naive realism" in intergroup perception and conflict. Journal of Personality and Social Psychology, 68, 404-417.
Rule, N.O., & Ambady, N. (2010). Democrats and Republicans can be differentiated from their faces. PLoS ONE, 5, e8733.
Svenson, O. (1981). Are we all less risky and more skillful than our fellow drivers? Acta Psychologica, 47, 143–148.
Tajfel, H., & Turner, J. (1979). An integrative theory of intergroup conflict. In W Austin & S. Worchel (Eds.), The social psychology of intergroup relations (pp. 33-47). Monterey, CA: Brooks/Cole.
Tajfel, H., & Turner, J. C. (1986). The social identity theory of intergroup behavior. In S. Worchel & W. Austin (Eds.), Psychology of intergroup relations (pp. 7–24). Chicago: Nelson Hall.
Turner, J.C. (1985). Social categorization and the self-concept: A social cognitive theory of group behavior. In E. J. Lawler (Ed.). Advances in group process: Theory and research, (Vol. 2, pp. 77–122). Greenwich, CT: JAI Press.
Winter, N. J. G. (2010). Masculine Republicans and feminine Democrats: Gender and Americans’ explicit and implicit images of the political parties. Political Behavior, 32, 587–618.
Table 1: Descriptive statistics for warmth and competence ratings of self and ingroup in
Study 1, and the rating difference between targets. All ratings made on 7-point Likert scales from -3 = much less than the average American to 3 = much more than the average American.
Measure Rater group
Warmth mean (SD) Competence mean (SD) rating of self Democrats 0.68 (1.00) 0.78 (0.98) Republicans 0.83 (1.06) 1.14 (1.00) rating of average ingroup member Democrats 0.95 (0.81) 0.86 (0.88) Republicans 0.57 (0.89) 1.15 (0.93) Difference: self above average ingroup member Democrats -0.27 (1.05) -0.08 (1.07) Republicans 0.26 (1.08) -0.01 (1.04)
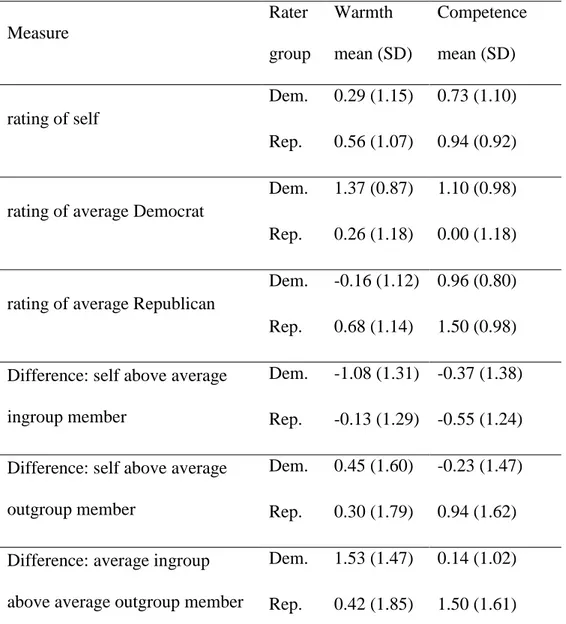
Table 2: Descriptive statistics for ratings and rating differences in Study 2. Measure Rater group Warmth mean (SD) Competence mean (SD) rating of self Dem. 0.29 (1.15) 0.73 (1.10) Rep. 0.56 (1.07) 0.94 (0.92)
rating of average Democrat
Dem. 1.37 (0.87) 1.10 (0.98) Rep. 0.26 (1.18) 0.00 (1.18)
rating of average Republican
Dem. -0.16 (1.12) 0.96 (0.80) Rep. 0.68 (1.14) 1.50 (0.98) Difference: self above average
ingroup member
Dem. -1.08 (1.31) -0.37 (1.38) Rep. -0.13 (1.29) -0.55 (1.24) Difference: self above average
outgroup member
Dem. 0.45 (1.60) -0.23 (1.47) Rep. 0.30 (1.79) 0.94 (1.62) Difference: average ingroup
above average outgroup member
Dem. 1.53 (1.47) 0.14 (1.02) Rep. 0.42 (1.85) 1.50 (1.61) Note. N=81 Democrats and N=59 Republicans.
Figure 1: Above-ingroup measures in Study 1, with Bonferroni corrected (98.75%)
confidence intervals.
Figure 2: Above-ingroup measures in Study 2, with Bonferroni corrected (98.75%)
Figure 3: How Democrats and Republicans rated themselves, the average Democrat and the
average Republican on possession of the characteristic “is a good driver”. Zero ratings correspond to the skill level of the average American. Error bars signify standard errors.