A TECHNICAL PLATFORM USING AUGMENTED REALITY
FOR ACTIVE SAFETY TESTING
Björn Blissing Research assistant
Swedish National Road and Transport Research Institute VTI, SE-581 95 Linköping, Sweden
bjorn.blissing@vti.se
Fredrik Bruzelius Researcher
Swedish National Road and Transport Research Institute VTI, SE-581 95 Linköping, Sweden
fredrik.bruzelius@vti.se
ABSTRACT
This paper describes the design of a video see-through augmented reality system for active safety testing. The development is explained in detail, with focus on the design considerations for the different subsystems. It is shown that it is possible to build a system using available commercial off-the-shelf components, while still maintaining the performance needed for the intended application. Accuracy and resolution requirements of the tracking systems are discussed along with measurement methods. We also examine how to use the hardware efficiently to minimize latency and a device to measure and quantify end-to-end latency has been developed.
KEYWORDS
AUGMENTED REALITY, LATENCY MEASUREMENTS, ACTIVE SAFETY TESTING
INTRODUCTION
There is a growing trend towards active safety systems in vehicles today. A general belief is that active safety will be a key component to reduce the number of fatalities and severely injured by motor vehicles. This is also acknowledged by legislators and many countries across the globe requiring an increased number of active safety features in vehicles. The wide introduction of features such as lane keeping aids, autonomously intervening collision mitigation functions etc. requires an extensive amount of testing due to complexity regarding sensor fusion, decision algorithms and the interaction with the traffic environment in which the vehicle is operating.
Testing involving the interaction with the driver is an essential component to ensure reliable and safe operation of active safety functionality. Such testing can be done using real vehicles and drivers on a test track, but can be resource intensive, dangerous to both man and machine and some scenarios can be very complex to implement. Physical testing on a test track typically also experience poor reproducibility and repeatability due to uncontrollable components such as weather and test equipment. Driving simulators offer a remedy to some of these issues such as enabling a completely controlled environment with the possibility to conduct repeatable experiments, which make them safe and cost efficient. However, simulators suffer from their own disadvantages; e.g. driver behavior adaptation, motion sickness, and sometimes questionable validity (Kemeny & Panerai, 2003).
Augmented and virtual reality can be used as a complement to driving simulators and test tracks. This provides an efficient way of testing that inherits many of the advantages of driving simulators, while retaining some of the advantages of physical testing (Bock, Maurer, & Farber, 2007). The visual environment can be presented to the driver as either partially or completely computer generated. Scenarios similar to what is available in driving simulators can be produced, but with the correct feedback in terms of vehicle reaction and motion. Active safety systems in the vehicle can also be made to interact with the simulated environment to complete the loop.
The potential risk of replacing the driver’s visual impression with a partly or completely simulated one is similar to the issues found in driving simulators. Mismatches between the senses of the driver and the visual impression can cause both nausea and potentially affect the driving behavior. Previous research has shown that temporal delays have a major impact on both the level of presence (Papadakis et al., 2012) and rate of simulator sickness (Draper et al., 2001). Increased latency also increases the magnitude of the registration errors (Allison et al., 2001), i.e. when the superimposed computer graphics is misaligned with the real world.
However, recent studies (Karl et al., 2013) have shown that participants were able to drive a real car in a purely virtual environment with similar longitudinal behavior as real driving, although drivers showed increased reaction time and slower accelerations. One benefit of using a pure virtual world compared to an augmented reality is the elimination of the registration errors, but at the same time it can also reintroduce simulator sickness.
In this paper, we focus on the development of a technical platform capable of presenting oriented augmented reality and virtual reality in vehicle and active safety testing applications. The primary goal of this work was to develop a research platform for augmented driving, with particular emphasis on the influence on driving behavior caused by latency effects and registration errors. The work here presents the design considerations of a head mounted display (HMD) system capable of presenting augmented and virtual reality with the required flexibility.
AUGMENTED REALITY SYSTEM
Augmented reality system performance and usability can be defined by main characteristics, such as the latency of the visual presentation, the field of view, and the tracking accuracy of the user’s head motion. Correct tracking of the user’s head relative to the vehicle and the road is essential to correctly orient synthetic objects, such as other vehicles or obstacles. Latency is introduced in all hardware parts of the system. The camera attached to the HMD introduces latency in the image acquisition phase. The image generator adds latency when it stores the camera frame into its internal memory and superimposes the computer generated objects. The HMD screen has a scan out time that needs to be considered and the tracking system relies on multiple measurements over time, which also adds to overall system latency. Any latency noticed by the user could potentially lead to nausea, motion sickness, and substantially affect the driving behavior. Hence, it is of vital importance to keep latency to an absolute minimum. In an optical see-though HMD the environment is displayed directly to the user and the computer graphics are superimposed via an optical combiner, usually a semitransparent mirror. This gives the user a direct view of the environment without any delay or distortion. However, this solution often suffers from registration errors, where the generated image and the real world object are out of alignment. Optical see-through systems also suffer from low brightness and contrast.
Video see-through HMDs provide a view of the environment by capturing the environment with cameras. The image of the environment is then combined with the computer graphics and displayed to the user. A video see-through HMD is capable of displaying graphics that completely occlude the image from the cameras, since the display can completely replace parts of the captured image with the computer generated graphics. However, one of the major short comings of video see-through is the latency of cameras which provide visual sensory input of the real environment.
Surveying the market for a suitable HMD revealed that very few video see-through units were available as commercial off-the-shelf products. Most of them used either monoscopic video, low resolution cameras or had a narrow field of view.
To solve these issues it was decided to build a custom solution, by fitting an existing HMD with cameras. This allowed us to select the desired properties regarding several important features such as display and optics. It also had the added benefit of flexibility and implementation transparency compared to available systems on the market.
CAMERA & OPTICS
When choosing cameras for the augmented reality system there are many important factors to consider: Color – The cameras should be able to capture the image with full color.
Resolution – The cameras should be able to capture the image with sufficient resolution.
Frame rate – The camera should be able to capture the image with a frame rate that matches the rate of the image generator. Lower frame rates would incur additional latencies and higher framerates could introduce time aliasing effects.
Field-of-view – The optics in the camera should have a field of view that matches the field of view in of the display system. Using the pinhole camera model, the field of view can be calculated from the sensor size and focal length (Formula 1). This formula does not work for ultra wide angle lenses due to non-linear distortions in the optics.
𝐹𝐹𝐹𝐹𝐹𝐹 = 2 𝑎𝑎𝑎𝑎𝑎𝑎𝑎𝑎𝑎𝑎𝑎𝑎 �2𝑓𝑓�𝑆𝑆𝑑𝑑
Formula 1: Field of view (FoV) from sensor dimension (Sd) and focal length (f)
Latency – The camera should capture the image and transmit the data with low latency to the display system. Focus – The optics should be able to have focus depths so that both the vehicle interior and the outside exterior can be clearly visible.
Image acquisition technique – The camera should capture the entire image at once, i.e. using global shutter. Using cameras with rolling shutters would result in distortions such as wobble, skew, smear or partial exposure. It is possible to rectify some of the effects from rolling shutters during post-processing, but that would add severe latency to the image stream.
Optical distortion – The image should be captured with as low optical distortion as possible. The most common optical distortion is radial distortion, which result in barrel distortion for wide angle lenses and pincushion distortion for zoom lenses. Distortion is measured as the relative change of projected image on the sensor compared to its value predicted by pinhole camera model, which is used in real-time computer graphics. Lenses with major distortions must be corrected in a preprocess stage to be able to use together with computer graphics.
Size and weight – Small size and low weight are desired, since the cameras are to be mounted on top of the HMD. Finding cameras that could match all the above criteria proved hard since some factors counter each other. For example; high resolution cameras often force lower frame rates due to bandwidth constraints, and wide field-of-view lenses increase optical distortions.
Using these desired criteria a camera type was selected for this project, the IDS uEye UI-3240CP-C camera capable of 60 full color frames per second at 1280x1024 pixels using a global shutter. The cameras were fitted with lenses with a focal length of 6 mm, which was the shortest focal length available on the market for this camera model. This focal length gave a field of view of 62 degrees horizontal and 48 degrees vertical. The lenses have manual focus and aperture control, to avoid adding unnecessary complexity to the experiments. Additionally, automatic focus would have added extra weight to the optics.
HEAD MOUNTED DISPLAY
The first iteration of the system uses the Oculus Rift Development Kit 1 (DK1). This HMD has a screen resolution of 1280 by 800 pixels, but because of the unit’s simple optics aggressive software warping is required which makes the usable resolution lower. The possible field of view is specified to be 90 degrees horizontal, which is more than the selected optics. The update frequency of the display was 60 Hz which matches the cameras.
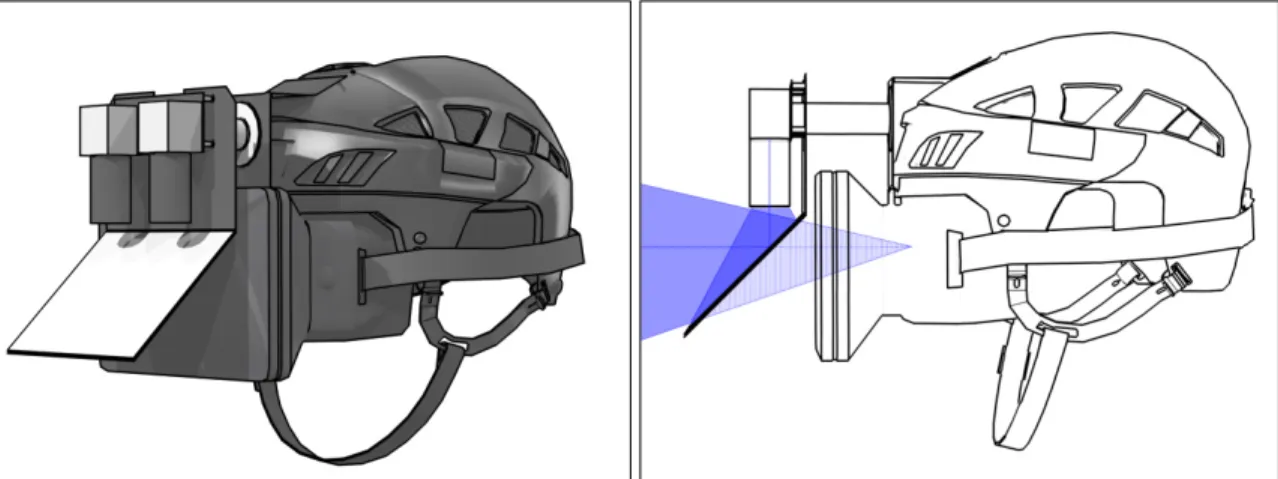
An augmented reality headset was assembled by combining the selected IDS uEye cameras with the Oculus Rift DK1. The cameras were mounted so that their optical axes corresponded to the eye position of the wearer, which meant that a first surface mirror had to be added. The cameras were mounted so that the center-to-center space between them matched the interpupillary distance of an average adult male (Dodgson, 2004). To make the construction stable, everything was mounted on a hockey helmet, which made the construction rather heavy and the mirror protruded quite far in front of the wearer (Figure 1).
Figure 1: First iteration of HMD with Oculus Rift DK1 and a first surface mirror to give on-eye axis optical path.
The second iteration used the Oculus Rift Development Kit 2 (DK2). This HMD has a resolution of 1920 by 1080 pixels. The optics still require the software to perform warping, but not as aggressively as in the first development kit, making the effective pixel count higher. The display can be run in refresh rates up to 75Hz, but was made to run in 60 Hz to match the cameras and to avoid aliasing effects. The DK2 has infrared LEDs mounted on the front of the unit for head tracking, which made the mirror construction impossible since it would obstruct the LEDs. This required the cameras to be mounted on top of the unit. Since the mirror was eliminated the hockey helmet was no longer needed. This reduced the total weight and made the unit easier to wear. The drawback with this solution was that it moved up the optical axis of the cameras 70 mm above the eye axis of the user (Figure 2).
Figure 2: Second iteration of HMD using Oculus Rift DK2 with translated optical axis.
The driver can perceive this translated camera position as increased body height. This effect is most obvious with objects close to the driver, such as the vehicle interior. The effect diminishes with distance and most objects outside the cabin are unaffected (Figure 3). The node points of the cameras are also shifted forward, which in theory could give the perceptual effect of having a larger head than in reality. This effect would be most visible during head yaw motions, but since the forward displacement is only 20 mm the effect is negligible.
Figure 3: Comparison of perspective of on-axis cameras (red) with translated cameras (blue).
TRACKING
In augmented and virtual reality applications there is a need to position and orient the computer generated graphics relative to a physical position. Hence, there is a need to track the real position and orientation. In this specific application with a HMD this implies that the system needs to keep track of the driver’s head position and orientation relative to the vehicle, as well as the vehicle position and orientation in the world. Any mismatch will lead to registration errors, i.e. virtual objects will losing their grounding to the real world and appear to “float”.
To be able to track the vehicle, a tracking solution able to give accurate reading over a large area is needed. Since repeatability is a desired feature, the tracking needs to be able to use global reference points in the real world. The best option in this case is to use a satellite based sensor, such as GPS and GLONASS. These are satellite based systems for navigation and positioning that can determine their locations based on signals received from four or more of the satellites in the network. The accuracy of satellite based systems is usually within 3-5 meters. The accuracy can be further improved using a ground base station and minimize the relative error to within 2.5 centimetres. The satellite based sensor can be connected to an inertial sensor to track relative changes with even higher precision.
To track the head position and orientation a number of different sensor types are available, although some are not feasible to use inside a moving vehicle due to varying light conditions or magnetic interference (Blissing, Bruzelius, & Ölvander, 2013).
The Oculus Rift DK1 contains an inertial sensor which can calculate head orientation but not head position. This works quite well as long as the driver does not start any large side to side head motions. Compared to the Oculus DK1 the DK 2 has an additional tracking sensor, namely an infrared camera. The camera was positioned on the dashboard in front of the driver. The camera combined with active infrared light emitting diodes mounted on the head mounted display, makes the tracking more resilient to varying light conditions compared to passive markers. The Oculus Rift is constructed for use in a desktop setting and usage inside a moving vehicle can deceive the inertial sensor. The sensor fusion inside the Oculus Rift DK2 only uses the camera system to correct for drift originating from the inertial sensors. High acceleration vehicle maneuver would be incorrectly interpreted by the Oculus sensor fusion algorithm as head movement. The magnitude of this error proved too extreme for the camera system to recover from without discontinuous tracker output. To correct for this type of errors a custom correction algorithm was written. The main principle for this algorithm is to detect when the Oculus sensor fusion algorithm outputs discontinuous data, in position and/or orientation. When this happens the algorithm bypasses the Oculus sensor fusion and instead used a custom sensor fusion algorithm. This custom algorithm is only based on the raw inertial data from the Oculus sensors as well as raw inertial data from the vehicle. Subtracting the inertial data from the vehicle from the sensor data from the Oculus will leave only the pure head inertia, which can be used to calculate head position and orientation. This custom algorithm is susceptible to drift and for that reason the algorithm smoothly transitions back to use the Oculus sensor fusion data as soon as it starts reporting back continuous data again. This allows for consistent continuous sensor fusion data, while still enabling the Oculus camera to correct for any positional drift.
IMAGE GENERATOR
The image generator is responsible for presentation of the view of the world to the user. This includes both the virtual objects and the camera view of the real world. The software is running on a standard PC with a high performance consumer graphics card (GPU). OpenSceneGraph (OpenSceneGraph, 2015) was used as graphics engine, but adaptations to the rendering algorithm had to be made to support the optical correction (warping) needed for the Oculus Rift lenses.
The images from the cameras were used as video textures positioned in front of each eye. The size and orientation of these planes have to be calibrated to match the optical properties and placement of the cameras. This calibration was performed manually by displaying a virtual grid with specified dimensions in the virtual world and at the same time letting the cameras capture a real grid with the same dimensions. By scaling and rotating the video planes it is possible to get a one to one correspondence between the virtual and the real image.
Some objects in the real environment should be able to occlude virtual object. An elementary example is that vehicle interior should be able to occlude everything but what is visible through the windows, otherwise outside objects would appear to be present inside the cabin. Other examples can be to have virtual actors appear from behind buildings or other vehicles. To be able to support these types of occlusions detailed 3D models of the occluding objects have to be made. These objects are rendered to the depth buffer only, which makes them invisible but still make the rendering algorithm reject virtual objects positioned behind them (Figure 4).
Figure 4: Original camera view (A), depth buffer with occluding objects visible (B), pure virtual objects (C), final composite (D)
The developed software uses an XML based scenario engine. Static objects can be defined either in a global or local coordinate system. The origin and orientation of this local coordinate system is defined in SWEREF 99 TM system, which is the official geodetic system used by Swedish National Land Survey Agency. All data from the satellite based tracking system is converted into this format. The XML based scenario engine allows for dynamic objects as well. These can be can be triggered by events such as the own vehicle reaching a certain position or after a specified duration.
LATENCY MEASURING DEVICE
Time delays for video see-through augmented reality systems can be categorized into two categories:
• Input latency – This is the time delay from tracker input until the corresponding graphics are shown to the user. This includes both the latency in the tracking system as well as the latency in the visual presentation. This type of latency is sometimes called motion-to-photon latency or input latency.
• Visual latency – This is the time delay from when the cameras captures the image of the real world until the display is updated for the user. This can be called photon-to-photon latency
Previous research has mainly been focused on measuring input latency. A simple technique to measure pure tracker latency is to attach the tracker to a pendulum and then use a LED and a light sensing diode to measure the periodicity of the pendulum and compare this signal to the tracker output (Mine, 1993). To measure the time delay of the full system one approach is to capture the HMD/tracker and display output with video cameras. Latency can then be calculated by counting the frames between HMD/tracker movement and display output (Friston & Steed, 2014; He et al., 2000; Steed, 2008; Swindells, Dill, & Booth, 2000). Another method is to have a screen display a grayscale gradient and to have the corresponding virtual gradient displayed in the HMD. The real gradient can be measured via a light sensing device and the latency can calculated from the phase shift of the virtual gradient (Di Luca, 2010). Yet another approach is to mount the HMD/tracker on a servomotor connected to a rotary encoder and compare the output from the encoder with the display output (Papadakis, Mania, & Koutroulis, 2011).
For optical see-through HMDs there is no visual latency present, but for video see-through devices this latency is of critical importance. To be able to measure this latency the frame counting and gradient methods above could be used. Another method is to use a display feedback and measure the phase delay (Sielhorst et al., 2007). A method used by (Jacobs, Livingston, & State, 1997) is to have a light emitting diode connected to a pulse generator and attach a light sensing device inside the HMD. By feeding both signals into an oscilloscope the latency can be measured as the time difference between the signals.
Our method extends this method by removing the signal generator and oscilloscope. Instead, both signal generation and measurement are done from inside the host computer. This enables automatic calculation of the time difference. It is also possible to measure time of additional associated host events, such as tracking states, GPU states etc. To be able to measure this latency an apparatus was built which consisted of a light emitting diode, a high speed light-to-voltage sensor (response time of 7 μs) and an analogue-to-digital capture card.
The light emitting diode was mounted in front of the cameras and the light-to-voltage sensor was mounted inside the head mounted display. Using the capture card it is possible to measure the time from when voltage is applied to the diode, to when the light-to-voltage sensor detects the corresponding emission light from the display. By sampling the voltage signal from the light-to-voltage sensor in 10 kHz, it is possible to get very accurate photon-to-photon latency measurements (Figure 5). Each cycle gives one latency timing from dark-to-light and one timing from light-to-dark.
In our solution, the cameras run asynchronously with the image generator and the image generator runs asynchronously with the GPU rendering, resulting in latency that is not completely deterministic. Both the camera and GPU relies on double buffering to avoid image tearing, which gives a best case delay of 1 frame and worst case of 2 frames. The image generator runs asynchronously with the GPU, which gives delays of 1 or 2 frames, depending on if the image generator has successfully completed within the time of one frame (16 ms at 60Hz). Combining these delays sum up to a total latency, which in theory should be somewhere between a best case of 3 frames and at worst 6 frames.
Since the time delays can vary the latency samples are collected over 100 periods of switching the diode on and off. The theoretical values do not take GPU driver overhead into account and real values proved to be best case 7 frames and worst case 11 frames (Figure 6). This is larger than desired, but comparable to the latency values in earlier studies using video see-through devices (Sielhorst et al., 2007).
Figure 6: Histogram of frames of latency, measured over 100 cycles (i.e. 200 timings).
CONCLUSIONS
The aim of this work is to let the driver see his or her surroundings through a display system that shows either a real world enhanced with computer generated graphical objects or an entirely simulated world. The objective is to use this platform in vehicle testing and in particular testing of active safety system. An illustrating scenario could be to test the safety system with an oncoming vehicle on a collision course. These types of scenarios are hard to implement, even on a dedicated test track, without jeopardizing safety for people and/or equipment.
The work described herein shows that it is possible to construct a cost effective system capable of presenting augmented reality scenarios to a driver with acceptable latency. Ultimately, the method could be used to study human vehicle interaction in general as a complement to testing in driving simulators and on test tracks. This requires further development and validation, particularly testing with human drivers using the system while completing different driving tasks. Preliminary trails have been conducted, suggesting that this method is applicable as a research tool in this context, but further investigations and development of the system is required. In addition, tests on acceptance and influence on driver behavior regarding sensitivity to latency have been performed and are presently being analyzed.
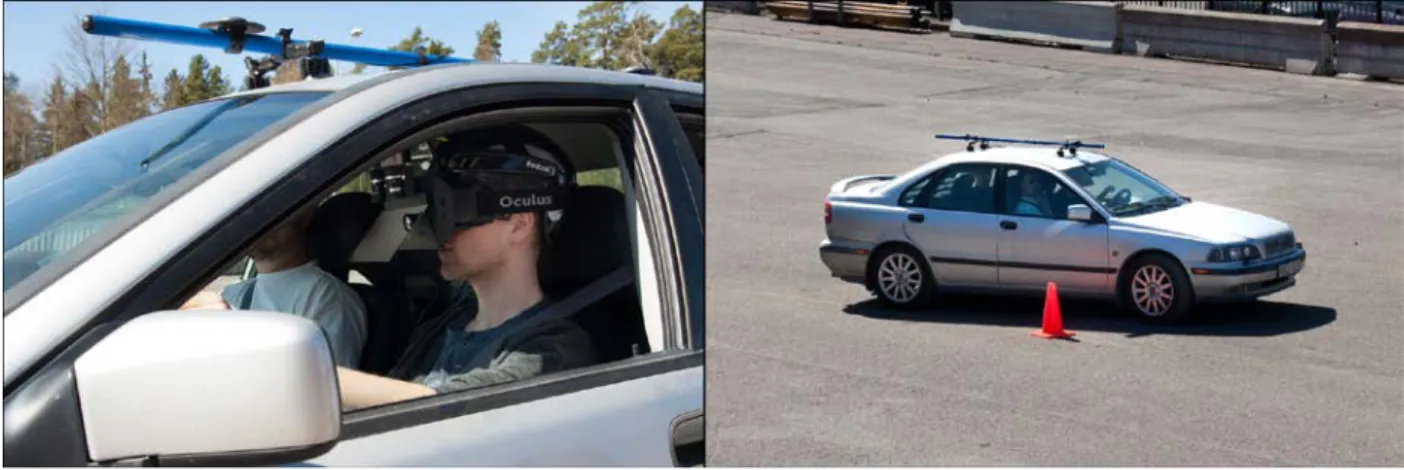
Figure 7: Test in vehicle with the first iteration of the developed system.
FUTURE WORK
The work presented herein investigates the use of augmented and virtual reality in a vehicle testing context. However, much work remains before the tool is robust and performs well enough to be usable in a more general setting. Some of the improvements that are needed are within the tracking system, camera calibration, and the image generator.
A vital component of the performance of the system is the capability to properly orient the computer generated graphics to the real environment. Other tracking hardware should be investigated and merging of various sensor sources should be fully explored. The tracking problem could potentially be solved by utilizing the cameras mounted the head mounted display. If there is a possibility to orient the surroundings through the captured camera images that are used within the augmentation, it could be theoretically possible to have a system with almost zero registration errors.
Manual calibration of the camera parameters can be tedious, time consuming and the result can affect the performance of the system. A first step in automating this process would be to minimize the risk if introducing human errors by introducing a protocol to calibrate the parameters using fixed and fixated objects. A second step would be a completely automated procedure with self-calibrating algorithms.
The graphical environment should be updated to improve image quality, including depth cues such as relative brightness and shadows. Various pictorial cues need to be investigated further in respect to perceived realism and depth perception.
Photo-to-photon latency could probably be improved by using higher frame rates in both cameras and display systems (HMDs), as well as fine tuning GPU settings. Other important parameters which determine the performance and usability of the system are the field of view and the resolution of the display system.
ACKNOWLEDGMENTS
This project is mainly founded by the VINNOVA/FFI project ‘Next Generation Test Methods for Active Safety Functions’ dnr. 2011-01819. Additional funding has also been provided by the Swedish National Road and Transport Research Institute.
REFERENCES
Allison, R. S. R. S., Harris, L. R., Jenkin, M., Jasiobedzka, U., Zacher, J. E. J. E., & Street, K. (2001). Tolerance of temporal delay in virtual environments. In IEEE Virtual Reality 2001 Proceedings (pp. 247–254). Yokohama, Japan: IEEE Computer Society. doi:10.1109/VR.2001.913793
Blissing, B., Bruzelius, F., & Ölvander, J. (2013). Augmented and Mixed Reality as a tool for evaluation of Vehicle Active Safety Systems. In Proceedings of the 4th International Conference on Road Safety and Simulation. Rome, Italy: Aracne.
Bock, T., Maurer, M., & Farber, G. (2007). Validation of the Vehicle in the Loop (VIL) - A milestone for the simulation of driver assistance systems. In Proceedings of the 2007 IEEE Intelligent Vehicles Symposium (pp. 219–224). Istanbul, Turkey: IEEE. doi:10.1109/IVS.2007.4290183
Di Luca, M. (2010). New Method to Measure End-to-End Delay of Virtual Reality. Presence: Teleoperators and
Virtual Environments, 19(6), 569–584. doi:10.1162/pres_a_00023
Dodgson, N. A. (2004). Variation and extrema of human interpupillary distance. In Proceedings of SPIE:
Stereoscopic Displays and Virtual Reality Systems XI (Vol. 5291, pp. 36–46). San Jose, California, USA:
SPIE. doi:10.1117/12.529999
Draper, M. H., Viirre, E. S., Furness, T. a., & Gawron, V. J. (2001). Effects of Image Scale and System Time Delay on Simulator Sickness within Head-Coupled Virtual Environments. Human Factors: The Journal of the
Human Factors and Ergonomics Society, 43(1), 129–146. doi:10.1518/001872001775992552
Friston, S., & Steed, A. (2014). Measuring latency in virtual environments. IEEE Transactions on Visualization and
Computer Graphics, 20(4), 616–625. doi:10.1109/TVCG.2014.30
He, D., Liu, F., Pape, D., Dawe, G., & Sandin, D. (2000). Video-Based Measurement of System Latency. In
Proceedings of the 4th International Immersive Projection Technology Workshop. Ames, Iowa, USA.
Jacobs, M. C., Livingston, M. A., & State, A. (1997). Managing latency in complex augmented reality systems. In A. van Dam (Ed.), Proceedings of the 1997 symposium on Interactive 3D graphics (p. 47–ff). Providence, Rhode Island, USA: ACM Press. doi:10.1145/253284.253306
Karl, I., Berg, G., Ruger, F., & Farber, B. (2013). Driving Behavior and Simulator Sickness While Driving the Vehicle in the Loop: Validation of Longitudinal Driving Behavior. IEEE Intelligent Transportation Systems
Magazine, 5(1), 42–57. doi:10.1109/MITS.2012.2217995
Kemeny, A., & Panerai, F. (2003). Evaluating perception in driving simulation experiments. Trends in Cognitive
Sciences, 7(1), 31–37. doi:10.1016/S1364-6613(02)00011-6
Mine, M. R. (1993). Characterization of end-to-end delays in head-mounted display systems. Technical Report. Chapel Hill, North Carolina, USA: University of North Carolina at Chapel Hill.
OpenSceneGraph. (2015). The OpenSceneGraph Project Website. Retrieved April 8, 2015, from http://www.openscenegraph.org/
Papadakis, G., Mani, K., Coxon, M., & Koutroulis, E. (2012). The effect of tracking delay on awareness states in immersive virtual environments: an initial exploration. In Proceedings of the 10th International Conference on
Virtual Reality Continuum and Its Applications in Industry (pp. 475–482). Hong Kong, China: ACM Press.
Papadakis, G., Mania, K., & Koutroulis, E. (2011). A system to measure, control and minimize end-to-end head tracking latency in immersive simulations. In Proceedings of the 10th International Conference on Virtual
Reality Continuum and Its Applications in Industry (pp. 581–584). Hong Kong, China: ACM Press.
doi:10.1145/2087756.2087869
Sielhorst, T., Sa, W., Khamene, A., Sauer, F., & Navab, N. (2007). Measurement of absolute latency for video see through augmented reality. In Proceedings of the 6th IEEE and ACM International Symposium on Mixed and
Augmented Reality (pp. 215 – 220). Nara, Japan: IEEE. doi:10.1109/ISMAR.2007.4538850
Steed, A. (2008). A simple method for estimating the latency of interactive, real-time graphics simulations. In
Proceedings of the 2008 ACM symposium on Virtual reality software and technology - VRST ’08 (pp. 123–
129). Bordeaux, France: ACM Press. doi:10.1145/1450579.1450606
Swindells, C., Dill, J. C., & Booth, K. S. (2000). System lag tests for augmented and virtual environments. In
Proceedings of the 13th annual ACM symposium on User interface software and technology (pp. 161–170).