Contents lists available at ScienceDirect
Data
in
Brief
journal homepage: www.elsevier.com/locate/dib
Data
Article
Data
from
an
Our
Voice
citizen
science
initiative
in
neighborhoods
with
low
socioeconomic
status
in
Sweden:
A
proof
of
concept
for
collecting
complex
data
Katarina Bälter
a, b, ∗, Tove Rydenstam
a, Terence Fell
c, Abby C. King
d, e,
Benti Geleta Buli
aa Division of Public Health Sciences, Mälardalen University, Box 883, Västerås 721 23, Sweden b Department of Medical Epidemiology and Biostatistics, Karolinska Institutet, Stockholm, Sweden c Division of Political Science, Mälardalen University, Västerås, Sweden
d Department of Epidemiology and Population Health, Stanford University School of Medicine, Stanford, CA, USA e Stanford Prevention Research Center, Department of Medicine, Stanford University School of Medicine, Stanford, CA, USA
a
r
t
i
c
l
e
i
n
f
o
Article history: Received 28 June 2020 Revised 4 September 2020 Accepted 6 October 2020 Available online 9 October 2020Keywords: Citizen science Our Voice Socioeconomic status Physical activity Adolescents Built environment Social environment
a
b
s
t
r
a
c
t
This data article describes data from an OurVoice citizen sci- ence data collection aiming at identifying elements that fa- cilitate or hinder physical activity among adolescents in a medium sized city in Sweden. Twenty-four adolescents from two neighborhoods with low socioeconomic status in Swe- den used the Stanford Healthy Neighborhood Discovery Tool app on their phones to take photographs and record au- dio narratives of aspects of their neighborhood that they perceived as facilitating or hindering their physically activ- ity. In total, 186 photos of the neighborhood elements were taken by the adolescents and thereafter the research group categorized the photos into a final set of 16 elements of which 12 described the built environment and 4 the so- cial environment. The data collection included the combi- nation of the following data collected using the app: pho-
DOI of original article: 10.1016/j.healthplace.2020.102387
∗ Corresponding author at: Division of Public Health Sciences, Mälardalen University, Box 883, Västerås 721 23, Swe- den.
E-mail address: katarina.balter@mdh.se (K. Bälter).
Social media: (K. Bälter) https://doi.org/10.1016/j.dib.2020.106394
2352-3409/© 2020 The Authors. Published by Elsevier Inc. This is an open access article under the CC BY-NC-ND license ( http://creativecommons.org/licenses/by-nc-nd/4.0/ )
tographs, geocoded data of where the photographs were taken, recorded narratives describing the photographs, pos- itive and negative neighborhood attributes (portrayed as a happy or sad “smiley face”), and an 8-item survey. In addi- tion, we used official statistics from the City of Västerås de- scribing the two neighborhoods as well as the whole city. This data article is associated with the article titled “Us- ing citizen science to understand the prerequisites for phys- ical activity among adolescents in low socioeconomic status neighborhoods - the NESLA study”[1].
© 2020 The Authors. Published by Elsevier Inc. This is an open access article under the CC BY-NC-ND license ( http://creativecommons.org/licenses/by-nc-nd/4.0/)
SpecificationsTable
Subject area Public Health
More specific subject area Sustainable lifestyle and health among adolescents
Type of data Tables and figures
How data was acquired Data came from two sources:
a) Data were collected using The Stanford Healthy Neighborhood Discovery Tool (The Discovery Tool) by adolescents living in two neighborhoods with low socioeconomic status in the City of Västerås. b) Official statistics obtained from the City of Västerås.
Data format Raw, Analyzed
Parameters for data collection Participants were adolescents ages 16–19 years living in one of two neighborhoods with low socioeconomic status, Bäckby (neighborhood A) and Råby (neighborhood B), in the medium sized city of Västerås in Sweden. The second set of data included data on socioeconomic status of the population living in the same neighborhoods plus the whole city of Västerås.
Description of data collection Project flyers were posted in local schools, the city center, churches and community youth center. In addition, the research group visited the local church and community youth center and recruited participants onsite.
The dataset about socioeconomic status of the population living in the neighborhoods were obtained from the City of Västerås.
Data source location Mälardalen University, Sweden
Stanford University, USA
Data accessibility The raw data are available in the article
Related research article Author’s name:
Tove Rydenstam, Terence Fell, Benti Geleta Buli, Abby C. King, Katarina Bälter.
Title:
Using citizen science to understand the prerequisites for physical activity among adolescents in low socioeconomic status neighborhoods - The NESLA study
Journal
Health & Place, Volume 65, September 2020 (102,387). https://doi.org/10.1016/j.healthplace.2020.102387
ValueoftheData
• Researchers in the field of social and built environments, physical activity, and health can learn more about this novel method for assessing residents’ perceptions of complex environ- mental factors.
• Researchers involved in the Our Voice Global Citizen Science Network for health equity, hosted by Stanford University, will be able to use the de-identified data for future meta analyses of the generic survey obtained from the app as well as cross-project usability in- formation and other relevant descriptive data collected across data collections.
• Policy makers in the City of Västerås and other similar cities interested in the importance of the social and built environments for an active and healthy lifestyle could be inspired to use the data collection method in future local initiatives.
1. DataDescription
The data presented here comprise information collected by adolescents in two neighborhoods using the Discovery Tool mobile application and official statistics of neighborhood characteristics. The data collection was conducted in two low socioeconomic status (SES) neighborhoods, (neighborhood A with 8 320 inhabitants and neighborhood B with 6 477 inhabitants), located in the western part of the medium sized city of Västerås (147 417 inhabitants) in Sweden. The official statistics are collected continuously by the city and cover numerous variables, includ- ing educational levels, household disposable income, origin of birth, proportion of single-parent households, and proportion of people that were unemployed. These neighborhoods have a large proportion of foreign-born residents (51% and 55%, respectively) and the population has lower income levels compared to the city as a whole, as shown in Figs. 1and2, and additional raw data is found in supplement Table1[2].
The Discovery Tool mobile application was developed by the Healthy Aging Research and Technology Solutions (HARTS) research laboratory in 2013 at the Stanford University School of Medicine, CA as part of the OurVoice Citizen Science Initiative [3]. The app has been used in
Fig. 1. Official statistics of birth place, by neighborhood and for the city of Västerås as a whole, showing the proportion of residents born in Sweden and outside of Sweden, respectively (%).
Fig. 2. Official statistics of level of disposable income by neighborhood, showing the proportion of residents with low, medium and high disposable income, respectively (%).
Table 1
Participants’ perception of their influence on the decisions that affect their communities.
Variable ( n = 24) Gender Disagree Neutral Agree Total
This is a community where people support each other
Female 6 (33) 4 (22) 8 (44) 18 (75)
Male 2 (33) 2 (33) 2 (33) 6 (25)
Subtotal 8 (33) 6 (25) 10 (42) 24 (100) I can influence decisions that affect my
community
Female 4 (22) 9 (50) 5 (28) 18 (75)
Male 4 (67) 1 (17) 1 (17) 6 (25)
Subtotal 8 (33) 10 (42) 6 (25) 24 (100) By working together with others in this
community, we can influence decisions that affect this community
Female 4 (22) 6 (33) 8 (44) 18 (75)
Male 4 (67) 2 (33) 0 (0) 6 (25)
Subtotal 8 (33) 8 (33) 8 (33) 24 (100) People in my community know who to
talk to in order to make changes happen in our community
Female 5 (28) 7 (39) 6 (33) 18 (75)
Male 4 (67) 1 (7) 1 (7) 6 (25)
Subtotal 9 (38) 8 (33) 7 (29) 24 (100)
a number of citizen science initiatives in the US and around the world [4-9]and the neighbor- hood elements from the present data collection adds to the bulk of data from other initiatives of similar elements and enables future comparisons and meta analyses. In this data collection participants used the Discovery Tool to collect geo-coded photographs and audio narratives; data on positive and negative neighborhood attributes (portrayed as a happy or sad “smiley face” in the app); and GPS tracked walking routes. They also responded to an 8-item survey embedded in the app. The questions in the survey are generic and have been used in numerous OurVoice initiatives around the world, allowing for meta analyses of data. The questions include age, gen- der, education level, perceived health, self-efficacy, and perceptions about the community (e.g., sense of cohesion, ability to influence local decisions).
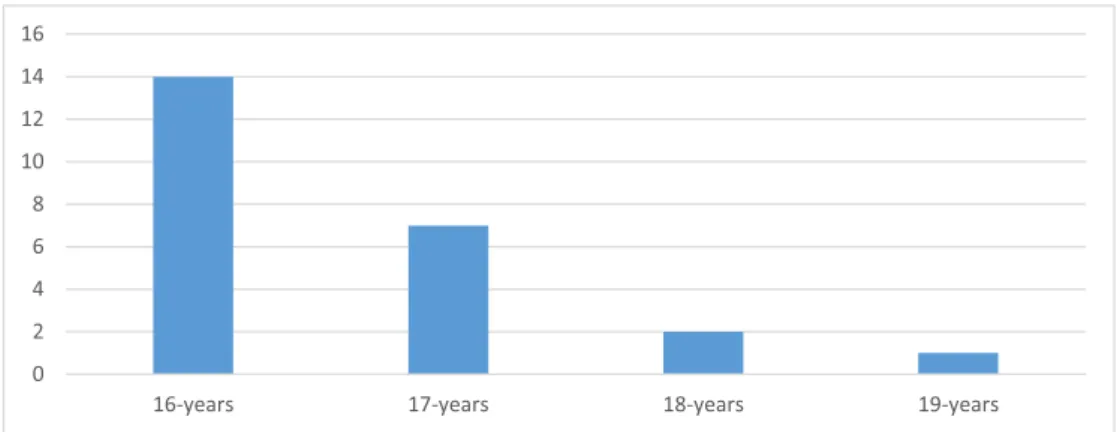
Twenty-four adolescents (mean age 16.6 ± 0.8 years; 18 females and 6 males) provided data for the present data collection ( n=11 in neighborhood A, n=13 in neighborhood B) and their age distribution is shown in Fig. 3. The self-reported health for all participants is shown in
Fig. 3. Age distribution of the participants in the NESLA data collection, showing the number of adolescents in each age category.
Fig. 4. Distribution of self-reported health among adolescents in the NESLA data collection, showing the proportion of adolescents with excellent/high, good and fair/poor health, respectively (%).
83% of the male adolescents rated their health as excellent or very good, while 50% of the fe- male adolescents rated their health as excellent or very good. In contrast, only 6% of the female and none of the male rated their health as fair, and none rated their health as poor.
Forty-two percent of the adolescents agreed that in their communities are people supporting each other, while one-third of them agreed that they could influence decisions that affect their communities by working together. Moreover, only about one-third (most of whom were female) agreed that people in their communities know who to talk to in order to make changes happen in their communities and 25% of the adolescents agreed that they could individually influence decisions that affect their communities (see Table1and supplemental Table 2).
In total, the adolescent citizen scientists took 186 photos of neighborhood elements that they felt affected their physical activity and coded them as either facilitators or barriers or both. Thereafter, research staff reviewed all photos, regardless of neighborhood, and categorized them into a final set of 16 different elements based on narratives. Supplement Table 3 presents the corresponding list of neighborhood elements based on smileys data (167 out of 186 photos had
smiley data). The rational for merging photos from two neighborhoods was that the two neigh- borhoods are situated next to each other, the distance from the center of one neighborhood to the center of the other one is 2 km and adolescents move between these two neighborhoods on a regular basis. Also, the number of citizen scientist from each neighborhood was small, and by merging photos into one set of phots, the precision increased.
2. ExperimentalDesign,MaterialsandMethods
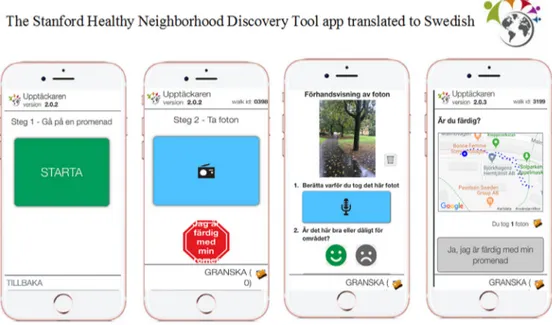
The Stanford Healthy Neighborhood Discovery Tool (Discovery Tool) [9]was translated from English to Swedish and culturally adjusted to fit Sweden in a collaboration between researchers at Stanford University and Mälardalen University. The Swedish version of the app was then tested in The Neighborhood, Sustainable Lifestyle and Health among Adolescents (NESLA) data collection in the fall of 2018. Citizen scientists were recruited by posting project flyers in local schools, the city center, churches and a community youth center. The most effective means of recruiting participants proved to be when staff from our research group visited the local com- munity youth center, recruited participants onsite, and conducted the neighborhood walk right away. Eligibility criteria included adolescents aged 16–19 years old who owned a smartphone compatible with the Discovery Tool (i.e., Iphone 5 or later versions, or Android 2.3). The data collection was approved by the Ethical Review Board of Uppsala and the data will be presented to local politicians and policy makers.
Prior to the neighborhood assessments, citizen scientists received written and oral informa- tion about the data collection and signed an informed consent form. Thereafter, the citizen sci- entists were instructed to install the Discovery Tool on their smartphones, go for a walk in their neighborhood, and use the app to take photographs and record audio narratives regarding fea- tures of the local environment that they perceived as either facilitators of or hindrances to be- ing physically active. They were instructed to include both features related to planned activities, such as participating in sports activities, as well as spontaneous activities such as active trans- portation. Groups of 7–14 citizen scientists were instructed at the same time and then walked in pairs or in groups of 3–4 persons, without the company of adults. After each photo was taken, the app prompted the citizen scientists to classify the neighborhood element as positive, nega- tive or both by selecting happy and sad smiley faces, see Fig.5. In order to gain more in-depth information about each neighborhood element, the app prompted citizen scientists to record an audio narrative explaining each photograph. After the walk, the participants uploaded the data from the app to a secure database.
Directly after the assessments, all citizen scientists gathered in a circle along with staff from our research group and we reviewed all photos on a computer screen. This gave the citizen sci- entists a chance to comment and discuss each photo, which gave the research group additional insights into the thoughts and opinions of the citizen scientists. From this group session, it was clear that the young participants were committed to their neighborhood and cared about its inhabitants, regardless of age. All participants were very engaged in the review of photos, and listened to what their peers had to say. One member of the research group took notes that were later transcribed and included as a source of data. The impression of the research group was that the Stanford Discovery Tool app is a useful tool for collecting data of complex contextual factors impacting physical activity in neighborhoods, and that the method appeals to adolescents. The method enabled the research group to establish a dialog with groups of local adolescents and the conversation expanded beyond the topic of physical activity, for example aspects of safety in the neighborhood. Some potential citizen scientists were hesitant to participate initially, and a gift card for the local movie theater was considered a positive incentive for participation. The overall impression of the research group afterwards, however, was that most citizen scientists had enjoyed the experience.
All data, i.e. smiley face data, geotagged photographs and narratives, and survey answers, were downloaded from the database to a local server at Mälardalen University for further anal- ysis. Audio narratives were transcribed verbatim, and additional comments that emerged during
Fig. 5. The translated version of The Stanford Healthy Neighborhood Discovery Tool app.
the group assessments were manually transferred to electronic format. Three of the co-authors (TR, TF, BGB) analyzed photographs, audio narratives and the additional comments and catego- rized the material into main categories. If a recording included more than one element, it was categorized into more than one category. Thereafter, four of the co-authors (TR, TF, BGB, KB) dis- cussed the categories, leading to the addition of a few categories whereas others were merged together before the research group agreed upon a final set of 16 elements, of which 4 were con- sidered social environment elements and 12 built environment elements. The quantitative data were analyzed descriptively using STATA version 13.1.
In this first-generation data collection among disadvantaged Swedish adolescents, a mobile environmental assessment app accompanied by a citizen science engagement process was found to be a feasible and attractive method for garnering youth participation in a community-based data collection and interpretation endeavor.
DeclarationofCompetingInterest
The authors declare no conflicts of interest.
Funding
This data collection was funded by a grant from the Social Contract, grant #. 2017/2710, at Mälardalen University.
Acknowledgment
We wish to acknowledge Ann W Banchoff at Stanford University for valuable support and input in the planning and execution of the data collection.
SupplementaryMaterials
Supplementary material associated with this article can be found in the online version at doi: 10.1016/j.dib.2020.106394.
References
[1] T. Rydenstam , T. Fell , B.G. Buli , A.C. King , K. Bälter , Using citizen science to understand the prerequisites for phys- ical activity among adolescents in low socioeconomic status neighborhoods - the NESLA study, Health & Place 65 (102387) (2020) 1–9 .
[2] Statistics Sweden. Statistics by subject area. [cited 2019 February]; Available from: https://www.scb.se/en/ finding-statistics/statistics-by-subject-area/population/population-composition/population-statistics/
[3] Stanford Medicine. Our Voice: Citizen Science for Health Equity [cited October 2020]; Available from: http://med. stanford.edu/ourvoice.html .
[4] S.J. Winter , L. Goldman Rosas , O. Padilla Romero , J.L. Sheats , M.P. Buman , C. Baker , et al. , Using Citizen Scientists to Gather, Analyze, and Disseminate Information About Neighborhood Features That Affect Active Living, J Immigr Minor Health 18 (5) (2016) 1126–1138 .
[5] A .G. Tuckett , A . Freeman , S. Hetherington , P.A . Gardiner , A .C. King , et al. , Older Adults Using Our Voice Citizen Science to Create Change in Their Neighborhood Environment, Int J Environ Res Public Health 15 (12) (2018) 1–17 . [6] J.L. Sheats , S.J. Winter , P. Padilla Romero , A.C. King , FEAST: Empowering Community Residents to Use Technology to
Assess and Advocate for Healthy Food Environments, J Urban Health 94 (2) (2017) 180–189 .
[7] A.C. King , S.J. Winter , J.L. Sheats , L.G. Rosas , M.P. Buman , D. Salvo , et al. , Leveraging Citizen Science and Information Technology for Population Physical Activity Promotion, Transl J Am Coll Sports Med 1 (4) (2016) 30–44 .
[8] A.C. King , D.K. King , A. Banchoff, S. Solomonov , O.B. Natan , J. Hua , et al. , Employing Participatory Citizen Science Methods to Promote Age-Friendly Environments Worldwide, International Journal of Environmental Research and Public Health 17 (5) (2020) 1–30 1541 .
[9] M.P. Buman , S.J. Winter , J.L. Sheats , E.B. Hekler , J.J. Otten , L.A. Grieco , et al. , The Stanford Healthy Neighborhood Discovery Tool: a computerized tool to assess active living environments, Am J Prev Med 44 (4) (2013) e41–e47 .