Control of waste water treatment combined with irrigation
Erik Dahlquist 1, Eva Nordlander 1, Eva Thorin 1, Christian Wallin 1,2, Anders Avelin 1,2
ABB Process Industries AB, Västerås, Sweden 1 School of Business, Society and Engineering, Future
Energy Center, Mälardalen University, Västerås, Sweden 2
ABSTRACT
In waste water treatment using biological treatment processes normally phosphorous, nitrous compounds as well as organic matter are removed. It is also important to remove or kill pathogens that otherwise could cause diseases. The surplus of bio-sludge is used to produce biogas. In the paper four different alternatives for system design and operations of systems was discussed. The alternatives integrates the waste water treatment and irrigation of farmland using the water taken out from different positions in the waste water treatment plant.
INTRODUCTION
Irrigation is becoming more important globally as water has become a scarce resource. By using waste water (WW) the nutrients in the wastewater (phosphorous and nitrogen-compounds) can be used as fertilizers . At the same time it is necessary to manage pathogens as well as toxic substance to avoid spreading diseases and harmful substances through the crops. The water can be taken out at different positions in the Waste water treatment plant (WWTP). Depending on the demand of water respectively nutrients different outtakes can be feasible during different situations over the year. In figure 1 several different layouts have been made for different options for waste water treatment. The first step is pre-sedimentation treatment where solid material is settled. A precipitating agent, such as FeCl3, could added to be able to separate smaller particles.
Adition of a precipation agent may lead to a deficiency of carbon for the later activated sludge process. Extra carbon source can be from either reject water or addition of e.g. methanol or glycol. This will enhance the denitrification in the activated sludge (AS) step. Most of the PO4 will be
removed in the form of FePO4. This will be digested in the anaerobic digester, but still most of the
phosphorous (P) will be removed as FePO4 in the residues after the digestion.
If no metal salt is added only large particles will be removed, there is still several alternatives for the following process steps. There could be either an anoxic or anaerob steps followed by aeration. This will be good both for biological removal of P- and N-compounds as well as denitrification in the aerobic step. To build as much PO4 as possible into biomaterial, microalgae could be included, as
algae are good at incorporating the PO4 (Anbalagan et al, 2017). The microalgae also produce O2,
which would reduce the demand for aeration. The drawback is that microalgae need sunlight or artificial lighting and the reaction rate might also be lower. Microalgae was not included in this, although it might be interesting in the future.
The sludge is normally separated after the biological processes and part of it recirculated, while the rest is anaerobically digested to produce biogas (which consist mostly of methane). The sludge can either be concentration before or after the digestion. The resulting liquid, can either be recirculated to before the biological processes, or first be treated with e.g. nano- or reverse osmosis filtration. Filtration can be organic acids (NF) or even ammoniac (RO). The permeate water will be quite lean and not add burden to the biological processes. Levlin and Hultman (2010) have described how PO4
could be recovered by precipitating it with CaO to form CaPO4. This could be an alternative for
storing PO4 in a compact way. Toomiste et al (2010) have followed TP (total P) respectively DP
(Dissolved P) through the different processes in the WWTP. Of the TP in the reject water from the digester 90% is dissolved, and thus in the liquid phase. Morse et al (1998) shows that anaerobic conditions can release the biologically bound PO4.
Figure 1. A general layout of four different cases for a WWTP
Concerning nitrogen balance Kanders (2019) has studied both normal activated sludge processes and those with anammox-bacteria. It is assumed that approximately 40 % of the incoming NH4 is built in
to the sludge microorganisms, while 40% is removed to air as N2. If anammox is used half of the
electricity demand of the aeration could be, however a solid matrix where the bacteria can grow and form a film is needed. Kanders (2019) has primarily investigated how the anammox can be utilized for the reject water where the concentrations of ammonium is high and the volume flow much lower (only approximately 1 % of the in-flow).
To combine WWT with irrigation water and sludge can be taken out from different positions in the WWT process. Most heavy metals should be in the solute. It would be interesting to wash the filter cake to wash out the metal ions. These then can be removed by absorption in e.g. an ion-exchanger. In the denitrification also N2O may be formed. By controlling the pH to above 7.6 almost no N2O was formed while a lot was formed at pH6 according to Desloover et al (2012) and Kanders (2019). The solid residues after the fermentation also should be recirculated to the farmland.
Anoxic
Aerated
Digester
FeCL3 PolishSeparation
Dewatering
All Solid residues NH4,PO4
Split 50%
Pre-sedimentation
FePO4
NF/RO Reject water
FeCL3
Air
CHx recycled sludge 65%All
Disc filter
To Farmland
3
η
TOC = 90%η
PO4 = 95%η
NH4 = 40%η
Denit = 40%η
PO4 = 55%Residues 40% solids, 10% liquid org
η
Biogas = 50%1
4
2
4
1
3
4
2
4
2
MODELLING
From a modeling perspective primarily material and energy balances has developed. They are in reality semi steady state as steady state balances are calculated for a given inflow of water and TOC (Total Organic Carbon), TP and TN (Total Nitrogen). For different situations a new balance is
calculated. In this paper four different cases have been studied.
This includes continuity equations for massflow (m) times concentration (x) for each stream in (n) and stream out (k):
∑ 𝑚𝑛𝑖 𝑖,𝑖𝑛𝑥𝑖,𝑖𝑛 = ∑ 𝑚𝑘𝑖 𝑖,𝑜𝑢𝑡𝑥𝑖,𝑜𝑢𝑡 [1]
The energy used in activated sludge processes are mainly electricity for aeration. In Mizuta &
Shimada (2010) a benchmark has been made for different wastewater treatment plants (WWTP) and found that in Japan 0.30-1.89 kWh/m3 was used for aeration. The main difference was depending
on the size of the plant, and thereby the efficiency. Soares et al (2017) present the figure 0.3-0.6 kWh/m3 in conventional activated sludge processes, which is in the lower range of what Mizuta
and Shimada presented, for WWTPs in Brazil. Enerwater (2015) reports that 1 % of electric power in Germany is for WWT in some 10 000 WWTPs. The study included 369 WWTPs in EU, representing the treatment of about 15,742,816 PE and a total energy consumption of 1,736,735 kWh/day, was performed. Assumption was 120 gCOD/(PE*d) in EU and 160 gCOD/PE in the US. A specific energy use of 0.13 kWh/m3 was found for larger plants, while for smaller plants values up to
5.5 kWh/m3 could be seen. 2000 kWh/(PE*y) could be for smaller plants, while larger plants have in
the range 20 to 60 kWh/(PE*y). This can be summarized in some key values for big WWTPs: 0.28-0.61
kWh/m3 , 27.4-47.9 kWh/PE*y and 0.55-1.10 kWh/kgCODrem.
A value of value 0.55 kWh/kg COD was used, which means approximately 1,8 kWh/kg TOC if the following conversion formula is used
COD= 49.2+3*TOC [2]
from Dubber & Gray (2010). They have developed this from a number of different influent water. The electric demand is then
kWel = kg biomass TOC/s * 1.8 kWh/kg TOC [3]
For biogas production it was assumed that the biomass to have the formula C5H7O2N + PO4 and the
energy content in the biomass is 21.2 MJ/kg. Sludge is taken to a digester where anaerobic
fermentation convert approximately 50% (ηbiogas =0,5 ) of the organic material to biogas, which was
assumed to consist of 65% CH4 and 35% CO2.
kWCH4 = kg biomass TOC to digester/s *ηbiogas * 0.65 [4]
The water flow has just been given for the in-flow, as the concentrations can vary a lot. As there will always be cleaned effluent water that can be used, this is not a limiting resource and thus is
neglected in the mass balances.
The mass balance has been evaluated for the four different cases based on assumption of 3600 m3/h (3600 ton/h) inflow water and the following values have been used for separation or reactivity efficiencies: ηpre,TOC , η Pre,PO4 andηpre,NH4 = 20% case 1, 3 and 4, while 35% for case 2with ηpre,PO4=
>95%; η AS,TOC = 90%; η AS,PO4 = 95%, η AS,NH4,sep = 40%, η AS,NH4,denit = 40%, sludge recirculation 65%. In
STUDIED CASES
Four different cases were studied, with wastewater from different positions in the WWTP. An inflow of 1 m3/s was used (corresponding to 500 000 PE) with 224 mgTOC/l or 720 mgCOD/l in the inflow.
The four cases are described below:
Case 1: This is the reference case without addition of FeCl3 to the pre-treatment step, but with polishing with FeCl3 after the activated sludge . All reject water is recycled back before the AS. Case 2: In this case FeCl3 is added before the pre-sedimentation to precipitate most of the PO4 and significant amount of TOC and NH4 as well. This is sent to fermentation. Reject water from the separation after the digester is filtered in a nano membrane filter and organics is recycled to the AS while permeate with PO4, K and NH4 is sent to the farmland. Totally treated water is used for irrigation as much as needed with low risk for polluting crops, but also we do not add any burden from reject water with respect to NH4 and PO4 to the AS in the WWTP.
Case 3: No pre-precipitation with FeCl3 before pre-sedimenation, but addition after the AS for polishing. Use of reject water from the fermentation directly to the farmland. Here it should also be possible to remove heavy metals if needed from the liquid phase before distribution to the farmland. Case 4: Take out a significant part of influent water (50%) after the pre-sedimentation, after addition of FeCl3. Infectious microorganisms might be a problem if spread to growing plants if infectious species survive. Though low temperature or sun light at the field should kill most. Reject water is filtered in a membrane filter. Hydrocarbons are recycled from reject water (reject), while the permeate with NH4, PO4 and K is distributed to the farmland.
For case 1 and 3 a pre-separation of coarse material without any chemical addition was assumed, but with addition of FeCl3 in case 2 and 4. Pre-separation was followed by an activated sludge (AS)
process with anoxic and aerated vessels and after that sedimentation. 65% of the sludge is
recirculated while 35% goes to biogas production in an anaerobic digestion process. The sludge after the digestion goes to farmland after dewatering. The reject water after separation (press or
centrifuge) goes back to the AS process in case 1, but is separated in a NF (+ RO) -filter in case 2 and 3. The filtrate from the NF filter goes to farmland. If there is a RO filter after the NF, the reject from the NF goes to the AS as a carbon source in case 2(where there otherwise will be a deficiency of organics), while the permeate goes back to the process or is used as irrigation water (this will be pathogen free, and can be used also for vegetables). In case 3 the reject water goes back directly to the farmland without any NF/RO. The efficiency η in the different process steps are seen also in figure 1.The following values has been used for the efficiencies: ηpre,TOC , η Pre,PO4 andηpre,NH4 = 20%
case 1, 3 and 4, while 35% for case 2with ηpre,PO4= >95%; η AS,TOC = 90%; η AS,PO4 = 95%, η AS,NH4,sep =
40%, η AS,NH4,denit = 40%, sludge recirculation 65%. Figure 1 illustrates the different flows for the four
cases.
There is also one other issue to consider. Aside of N2 also N2O may be formed in the biological
process? By controlling the pH to above 7.6 almost no N2O was formed while a lot was formed at pH
= 6 (Desloover et al 2012 and Kanders 2019).
RESULTS AND DISCUSSION
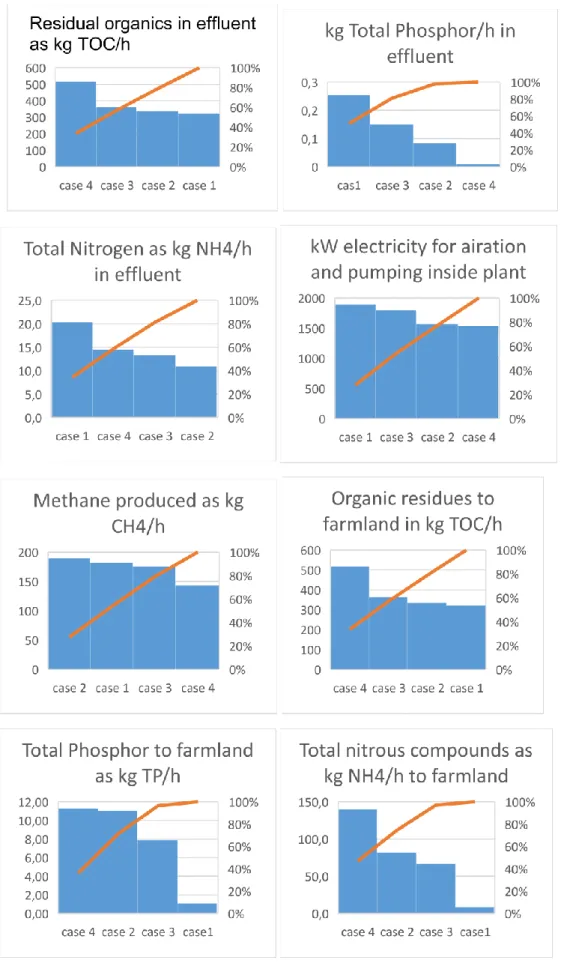
The mass balance for the four cases 1-4 can be seen in table 1. In figure two data from table 1 are presented for the four cases with one variable at a time, sorting from highest to lowest value.
Table 1. Material balance for the four operational/configurational cases from simulation
The hydrocarbons sent to the farmland will be much higher (516 kgTOC/h) for case 4 than the other three cases (310-336 kgTOC/h), but less methane will be produced.
From figure 2 it can can seen that there is more TOC in the organic effluent from case 4 but much more P in case 1 and 3, and more N-NH4 in case 1. Case 2 and 4 will have significantly lower
emissions of PO4 while case 2 is best for N-removal and case 4 best with respect to TOC in the effluent. On the other hand, the phosphate will be more biologically active in the soil at the farm land in case 1 and 3, as most is taken up in the biomass, and then released in the anaerobic fermentation. The FePO4 can be too stabile for efficient use in farming as a fertilizer, while the Phosphor bound in
the cells is much easier to release.
For electricity the dfference is relatively small although higher for case 1 and 3, while methane production is lowest in case 4, where a lot of the organics is sent to farmland directly, as seen as TOC/h to farmland. Concerning P to farmland as well as N-NH4 case 1 has the lowest distribution
while case 4 the highest on especially NH4.
total flow C5H7O2N PO4 N-comp
kg/h kg TOC/h FeCl3 at pre-sep kgTP/h kg NH4/h
case 1 case 2 case 3 case 4 cas1 case 2 case 3 case 4 case 1 case 2 case 3 case 4
Feed water 3600000 806 806 806 806 12 12 12 12 147 147 147 147 pre-sep η pre = 0,20 0,35 0,20 0,35 0,20 0,90 0,20 0,90 0,20 0,35 0,20 0,35 separated (sludge) 161 282 161 282 2,3 10,4 2,3 10,4 29 52 29 52 left to AS 645 524 645 524 9,22 1,15 9,22 1,15 118 96 118 96 AS total load 1023 831 1023 831 14,91 1,86 14,91 1,86 148 121 148 121 Split before AS 0,50 0,5 0,5 to Farmland 262 0,576 48
left to AS incl sludge recycle 432 0,9504 79
sludge sep eff η AS = 0,900 0,900 0,900 0,900 0,95 0,95 0,95 0,95 0,4 0,4 0,4 0,4
denitrific eff η AS,DENIT = 0,4 0,4 0,4 0,4
left after AS (water) 102 83 102 43 0,75 0,09 0,75 0,05 30 24 30 16 sludge (CH,P,NH4) 920 748 920 389 14,16 1,77 14,16 0,90 59 48 59 32 NH4 removed as N2 59 48 59 32 NH4 into sludge 59 48 59 32 Sludge recycle % 0,650 0,650 0,650 0,650 0,65 0,65 0,65 0,65 0,65 0,65 0,65 0,65 Sludge recycle 598 486 598 253 9,20 1,15 9,20 0,59 39 31 39 21 Sludge to fermentation 322 262 322 136 4,96 0,62 4,96 0,32 21 17 21 11 total sludge to fermentation 540 565 540 442 7,86 11,00 7,86 10,72 67 82 67 71 % conversion to biogas 0,50 0,50 0,50 0,50 % CH4 of biogas 0,65 0,65 0,65 0,65 % org in liquid 0,10 0,10 0,10 0,10 0,91 0,91 0,91 0,91 0,9 0,9 0,9 0,9 CH4 produced 175 184 175 144 CO2 produced 94 99 94 77 Residue to farmland 310 325 310 254 0,72 1,01 0,72 0,98 6,66 8,17 6,66 7,13 Reject water 54 56 54 44 7,14 9,99 7,14 9,74 60 74 60 64
Polish sep effic η POLISH = 0,55 0,25 0,55 0,55 0,8 0,1 0,8 0,8 0,55 0,55 0,55 0,55
left to effluent 46 62 46 19 0,15 0,08 0,15 0,01 13,4 10,9 13,4 7,1 sludge to fermentation 56 21 56 24 0,60 0,01 0,60 0,04 16,3 13,3 16,3 8,7
Figure 2 Comparison between the four cases with respect to effluent levels respectively distribution
to farmland of TOC, PO4 and NH4 as kg/h. Also kW electricity demanded and biogas produced as kg CH4/h.
All four cases can be implemented in the same WWTP with only small modifications, and in reality it is possible to switch between the different operational modes. It is mostly the addition of the nano membrane filter that differ this plant from “normal ones”. This can be useful when it comes to optimization related to the use of water for irrigation and addition of “natural” fertilizers as
especially dissolved NH4 and PO4. Case 1,2 and 3 can absolutely be implemented while case 4 may be
sensitive from a hygienic perspective. This water should not be distributed in crops close to harvest, to avoid risks for spreading infectious diseases. It is not only possible to switch between the different alternatives, but also variants in between can be used.
Figure 3. Example of Demand - supply of water and nutrients over a year
The optimization should be made to fulfill the crop demand as far as possible. In figure 3 an example of demand and supply of water respectively supply of water and nutrients can be seen. The water can be cleaned effluent to meet the water demand, while the nutrient supply is covered by operating the plant as suitable with the different operational modes in the four cases. You first cover the nutrient demand, and then fill up with cleaned water to fulfil the water demand. When the crops are very small irrigation is important. Later on nutrient will be more important to stimulate the growth rate. By switching between the different alternatives water with different amount of nutrients can be taken out, depending on these different demands over the growth season. If the NH4 and PO4 should
be used far away from the WWTP it might be interesting to precipitate these with MgO or CaO. The product then could be transported and stored in a relatively compact way Levlin and Hultman (2003) indicate an efficiency of at least 60% for Magnesiumammoniumphosphate can be achieved from reject water.
The electricity demand and the production of biogas are two other variables to include in an optimization to govern what alternative to use at different times depending on the value of electricity respectively methane during different situations.
The control can be based on mass balance simulation of the process that can be made on-line continuously. By combining this with prediction of demands from the farmland production and distribution, plans can be made for how to optimize both plant operation and irrigation. By
combining with cost calculations for chemicals, electricity and value of biogas and nutrients produced economic optimization could also be made
0 10 20 30 40 50 60
Jan feb mar apr may jun jul aug sep oct nov dec
Demand supply of water and nutrients over a year
CONCLUSIONS
In this paper it was discussed how the WWTP can be controlled for irregation with respect to different ways of operations by simulating different ways of operations. These varying operations mode can be determined from the demand for water respectively nutrients like NH4 and PO4 over the growth season. The simulation can be made on-line for continuously follow the balances. By combining this with prediction of demands from the farmland production and distribution, plans can be made for how to optimize both plant operation and irrigation. By combining with cost calculations for chemicals, electricity and value of biogas and nutrients produced economic optimization can also be made.
Acknowledgements: This study has been done within the international project Control4Reuse with
partners from Sweden, France and Brazil. The project is part of the IC4WATER programme, in the frame of the collaborative international consortium of the 2017 call of the Water Challenges for a Changing World Joint Programme Initiative (Water JPI). The authors would like to thank Formas (Project No 2018-02213) for funding the Swedish part of this project, within the above mentioned initiative. It is also part of the EU Horizon 2020 SPIRE-2 project FUDIPO.
REFERENCES
Anbalagan A, Schwede S, Lindberg CF, Nehrenheim E: Continuous microalgae-activated sludge flocs for remediation of municipal wastewater under low temperature. 1st IWA Conference on Algal
Tchnologies for Wastewater Treatment and Resource Recovery, UNESCO-IHE, Delft, Netherlands (2017).
Dubber D, Gray NF.: Replacement of chemical oxygen demand (COD) with total organic carbon (TOC) for monitoring wastewater treatment performance to minimize disposal of toxic analytical waste. J Environ Sci Health A Tox Hazard Subst Environ Eng. 2010 Oct;45(12):1595-600. doi:
10.1080/10934529.2010.506116.
Enerwater : Standard method and online tool for assessing and improving the energy efficiency of waste water treatment plants, H2020-EE-2014-3-MarketUptake. 2015.
Kanders Linda: Start-up and operational strategies for deammonification plants. PhD thesis, Malardalen University Press, June 2019.
Levlin E. and B. Hultman: Phosphorus recovery from phosphate rich sidestreams in wastewater treatment plants. (2003) https://www.kth.se/polopoly_fs/1.650637.1550156562!/JPS10s47.pdf
Mizuta K, Shimada M: Benchmarking energy consumption in municipal wastewater treatment plants in Japan. Water Sci Technol. 2010;62(10):2256-62. doi: 10.2166/wst.2010.510.
Morse G.K, Brett S.W., Guy J.A., Lester J.N.: Review: Phosphorous removal and recovery technologies. The science of total environment 212, 1998, 69-81.
Renan Barroso Soares, Marina Santos Memelli , Regiane Pereira Roque , Ricardo Franci Gonçalves: Comparative Analysis of the Energy Consumption of Different Wastewater Treatment Plants. International Journal of Architecture, Arts and Applications 2017; 3(6): 79-86
Toomiste Hillar, Jüri Haller, Mait Kriipsalu and Valdo Kuusemets: Phosphorus balance at tartu wwtp, estonia. Conference proceedings Linnaeus ECO-TECH ´10 Kalmar, Sweden, November 22-24, 2010.
Desloover J., Vlaeminck S.E., Clauwaert P., Verstraete W., Boon N.: 2012. Strategies to mitigate N2O emissions from biological nitrogen removal systems. Curr. Opin. Biotecnology 23, p 474-482, https://doi.org/10.1016/j.copbio.2011.12.030