Terence McGarvey
Measurement of tyre width
and assembly type
(single or double tyre)
VTI r apport 899A | Measur ement of tyr www.vti.se/en/publications
VTI rapport 899A
Published 2016
VTI rapport 899A
Measurement of tyre width and assembly
type (single or double tyre)
Reg. No., VTI: TRV 2012-53335 Cover pictures: Terence McGarvey, VTI
Abstract
Data provided by VTI vehicle position surveys is only relevant to the right hand side of a vehicles front wheels. No tyre width or type information is available. As parameters such as wheel paths (centre point of a single or double tyre) are considered important, it was decided to test a new system that could also record tyre width and type.
However, measured tyre widths were narrower than expected. Initial thoughts are that this reduction is related to the shape of the tyre footprint. This means that results were not sufficiently accurate enough to distinguish between different sizes of tyres.
Although exact tyre widths could not be determined, it was still possible to determine if tyre types were either single or double. In reality, there are large differences between single tyre widths and double tyre total widths. As similar large differences existed in the survey data, distinguishing between single and double tyre configurations was relatively easy.
Approximately 30,650 vehicles were recorded and around 2,900 of these (9.5%) were classified as large goods vehicles (LGVs). Forty different types of vehicle were recorded.
The percentage split between single and double tyre types was around 64% single and 36% double.
Title: Measurement of tyre width and assembly type (single or double tyre)
Author: Terence McGarvey (VTI, www.orcid.org/0000-0002-6198-0888)
Publisher: Swedish National Road and Transport Research Institute (VTI) www.vti.se
Publication No.: VTI rapport 899A
Published: 2016
Reg. No., VTI: TRV 2012/53335
ISSN: 0347-6030
Project: Vehicle lateral position depending on road type and lane width Commissioned by: Swedish Transport Administration
Keywords: Tyre width, tyre type, single or double tyre, tyre assembly, vehicle position survey
VTI rapport 899A
Referat
Data från VTI:s positionsundersökningar är bara relevant för den högra sidan av framdäcken på varje registrerat fordon. Ingen information om däckbredd eller däcktyp finns tillgänglig. Eftersom
parametrar såsom hjulspår (mittpunkten för singel eller parmonterade däck) anses viktiga, beslutades att ett nytt mätsystem som även kan registrera däckbredd och däcktyp skulle utvecklas.
De uppmätta däckbredderna var dock smalare än förväntat. Det antas att detta fel är relaterat till formen på däckets kontaktyta. Detta innebar att de uppmätta däckbredderna inte var tillräckligt exakta för att särskilja olika däckstorlekar.
Även om exakt däckbredd inte kunde fastställas var det ändå möjligt att fastställa om det rörde sig om enkla eller parmonterade däck. I verkligheten är det stora skillnader mellan bredden på enkla däck och parmonterade däck. Eftersom liknande skillnader återfanns i mätdata var det relativt lätt att skilja mellan enkla och dubbla däckkonfigurationer.
Cirka 30 650 fordon registrerades och av dessa klassificerades runt 2 900 (9,5 %) som tunga lastbilar. Fyrtio olika typer av fordon registrerades. Åtta fordonstyper utgjorde cirka 89 % av den tunga
lastbilstrafiken på E4 vid Linköping och 83 % av trafiken på riksväg 34 vid Skeda Udde. Procentuellt utgjordes runt 64 % av enkla däck och 36 % av dubbla däck.
Titel: Mätning av däckbredd och typ (singel- eller parmonterade) Författare: Terence McGarvey (VTI, www.orcid.org/0000-0002-6198-0888) Utgivare: VTI, Statens väg och transportforskningsinstitut
www.vti.se
Serie och nr: VTI Rapport 899A
Utgivningsår: 2016
VTI:s diarienr: TRV 2012/53335
ISSN: 0347-6030
Projektnamn: Fordons variation i sidled beroende på vägtyp och körfältsbredd Uppdragsgivare: Trafikverket
Nyckelord: Däckbredd, däcktyp, singel eller parmonterade däck, fordonposition
Språk: Engelska
Foreword
This project was funded by Trafikverket, the Swedish Transport Administration.
Investigations, data analysis, photographing and report writing have been carried out by Terence McGarvey (VTI).
Measurement system development and testing was performed by Håkan Wilhelmsson (VTI). Thanks are also extended Carl Södergren (VTI) who helped to carry out the tyre measurement surveys.
Linköping, June 2016
Terence McGarvey Project leader
VTI rapport 899A
Process for quality review
Internal peer review was performed on 27 December 2105 by Thomas Lundberg. Terence McGarvey has made alterations to the final manuscript of the report. The research director Anita Ihs examined and approved the report for publication on 3 June 2016. The conclusions and recommendations expressed are the author’s/authors’ and do not necessarily reflect VTI’s opinion as an authority.
Process för kvalitetsgranskning
Intern peer review har genomförts 27 december 2015 av Thomas Lundberg. Terence McGarvey har genomfört justeringar av slutligt rapportmanus. Forskningschef Anita Ihs har därefter granskat och godkänt publikationen för publicering 3 juni 2016. De slutsatser och rekommenda-tioner som uttrycks är författarens/författarnas egna och speglar inte nödvändigtvis myndigheten VTI:s uppfattning.
Contents
Summary ... 9 Sammanfattning ... 11 1. Introduction ... 13 2. Aim ... 14 3. Method ... 153.1. Existing position measurement ... 15
3.2. New position measurement ... 15
3.3. Signal generation ... 15
3.4. Selection of suitable survey site ... 16
4. Results ... 19
4.1. Survey data ... 19
4.2. Tyre widths ... 19
4.3. Tyre type – single or double tyre ... 20
5. Conclusions ... 23
References ... 25
Appendix 1 ... 27
Summary
Measurement of tyre width and assembly type (single or double tyre) by Terence McGarvey (VTI)
In previous work (McGarvey, 2016) variations of vehicle lateral position and lateral wander were studied. However, data obtained during the position surveys was only relevant to the right hand side of the front wheels of each recorded vehicle. No tyre width or assembly type
information was available. As parameters such as wheel paths (centre point of a single or double tyre) are considered important and affect how stresses and strains are transmitted and distributed to the pavement structure, it was decided to develop and test a new measurement system that would also record tyre width and assembly type on every vehicle axle.
Limitations with the existing measurement system meant that position data was only available for the right hand side of a vehicles front tyres. To try and overcome this limitation,
modifications were made to the system so that the left hand side position of each tyre (or pair of tyres) could also be captured. Comparisons, between left and right hand side positions, were then carried out and these produced values that could be associated with tyre widths and either single or double tyre configurations.
However, measured widths were narrower than expected. For example, an average car tyre should have a surface contact width of around 175 millimetres. Measured widths averaged around 130 millimetres. Initial thoughts are that this measurement reduction is related to the shape of the tyre footprint. If the footprint was exactly rectangular in shape, accurate tyre width measurements would be recorded. However, as tyre footprints tend to have rounded corners, pulse signals generated in the diagonal cable may not have been created exactly at the tyre edge. This means that the measured tyre widths were not sufficiently accurate enough to distinguish between different sizes of tyres.
Although exact tyre widths could not be determined, it was still possible to determine if tyre assemblies were either single or double. In reality, there are large differences between single tyre widths and double tyre total widths. As similar large differences existed in the survey data, distinguishing between single and double tyre configurations was relatively easy.
Approximately 30,650 vehicles were recorded and around 2,900 of these (9.5%) were classified as large goods vehicles (LGVs). Forty different types of vehicles were recorded. Eight vehicle types accounted for approximately 89% of all LGV traffic on the E4, Linköping and 83% of traffic on Road 34, Skeda Udde.
The percentage split between single and double tyre assemblies was around 64% single and 36% double.
Sammanfattning
Mätning av däckbredd och typ (singel- eller parmonterade) av Terence McGarvey (VTI)
Variationer i lateral fordonsposition och sidolägesfördelning har studerats i en tidigare rapport (McGarvey, 2016). Data från dessa positionsundersökningar var dock bara relevant för framhjulens högersida på varje registrerat fordon. Ingen information om däckbredd eller däcktyp fanns tillgänglig. Eftersom dessa parametrar anses viktiga och påverkar hur spänningar och töjningar överförs och distribueras till överbyggnadsstrukturen bestämdes att ett nytt mätsystem för att registrera däckbredd och däcktyp på varje fordonsaxel skulle utvecklas. Begränsningar i det existerande mätsystemet innebar att positionsdata bara fanns tillgänglig för den högra sidan av däcken på de registrerade fordonen. I ett försök att åtgärda dessa
begränsningar och fånga varje däcks (eller däckpars) vänstra position introducerades en till diagonal kabel. Jämförelser mellan vänster- och högerpositioner gjordes sedan. Dessa gav värden som kunde relateras till däckbredd och enkla eller dubbla däckkonfigurationer. De uppmätta däckbredderna var dock smalare än förväntat. Bredden på kontaktytan för ett genomsnittligt däck ska till exempel vara runt 175 millimeter. Medelvärdet för de uppmätta däckbredderna var runt 130 millimeter. Det antas att detta fel är relaterat till formen på däckets kontaktyta. Om denna var helt rektangulär skulle korrekta mätningar av däckbredd registreras. Eftersom däckavtryck tenderar att ha rundade hörn är det möjligt att pulssignaler som genererats i den diagonala kabeln inte uppstått exakt vid däckets kant. Detta innebar att de uppmätta däckbredderna inte var tillräckligt exakta för att särskilja olika däckstorlekar.
Även om exakt däckbredd inte kunde fastställas var det ändå möjligt att fastställa om det rörde sig om enkla eller parmonterade däck. I verkligheten är det stora skillnader mellan bredden på enkla däck och parmonterade däck. Eftersom liknande skillnader återfanns i mätdata var det relativt lätt att skilja mellan enkla och dubbla däckkonfigurationer.
Cirka 30 650 fordon registrerades och av dessa klassificerades runt 2 900 (9,5 %) som tunga lastbilar. Fyrtio olika typer av fordon registrerades. Åtta fordonstyper utgjorde cirka 89 % av den tunga lastbilstrafiken på E4 vid Linköping och 83 % av trafiken på riksväg 34 vid Skeda Udde.
1.
Introduction
Research carried out for COST 334, Effects of Wide Single Tyres and Dual Tyres, states that pavement distress modes react differently to changes in influencing factors such as tyre type (double or single wheel assemblies) (COST Action 334, 2001). The stress and strain conditions near the surface of the pavement are strongly influenced by the contact stresses and their distribution in the tyre pavement interface. On the other hand, stresses and strains deeper in the structure are mainly influenced by the total load.
This means that differences in contact stress distribution, due to different tyre widths and assembly types, will have most influence in the upper layers of a pavement structure. In thin and medium pavement structures, this will affect the rate of secondary rutting and fatigue cracking and should be considered during structural design. For thick pavement structures, effects will be confined within the bituminous layers and affect the rate of primary rutting.
In previous work (McGarvey, 2016) variations of vehicle lateral position and amount of lateral wander were studied. However, data obtained during the position surveys was only relevant to the right hand side of the front wheels of each recorded vehicle. No tyre width or assembly type information was available.
As parameters such as wheel paths (centre point of a single or double tyre) are considered to be important and affect how stresses and strains are transmitted and distributed to the pavement structure, it was decided to develop and test a new measurement system that would record tyre position, tyre width, and tyre assembly type on every vehicle axle.
14 VTI rapport 899A
2.
Aim
The objective in this project was to develop and test a new position measurement system so that tyre position, tyre width, and tyre assembly type could be determined for every vehicle axle.
3.
Method
3.1.
Existing position measurement
The existing measurement technique uses three coaxial cables which are fixed to the road surface in a reverse “Z” type formation. When a tyre runs over a cable, a triboelectric effect produces electron migration in the cable. The charge from the electron migration can be amplified and converted to a voltage pulse. Timings of voltage pulses can be analysed and used to produce a lateral position and code for each passing vehicle.
Limitations with the “Z” measurement technique mean that position data is only available for the right hand side of the vehicles tyres. As no information on tyre width or type is collected, exact wheel paths positions cannot be calculated.
Figure 1. Limitation of existing position measurement system.
3.2.
New position measurement
To try and overcome these limitations, an additional diagonal cable was introduced in order to capture the left hand side position of each tyre (or pair of tyres). Comparisons, between left and right hand side tyre positions, could then be carried out to produce tyre width values.
16 VTI rapport 899A during signal processing and reduce data quality and accuracy. It was therefore decided to remove the requirement to measure the offside tyre position and restrict measurements to the nearside wheel path.
3.4.
Selection of suitable survey site
Even though measurements were restricted to the nearside wheel path, there was still a risk that some offside tyre positions would be captured. This would occur if there was a sufficient amount of vehicle lateral wander. Wrong pulse signals, from the offside tyres, would be generated in the diagonal cables and reduce data accuracy.
To confirm where in a lane vehicles are driven, vehicle front tyre average positions ( 𝑥 ) and standard deviation ( s ) can be used along with an assumed tyre contact width to estimate the probability of where in the road vehicles are driven (McGarvey, 2016).
Figure 2. Average tyre position ( 𝑥 ), tyre width (assumed) and standard deviations (s).
Distribution density curves were consistent with normal distribution and satisfy the following: 68% of observations fall within 1 deviation of the mean,
95% of observations fall within 2 deviations of the mean, and 99.7% of observations fall within 3 deviations of the mean.
This means that, if the three sigma rule is applied, almost all tyre positions will be contained within three standard deviations of the average tyre position. Even with near normal
Using this method, it was possible to check the amount of vehicle lateral wander on previous survey sites and determine the extent of tyre overlap.
Example 1
In the following example, the average front tyre position (full lines) and three standard deviations (dashed lines) are shown for three vehicle groups on a conventional road type:
light vehicles with a track width of 1.5 m (green),
commercial vehicles with a track width of 1.8 m (light blue), and commercial vehicles with a track width of 2.1 m (dark blue).
V e rg e R o a d e d g e Light V ehicle: Std Deviations 318 (L) , 311 (R) Approx Track Width 1.5m Front Tyre Contact 175mm
Nearside Tyre Lateral Wander Range
LGV Group 1:
Std Deviations 295 (L) , 306 (R) Approx Track Width 1.8m Front Tyre Contact 265mm
LGV Group 2 :
Std Deviations 238 (L) , 214 (R) Approx Track Width 2.1m Front Tyre Contact 355mm
Overlap Possible Offside Tyre
Lateral Wander Range
18 VTI rapport 899A Example 2
In the following example, the average front tyre position (full lines) and three standard deviations (dashed lines) are shown for three vehicle groups on a 9 m wide, barrier separated road type:
light vehicles with a track width of 1.5 m (green),
commercial vehicles with a track width of 1.8 m (light blue), and commercial vehicles with a track width of 2.1 m (dark blue).
Figure 4. Road 34, barrier separated road type – no tyre overlap.
In this case, the amount of lateral wander is significantly lower and no overlapping between offside and nearside tyres occurs.
Performing the test trial on this type of road design would therefore be suitable and reduce the risk of tyre overlap.
Road 34 (1+1 road)
Light Vehicle:
Std Deviations 192 (L) , 193 (R) Approx Track Width 1.5m Front Tyre Contact 175mm
LGV Group 1:
Std Deviations 197 (L) , 190 (R) Approx Track Width 1.8m Front Tyre Contact 265mm
LGV Group 2 :
Std Deviations 142 (L) , 150 (R) Approx Track Width 2.1m Front Tyre Contact 355mm
No overlap Possible Offside Tyre
Lateral Wander Range
Nearside Tyre Lateral Wander Range
4.
Results
4.1.
Survey data
The trial survey was carried out on National Road 34, south of Linköping, between 12 and 22 September 2014. The road is a 9 m wide, 1+1 barrier separated type with an AADT of 2675. Approximately 30,650 vehicles were recorded. Around 2900 of these (9.5%) were classified as large goods vehicles (LGVs).
4.2.
Tyre widths
Tyre widths measured during the survey were narrower than expected. For example, an average car tyre should have a surface contact width of around 175 mm. Measured widths averaged around 130 mm.
Initial thoughts are that this reduction could be related to the shape of the tyre footprint. If the footprint was rectangular in shape, accurate tyre width measurements would be recorded. However, as tyre footprints tend to have rounded corners, pulse signals generated in the diagonal cable may not be created by the tyres outer edge.
20 VTI rapport 899A In addition, variations in vehicle load and tyre pressures can also affect the shape of the tyre footprint. For example, over-inflation will decrease the footprint length at the edges and produce a more rounded footprint shape.
This meant that the measured tyre widths were not sufficiently accurate to distinguish between different sizes of tyres. It may, however, still be possible to use the measured widths to calculate the actual wheel path of the tyre. Dividing the measured width in half and adding it to the right hand side position should produce an accurate wheel path position.
4.3.
Tyre type – single or double tyre
Despite the fact that exact tyre widths could not be determined, it was still possible to determine if tyre assemblies were single tyre or double tyre.
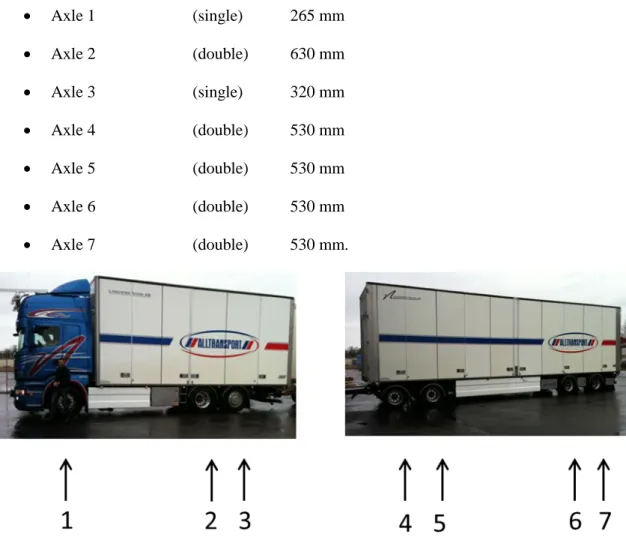
The following tyre widths (contact width) were measured manually (three axle truck with four axle trailer): Axle 1 (single) 265 mm Axle 2 (double) 630 mm Axle 3 (single) 320 mm Axle 4 (double) 530 mm Axle 5 (double) 530 mm Axle 6 (double) 530 mm Axle 7 (double) 530 mm.
Figure 6. Three axle truck with four axle trailer (category code 234).
In this case, single tyre widths varied between 265 mm and 320 mm. Double assembly tyres had a total width between 530 mm and 630 mm.
This meant that, in reality, there are large differences (210 mm) between single and double tyre assembly widths. If similar large differences existed in the survey data, distinguishing between single and double tyre configurations would be relatively easy.
In order to check this theory, data sets were created for each vehicle category. Categories were defined by distance between axles and number of axles and assigned with a vehicle code. Measured tyre widths, associated with each axle, were then plotted for each vehicle category code.
In the following example, Figure 7, measured tyre widths are shown for vehicles with category code 234, a three axle truck with four axle trailer.
Figure 7. Measured tyre widths – vehicle code 234 (7 axle).
From the above figure, clear differences in measured widths are apparent. Measurements can be split into two major groups:
Group 1 - between 0.20 m and 0.30 m, and Group 2 – between 0.45 m and 0.62 m.
If the first group is considered to be a single tyre and the second group is considered to be a double tyre assembly, the following conclusion, regarding single or double tyre distribution per axle, can be made for this type of vehicle.
22 VTI rapport 899A In Table 1 below, a summary of the measured tyre width results is given. In columns two and three, percentage splits, between single and double tyre configurations, are shown for the eight most common motorway vehicle category codes. Average split values have been applied to the remaining category codes. In columns four and seven, percentages of the total LGV traffic, for each vehicle category code, are shown. For comparison purposes, traffic data from a previous survey carried out on the E4 motorway is presented along with data from the trial site, Road 34. In columns five, six, eight and nine, the percentages of single and double tyre assemblies are given for the two road types.
For example, vehicle type 323 (highlighted) accounts for 22.0% of all LGV traffic on the E4 but only 4.6% of all LGV traffic on Road 34. In addition, this type of vehicle accounts for 16.9% of the single tyres and 5.1% of the double tyre assemblies driven on the E4.
Table 1. Vehicle category codes and percentages of single and double tyre assemblies.
In both cases, Road 34 and E4, the average percentage split between single and double tyre assemblies was around 64% single and 36% double.
Vehicle Code Single Tyre % Double Tyre % LGV traffic % Single Tyres % Double Tyres % LGV traffic % Single Tyres % Double Tyres % 234 37.0 63.0 24.0 8.9 15.1 27.5 10.2 17.3 323 77.0 23.0 22.0 16.9 5.1 4.6 3.5 1.1 22 88.0 12.0 17.9 15.8 2.1 35.1 30.9 4.2 335 61.0 39.0 7.0 4.3 2.7 1.8 1.1 0.7 224 53.0 47.0 5.0 2.7 2.4 2.9 1.5 1.4 333 63.0 37.0 4.3 2.7 1.6 1.6 1.0 0.6 23 57.0 43.0 4.3 2.5 1.8 8.1 4.6 3.5 322 64.0 36.0 4.0 2.6 1.4 1.4 0.9 0.5
Average: 62.5 37.5 Sub Total: 88.5 56.2 32.3 83.0 53.8 29.2
325 62.5 37.5 2.0 1.3 0.8 0.1 0.1 0.0 223 62.5 37.5 1.5 0.9 0.6 0.5 0.3 0.2 233 62.5 37.5 1.5 0.9 0.6 1.4 0.9 0.5 43 62.5 37.5 1.2 0.8 0.5 7.2 4.5 2.7 42 62.5 37.5 0.9 0.6 0.3 1.1 0.7 0.4 321 62.5 37.5 0.8 0.5 0.3 0.7 0.4 0.3 332 62.5 37.5 0.8 0.5 0.3 0.9 0.6 0.3 222 62.5 37.5 0.6 0.4 0.2 0.2 0.1 0.1 232 62.5 37.5 0.5 0.3 0.2 0.5 0.3 0.2 934 62.5 37.5 0.4 0.3 0.2 0.3 0.2 0.1 933 62.5 37.5 0.3 0.2 0.1 0.0 0.0 0.0 24 62.5 37.5 0.2 0.1 0.1 1.5 0.9 0.6 96 62.5 37.5 0.2 0.1 0.1 0.1 0.1 0.0 334 62.5 37.5 0.2 0.1 0.1 0.0 0.0 0.0 221 62.5 37.5 0.1 0.1 0.0 0.1 0.1 0.0 243 62.5 37.5 0.1 0.1 0.0 0.3 0.2 0.1 244 62.5 37.5 0.1 0.1 0.0 0.2 0.1 0.1 92 62.5 37.5 0.0 0.0 0.0 0.3 0.2 0.1 93 62.5 37.5 0.0 0.0 0.0 0.1 0.1 0.0 94 62.5 37.5 0.0 0.0 0.0 0.2 0.1 0.1 326 62.5 37.5 0.0 0.0 0.0 0.1 0.1 0.0 341 62.5 37.5 0.0 0.0 0.0 0.1 0.1 0.0 342 62.5 37.5 0.0 0.0 0.0 0.1 0.1 0.0 343 62.5 37.5 0.0 0.0 0.0 0.1 0.1 0.0 343 62.5 37.5 0.0 0.0 0.0 0.1 0.1 0.0 922 62.5 37.5 0.0 0.0 0.0 0.6 0.4 0.2
Estimated Values Total: 99.9 63.3 36.6 99.8 64.3 35.5 E4 (motorway) Road 34
5.
Conclusions
Overall, the measurement and data collection system worked well. As the trial was restricted to the nearside wheel path, no measurements were made in the offside wheel path. This was not a problem during the trial as only tyre width and tyre type (single or double) data was required. If position information is also a requirement, the two measurement systems, “X” and “Z”, can be used together. Further development work is required if the two systems are to be combined into one.
Approximately 30,650 vehicles were recorded and around 2900 of these (9.5%) were classified as large goods vehicles (LGVs).
Forty different types of vehicle were recorded. Eight vehicle types accounted for approximately 89% of all LGV traffic on the E4, Linköping and 83% of traffic on Road 34, Skeda Udde. Vehicle types 234, 323 and 22 were the most common on E4, accounting for 64% of all LGV traffic. Vehicle types 234 and 22 were the most common on Road 34 (63%).
Tyre widths measured during the survey were narrower than expected. For example, the average surface contact width of a car tyre should be around 175 mm, however, measured widths averaged around 130 mm. Initial thoughts are that this reduced measurement could be related to the shape of the tyre footprint. If the footprint was rectangular in shape, accurate measurements would have been recorded. However, as footprints tend to have rounded corners, pulse signals generated in the diagonal cable may not have been created at the tyres edges. Variations in vehicle load and tyre pressures can affect the shape of the tyre footprint. For example, over-inflation will decrease the footprint length at the edges and produce a more rounded footprint shape.
It may, however, still be possible to use the measured widths to calculate the actual wheel path of the tyre. Dividing the measured tyre width in half and adding it to the tyres right hand side position measurement should produce an accurate wheel path position.
Despite the fact that exact tyre widths could not be determined, significant width differences meant that it was possible to determine if an axle was a single tyre or double tyre assembly. Approximately 65% of all LGV axles were single tyre and 35% were double tyre.
Survey samples for less common LGVs were too small to provide reliable data. Further measurement surveys are required to increase the data sample size.
References
McGarvey, Terence (2016), Vehicle Lateral Position Depending on Road Type and Lane Width, VTI Report 892, Swedish National Road and Transport Research Institute, Linköping
COST Action 334 (2001), Effects of Wide Single Tyres and Dual Tyres, Directorate General Transport, European Commission
Appendix 1
30 VTI rapport 899A
Appendix 2
Examples of possible single and double tyre configurations are shown for the eight most common vehicle code categories.
Vehicle Code 1 2 3 4 5 6 7 S (100%) S (0%) S (60%) S (25%) S (25%) S (25%) S (25%) D (0%) D (100%) D (40%) D (75%) D (75%) D (75%) D (75%) 1 2 3 4 5 S (100%) S (0%) S (95%) S (95%) S (95%) D (0%) D (100%) D (5%) D (5%) D (5%) 1 2 S (100%) S (75%) D (0%) D (25%) 1 2 3 4 5 6 7 8 S (100%) S (0%) S (60%) S (65%) S (65%) S (65%) S (65%) S (65%) D (0%) D (100%) S (40%) D (35%) D (35%) D (35%) D (35%) D (35%) 1 2 3 4 5 6 S (100%) S (0%) S (55%) S (55%) S (55%) S (55%) D (0%) D (100%) D (45%) D (45%) D (45%) D (45%) 1 2 3 4 5 6 S (100%) S (5%) S (50%) S (70%) S (70%) S (80%) D (0%) D (95%) D (50%) D (30%) D (30%) D (20%) 1 2 3 S (100%) S (5%) S (65%) D (0%) D (95%) D (35%) 224 333 23 Axles 234 323 22 335
www.vti.se
VTI, Statens väg- och transportforskningsinstitut, är ett oberoende och internationellt framstående forskningsinstitut inom transportsektorn. Huvuduppgiften är att bedriva forskning och utveckling kring
infrastruktur, trafi k och transporter. Kvalitetssystemet och
miljöledningssystemet är ISO-certifi erat enligt ISO 9001 respektive 14001. Vissa provningsmetoder är dessutom ackrediterade av Swedac. VTI har omkring 200 medarbetare och fi nns i Linköping (huvudkontor), Stockholm, Göteborg, Borlänge och Lund.
The Swedish National Road and Transport Research Institute (VTI), is an independent and internationally prominent research institute in the transport sector. Its principal task is to conduct research and development related to infrastructure, traffi c and transport. The institute holds the quality management systems certifi cate ISO 9001 and the environmental management systems certifi cate ISO 14001. Some of its test methods are also certifi ed by Swedac. VTI has about 200 employees and is located in Linköping (head offi ce), Stockholm, Gothenburg, Borlänge and Lund.
HEAD OFFICE LINKÖPING SE-581 95 LINKÖPING PHONE +46 (0)13-20 40 00 STOCKHOLM Box 55685 SE-102 15 STOCKHOLM PHONE +46 (0)8-555 770 20 GOTHENBURG Box 8072 SE-402 78 GOTHENBURG PHONE +46 (0)31-750 26 00 BORLÄNGE Box 920 SE-781 29 BORLÄNGE PHONE +46 (0)243-44 68 60 LUND Medicon Village AB SE-223 81 LUND PHONE +46 (0)46-540 75 00