Institutionen för Energi och Teknik Examensarbete 2019:07
Department of Energy and Technology ISSN 1654-9392
Uppsala 2019
Mussel farming using various techniques
evaluated using Life Cycle Assessment
(LCA)
Olika tekniker för musselodling utvärderade med hjälp av
livscykelanalys (LCA)
Märta Frösell
Bachelor’s thesis
SLU, Swedish University of Agricultural Sciences Faculty of Natural Resources and Agricultural Sciences Department of Energy and Technology
Title: Mussel farming using various techniques evaluated using Life Cycle Assessment (LCA) Swedish title:Olika tekniker för musselodling utvärderade med hjälp av livscykelanalys (LCA)
Author: Märta Frösell
Supervisor: Hanna Karlsson, Department of Energy and Technology, SLU Examiner: Mattias Eriksson, Department of Energy and Technology, SLU
Course: Independent project in Environmental science Course code: EX0896
Credits: 15 Level: G2E
Programme/education: Biology and Environmental Science
Series title: Examensarbete (Institutionen för energi och teknik, SLU), 2019:07 ISSN: 1654-9392
Uppsala 2019
Keywords: Mussel, Climate impact, Eutrophication potential, LCA, Greenhouse gas emissions
Food-production has a great impact on the environment and the need for a more sustainable food consumption pattern and low impact products is high. Aquaculture in general, and especially mussels are in many ways a sustainable alternative for protein source. However, depending on how the mussels are being produced, the total environmental impact varies. This study analyzes an innovative technique to farm mussels, the re-seeding technique aiming to increase the yield and quality of mussels and examine how different methods affect the environment.
The method Life Cycle Assessment (LCA) was used and is considering a cradle to gate perspective. The two impacts categories are climate change and eutrophication potential (EP). On the farm that is being studied the mussels are being harvested from nets and re-seeded to the optimal density on ropes to maximize the yield. To examine the impact of different method, four different scenarios are being analyzed.
The result shows that the re-seeding process is relatively material and fuel intensive and the environmental impact would be lower if the mussels were left on the nets for the whole growth cycle. Compared to other mussel LCA
studies, emissions are similar or lower depending on different factors such as method, time for growth and meat content. Taking in to account the mussel’s removal of nutrients during their life, the total EP of the farm is negative, which is a unique property in food production. The main contributor to
emissions is the materials used on the farm and especially the cotton mesh sock that is being used to reseed the mussels.
Keywords: Mussel, Life Cycle Assessment, Climate impact, Eutrophication potential, Greenhouse gas emissions
Terms and abbreviations ... 5
1 Introduction ... 6
2 Method and system description ... 9
3 Results ... 15
4 Discussion ... 20
4 References ... 24
LCA = Life Cycle Assessment
LCIA = Life Cycle Impact Assessment GHG = Greenhouse gas
EP = Eutrophication potential FU = Functional unit
CO2-eq. = Carboon dioxide equivalents PO4-eq. = Phosphate equivalents
Food production has a great impact on the climate and environment (Willett et al. 2019). In developed countries, production and consumption of food
represents 15-28% of total greenhouse gas emissions (GHG) (Garnett, 2011). As the world population continues to grow and global warming remains a critical issue, the need for more sustainable food production and consumption patterns is high.
Life Cycle Assessment (LCA) is a method that has been frequently used to compare environmental impact from different kinds of products, including food. The method, standardized by the International Standards Organisation (ISO) (ISO 2006a,b) makes it possible to quantify the total environmental impact of a product and is considering all the steps in the production chain. Several LCA studies show that the food product with the highest climate impact is beef followed by lamb and other livestock (Heller et al. 2013; Meyhoff, 2012; Tilman and Clark, 2014;) To reduce the climate impact from the food sector, the consumption of these products needs to be reduced globally and replaced by more sustainable alternatives. Foods can often be produced in multiple ways with vastly different impacts, and therefore it is also important to identify and promote the least impactful way of producing each type of food. Seafood in general is, in terms of climate impact, a more sustainable alternative for protein supply than livestock (Tilman and Clark, 2014). In a study about climate impact of different diets the result showed that a pescatarian diet (vegetarian plus seafood) contributes with only about half of the GHG
emissions per kcal compared to the global-average diet that includes livestock products (Tilman and Clark, 2014). However, GHG emissions are only one aspect of sustainability of seafood production. When products originate in capture fisheries, the sustainable exploitation of the stock is a requirement for sustainable fishing, an aspect that has been explored in relation to LCA (Emanuelsson et al. 2014). Today 33 percent of wild fish stocks are overfished (meaning fishing pressure needs to be reduced), and 59 percent are maximally sustainable fished (meaning that fishing pressure cannot be increased) (FAO 2018). For these reasons, the possibilities to expand global fisheries are limited and aquaculture, which today accounts for almost half of all fish for human
1 Introduction
consumption (FAO 2018), is of crucial significance for providing seafood for a growing population.
Even if the GHG emissions from aquaculture is generally lower than for livestock production, there is still room for improvement and measures for mitigation that can be made for a more sustainable production. In fish farms the production and use of feed is the biggest issue in terms of climate impact and can account with as much as 86 percent of the total GHG emissions of the production (Aubin et al., 2009). Fish production can also have a great impact on the quality of the water in the area if the farm is located in an unsuitable area with low water exchange (Little et al., 2016 ). Uneaten food, medicines and feces leads to wastes and excess of nutrients that are released in to the environment.
Mussel farming is a form of aquaculture that has been proven to have a lot of environmental advantages compared to fish farms. For example, the GHG emission is much lower (Meyhoff 2012). The main reason for this is that the production does not require any input of feed at all (Ziegler et al., 2013) since mussels are filter feeders and feed on planktonic organisms in the water that flows through the farm. This also means that they can contribute to decreased eutrophication since they extract excess phosphorous and nitrogen (Aubin et al., 2018).
There are different techniques and methods to farm blue mussels. In Europe, one of the biggest producers of mussels is Spain where raft culture is the most common method (Pérez-Chamacho, 2013). This means that the mussels grow on ropes suspended from floating rafts. Mussels can also be farmed with the so called long-line method where the mussel larvae attach to ropes that are strung up between two buoys. Another method is on-bottom culture where mussel seed is collected from the wild and transfer to a cultivation site where optimum growth conditions is obtained to maximize the yield.
The yield, growth period and environmental impact varies between different method used and between different producers. Some previously made LCA studies about mussel farming report emissions of 0,6 to 2,5 carboon dioxide equivalents (CO2-eq) per kg edible mussel meat (Meyhoff, 2012; Winther et al. 2009). Two of the challenges that the mussel industry is facing that is affecting these numbers is the low edible yield (most of the mussel’s total weight is shell) and wastes at harvest that in many cases is up to 1/3 of the total harvest due to broken or to small mussels (Hallberg 2018). The growth period could also have an impact on the yield and total emissions of a farm.
1.1 Objective and research questions
The objective of this thesis is to evaluate the environmental impact of a new technique for mussel farming and examine if the extra costs related to this method are outweighed by the expected increased yield. To do this, the study will consider following research questions:
What is the total climate impact and eutrophication potential (EP) to produce one kilogram of edible mussel meat?
Is there a significant difference in environmental impact between different variants of this farming technique and between other methods? And if so, what is the most environmentally efficient/least impactful way to farm mussels in this farm?
Where in the production chain is there potential for improvements and what measures for mitigation could be made to lower the environmental impact?
2.1.1 System description
The farm studied in this report is located in Orust on the Swedish west coast. This farm is still in the developing phase and does not yet has a large-scale production. However, the production is expected to have the capacity to produce 5000 tons of mussels per year when it is fully developed.
Both nets and ropes are used as a growing substrate for the mussels in this production with the aim to maximize the yield and minimize waste. Instead of using big boats on the farm, all of the processes such as maintenance and harvest are mainly done out of barges based on the farming sites. On the barges there are engines powered by diesel generating energy for the machines used. Small boats are used to get to and from these barges and, when necessary, to get around in the farm.
The production starts when the mussels are reproducing. This is only during a short period in April-May and the abundance of mussel larvae in the area becomes high. The larvae find their way to the nets in the farm where they settle and starts to grow. The nets are suspended from hollow plastic pipes floating on the surface. Before the settle period starts these nets needs to be cleaned from macroalgae and other organisms so that the larvae can attach. This is done with a machine from the barge.
After some time, as the mussels grow, the density becomes high. This is problematic since there will not be enough space for all the mussels that have settled, and many will fall off as they grow bigger. The high density also leads to a restricted waterflow trough the farm which prevent nutrients to get to the mussels. This leads to a slower growth and smaller mussels.
To avoid overcrowding and too high density, the farm uses a method of harvesting and re-seeding the mussels. After 3-6 months on the nets the mussels can be harvested and re-seeded on ropes. In this process the mussels are first collected in to plastic big bags and transferred to another part of the farm, where they are put in a mesh sock made out of cotton and attached to ropes. The mesh sock is supposed to support the mussels and hold them in
2 Method and system description
place until they have attached to the ropes. It then decomposes in the water after some time.
The process of harvesting and reattaching the mussels is both energy and material consuming. However, it makes it possible to control the density and ensures that the mussels are being attached at the optimum density that gives the best growing condition, resulting in more evenly sized mussels and a higher yield.
When the mussels are fully grown they are harvested from the ropes. After that there is a process of separate the mussels from each other (declumping) and grading them in to different sizes. Because of modern and well-developed equipment and machines the number of mussels that are being crushed in this step is only about 5 % of the total yield. Also, instead of throwing away the mussels that are to small they are being re-seeded again which further minimize the waste of this farm. After this the mussels are being put into plastic big bags on one of the barges and transported to land with a towboat. These big bags are not being recycled.
The growth period ranges between 16-24 months depending on both economic and ecologic factors, including:
- The lack of capacity to harvest everything at once. There are not enough machines and would not be economical beneficial.
- The need to meet market demands of having mussels in different sizes available, and at different times of the year.
- Temporary occurrence of toxins that postpone the harvest.
- The variation of the amount of nutrients in the water due to external factors, which has an effect on the growth speed of the mussels.
Meat content is another factor that can vary considerably depending on growth time and the amount of nutrients. A low meat content is 20% and a high is up to 40%.
2.1.2 Scenarios
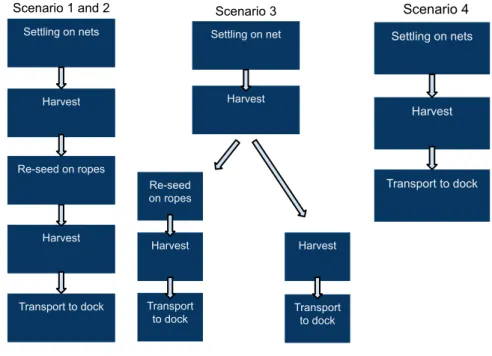
Since the farm is not yet fully developed, the production does not have a consistent yield and method each year. Therefore, this LCA will consider different scenarios of what the production could look like. These scenarios differ in terms of growth time and slightly different method which results in different amount of equipment and fuel used.
Scenario 1: All of the mussels are being re-seeded to ropes after 3-4 months. The mussels grow 12 months on the ropes before harvest. Two ropes are needed to re-seed the mussels that settles on one net. The ropes are 2000-meter-long and in time for harvest there is 8 kg of mussels per meter making the total yield of two ropes 32 000 kg (live weight).
Scenario 2: All of the mussels are being re-seeded to ropes like in scenario 1. In this scenario however, the growth time on the ropes is over 12 months and the equipment cannot be used to re-seed the mussel that settles the following season. The equipment is empty between harvest and re-seeding and during its lifetime it does not grow as much mussels as it should have if it could be used for each settle period. The yield per growth cycle is the same as for scenario 1 but since the growth cycle is longer the yield per year is less.
Scenario 3: Only 2/3 of the mussels are being re-seeded to ropes, the remaining 1/3 is left on the nets. This means a slightly lower material consumption since not as much ropes are needed. The final harvest is after more than 12 months for both nets and ropes. Like in scenario 2, the equipment cannot be used for settling two years in a row. The total yield at harvest is the same as for scenario 1 and 2, where 1/3 is from the nets and 2/3 from the ropes.
Scenario 4: All of the mussels are being left on the nets during the whole growth period. This saves a lot of material and fuel consumption, but the yield is not as high as for the other scenarios, only 18 000 kg per growth cycle.
Figure 2.1. Process maps of the different scenarios.
2.2.1 LCA
This study will follow general method for LCA. This method consists of four phases: goal and scope, inventory, impact assessment and interpretation (Matthews et al. 2014).
2.2.2 Scope and system boundary Settling on nets Harvest Re-seed on ropes Harvest Transport to dock Scenario 1 and 2 Settling on net Harvest Re-seed on ropes Harvest Harvest Transport
to dock Transport to dock Scenario 3
Settling on nets
Harvest
Transport to dock Scenario 4
The study is considering a cradle to gate perspective. This includes the steps from production of supply materials (e.g. fuel, polypropylene, cotton), preparing the nets for settling, to transporting the harvested mussels from the farm to land.
All material- and energy consuming steps are being considered. The data was collected for all scenarios in relation to the settling on one net. The functional unit (FU) is 1 kg of edible mussel meat. The translation from whole harvested mussel to edible yield was done placing all impacts on the edible part, i.e. no upstream burdens were placed on shells.
2.2.3 Inventory
All the information regarding the production was collected in direct contact with the producers through a site visit, a meeting, interviews, phone calls and emails. All the inventory data is listed below in table 2.1-2.5. Table 2.1-2.3 show the total material and fuel consumption that is used in the different scenarios to produce all of mussels that settles on one net (i.e. not per FU). Table 2.4-2.5 shows the yield for each scenario per growing cycle respectively per year. These data are then used to calculate the total consumption of material and fuel per FU.
Table 2.1. The amount material used on the farm for each growing cycle.
kg/growing cycle
Equipment Material Lifetime Scenario
1 Scenario 2 Scenario 3 Scenario 4 Plastic pipes Polyethylene 22,5 3 780 3 780 2 949 1260 Nets polypropylene 20 510 510 510 510 Ropes polypropylene 20 620 620 413 0 Buoys Polyurethane 20 168 168 131 56 PVC 20 3 3 2 1 Steel 20 9 9 7 3
Anchors Cast iron 20 390 390 303 130
Schackles Iron 20 10 10 10 10 Big bags (reusable) Polypropylene 7,5 20 20 13 0 Big bags (disposable) Polypropylene Disposable 91 91 91 51
Table 2.2 The amount fuel used on the farm
liter/growth cycle
Process Fuel Scenario 1 Scenario 2 Scenario 3 Scenario 4
Cleaning nets Diesel 22,5 22,5 22,5 22,5 Harvest Diesel 180 180 187 67,5 Reseed Diesel 20 20 13 0 Transport Diesel 78 78 78 44
Table 2.3 The total fuel consumption from the small boats on the farm per year
Process Fuel Liter/year
Small boats
Gasoline 1265
Table 2.4. The total yield in for one growing cycle for each scenario with three different meat contents.
Kg edible mussel meat/growth cycle Meat content Scenario 1 Scenario 2 Scenario 3 Scenario 4 20% 680 680 680 3420 30% 9120 9120 9120 5130 40% 12160 12160 12160 6840
Table 2.5 The yield in kg edible mussel meat calculated per year for each scenario with three different meat contents.
Kg edible mussel meat/year Meat
content
Scenario 1 Scenario 2 Scenario 3 Scenario 4
20% 5211 3040 3040 1710
30% 7817 4560 4560 2565
40% 10423 6080 6080 3420
2.2.4 Material and fuel consumption per FU
To calculate the material consumption per FU, the lifetime of the material had to be considered. The total amount of material used where divided by the yield per year and lifetime of the equipment. All though, for the mesh sock and the disposable big bags, that are not being recycled, the total amount of material where divided by the yield per growing cycle (not yield per year).
To calculate the fuel used per FU, the total consumption for one growing cycle were divided by the yield for one growing cycle. In table 2.2 the total amount of fuel has been calculated by taking the liter per hour that the machines use multiplied with the time for each process.
The small boats are estimated to be used 1 hour per work day every year. Since these are used for the whole farm their total fuel consumption is divided by the total expected yield of the whole farm (5000000 kg per year) to get the fuel per FU.
2.2.5 Impact Assessment
This study focuses on the two impact categories, climate impact, measured in CO2-equivalents, and EP, measured in phosphate-equvivalents (PO4-eq.). The emission data from the production of materials were taken from the LCIA (Life Cycle Impact Assessment) database ecoinvent 3.5 (ecoinvent.org) that gives the emissions of CO2-equivalents respectively PO4-equvivalents per kg
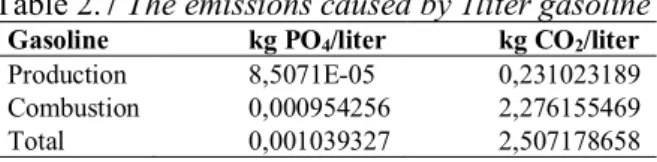
produced material. The emissions where then multiplied with the amount of the material that is needed to produce 1 kg of edible mussel meat on the farm. Emission data for producing and combustion one liter of diesel respectively gasoline was collected from miljöfaktaboken (Gode et al. 2011) and then multiplied with the amount used for producing 1 kg of edible mussel meat. Table 2.6-2.7 shows the emissions per liter fuel for diesel respectively gasoline.
Table 2.6 The emissions caused by 1liter diesel
Table 2.7 The emissions caused by 1liter gasoline
Gasoline kg PO4/liter kg CO2/liter
Production 8,5071E-05 0,231023189 Combustion 0,000954256 2,276155469
Total 0,001039327 2,507178658
For climate impact the characterization factors from IPCC 2013 GWP100 was used. These are the most up to dates values and are adapted from the IPCC Fifth Assessment Report (Myhre et al. 2014). For EP the characterization factors from CML 2011 (Guinée 2011) was used.
When calculating the EP of this farm, the negative EP from the mussel’s nutrient uptake was also considered. According to an earlier study of mussels near this area (Haamer 1996), 1 kg blue mussels contains 12,4 g nitrogen and 0,74 g phosphorous. Again, the characterization factors from CML 2001 was used to convert this to PO4-eq which could then be subtracted from the EP of the farm.
Diesel kg PO4/liter kg CO2/liter
Production 8,76275E-05 0,255765156 Combustion 0,000920012 2,46922986 Total 0,001007639 2,724995017
3.1 Climate impact
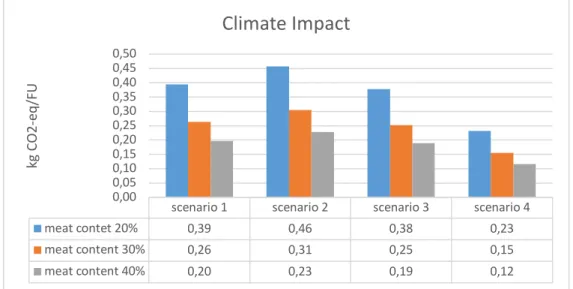
The emission of GHG per kg of edible mussel is between 0,12-0,46 kg CO2-eq. depending on the scenario and meat content of the yield.
Since emissions are calculated per edible product the meat content has a significant impact for the results. As seen in figure 3.1 a 50% higher meat content leads to half of the emission per FU (figure 4.1).
Scenario 2 has the highest climate impact with 0,46 kg CO2-eq. per kg mussel meat with a meat content of 20% and 0,23 kg CO2-eq. per kg mussel meat with a meat content of 40%. Scenario 4 has the lowest climate impact with 0,23 respectively 0,12 kg CO2-eq per kg mussel meat. Scenario 1 and scenario 3 show similar results but with slightly higher emissions from scenario 1.
Figure 3.1 The emissions of GHG from the mussel production in four different scenarios with three different meat-content.
In all four scenarios the material usage contributes more to the carbon footprint than the fuel consumption. The material contributes with 52-70% of the total emissions of the farm. Since the emissions per FU and meat content is in direct correlation to each other, the material and fuel proportion in each scenario does not change with different meat content.
scenario 1 scenario 2 scenario 3 scenario 4
meat contet 20% 0,39 0,46 0,38 0,23 meat content 30% 0,26 0,31 0,25 0,15 meat content 40% 0,20 0,23 0,19 0,12 0,00 0,05 0,10 0,15 0,20 0,25 0,30 0,35 0,40 0,45 0,50 kg CO 2-eq /F U
Climate Impact
3 Results
Figure 3.2 The relative contribution to the emissions of GHG from material and fuel consumption.
Figure 3.3 shows the emissions from the fuel consumption of the different processes of the production in the four scenarios, calculated from a yield with 30% meat content (again the proportions does not change between different meat content). The fuel consumption in scenario 1,2 and 3 is relatively constant but is approximately 20% lower for scenario 4 where there is no reattachment process and only one harvest. However, the carbon footprint from cleaning the nets before settling is higher in scenario 4 since there is a lower yield and therefor emissions per FU becomes higher. In all scenarios harvest is the largest contributor to emissions caused by fuel consumption, followed by the transport of the mussels to the dock. The boats is the part that contributes the least to emissions.
Figure 3.3 Emissions from the production and use of fuel in the different processes of the production.
0% 20% 40% 60% 80% 100% 1 2 3 4
Material and fuel
material fuel 0 0,01 0,02 0,03 0,04 0,05 0,06 0,07 0,08 0,09 0,1 1 2 3 4 CO 2 -eq /F U
Fuel
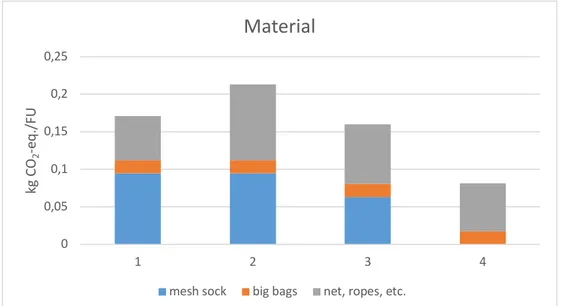
The emissions caused by material consumption varies more than emissions from fuel between the different scenarios. The mesh sock is one single
component that contributes to a large part of the emission in scenario 1,2 and 3 where it accounts for 55%, 44% respectively 39% of the total emissions caused by material. In scenario 4 where the mesh sock is not used the emissions is much lower. The rest of the emission is mainly from the stationary and reusable equipment such as the nets and ropes but also a smaller part from the disposable big bags that is used when the mussels are being transported to the dock.
Figure 3.4 Emissions caused by the different material and equipment on the farm.
3.2 Eutrophication potential
The emissions of eutrophic emissions caused by material and fuel consumption at the farm is between 5,55E-05 and 5,16E-04 kg PO4-eq per kg mussel meat (figure 3.5). There is a big difference between scenario 4, where there is no reattachment process, compared to the other three scenarios.
0 0,05 0,1 0,15 0,2 0,25 1 2 3 4 kg CO 2 -eq ./ FU
Material
Figure 3.5 The EP caused by material and fuel consumption.
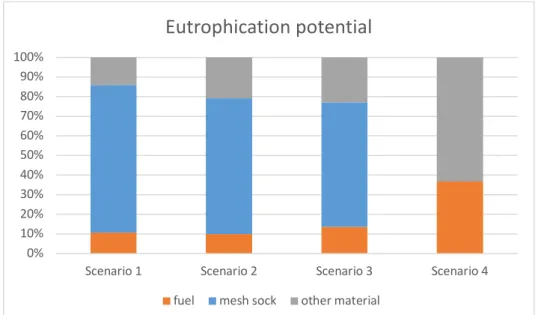
Again, the biggest contributor to emissions are the material and especially the mesh sock (figure 3.6). For scenario 1,2 and 3 where the mesh sock is used it stands for 63-75% of the total emissions of PO4-eq from the farm. Other material (disposable big bags included) stands for 63% of the emissions from scenario 4, 13 % for scenario 1 and about 20% for scenario 2 and 3.
Figure 3.6 The relative contribution to the EP from fuel, mesh sock and other material in the different scenarios.
However, when the uptake of nutrients is included in the calculations, the total EP from the farm is negative. 1 kg of edible mussel meat corresponds to the removal of 0,019 kg PO4-eq from the water. This is 72-99 times more than the emissions for scenario 1-3 and 340 times more than the emissions for scenario
scenario 1 scenario 2 scenario 3 scenario 4
meat content 20% 4,75E-04 5,16E-04 3,76E-04 1,11E-04
meat content 30% 3,17E-04 3,44E-04 2,50E-04 7,40E-05
meat content 40% 2,38E-04 2,58E-04 1,88E-04 5,55E-05
0,00E+00 1,00E-04 2,00E-04 3,00E-04 4,00E-04 5,00E-04 6,00E-04 kg PO 4-eq ./ FU
Eutrophication potential
0% 10% 20% 30% 40% 50% 60% 70% 80% 90% 100%Scenario 1 Scenario 2 Scenario 3 Scenario 4
Eutrophication potential
4. The total EP of the farm is about -0,19 kg PO4-eq per FU for all four scenarios.
3.3 Sensitivity analysis
The three factors that contributes the most to both EP and GHG emissions in this production is the mesh sock, the stationary equipment and the harvest process. Figure 3.8 shows the result of a sensitivity analysis where the impact from these factors has been lowered. In this scenario the emissions from producing cotton to the mesh sock is 20% lower, the stationary equipment has a 20% longer lifetime and the engine for the harvest machine needs 20% less fuel. The result shows that the lower impact from the mesh sock would lead to a 5-7% decrease of total GHG and a 13-15% decrease in total EP emissions. For material, a longer lifetime would lead to a decrease of 4-7% for GHG and 2-9% for EP emissions. The fuel consumption at harvest has a greater impact on climate change than for EP and a 20% lower use would lead to 4-5% less total GHGs and only up to 3% less EP.
Figure 3.8 the decrease of total emissions from the production when the impact from harvest, material and mesh sock is lowered by 20%.
80 82 84 86 88 90 92 94 96 98 100
scenario 1 scenario 2 scenario 3 scenario 4
% of the original emissions
Climate
harvest material mesh sock
80 82 84 86 88 90 92 94 96 98 100
scenario 1 scenario 2 scenario 3 scenario 4
% of the original emissions
Eutrophication
It is clear that material consumption is the biggest contributor to emission in this farm. Especially for the scenarios where there is re-seeding.
Out of all four scenarios studied in this report scenario 4 has the lowest impact on the environment in terms of both Climate change and EP. This is not that surprising since that method is very passive and even though the yield per year is lower than for the other scenarios, the much lower consumption of fuel and material compensate for that. However, as mention in the system description, leaving all the mussels on the nets can be problematic. It can be difficult to find a way to place the nets so that the waterflow through the nets do not get
restricted and so that the mussels can get enough of nutrients. This can cause that the mussels grow slower and do not get as high meat content. For the company it is an ineffective and not so economical beneficial way of producing mussels and is not being practiced at the farm for now, it needs more
improvement to be an option for the future.
Still, it is interesting to compare scenario 4 to the other scenarios as it gives an idea of how much the re-seeding process costs in terms of environmental impact. For the three scenarios where there is a re-seed process scenario 2 has the highest emissions and scenario 3, where only 2/3 of the mussels are being re-seeded, has the lowest. The growth time for scenario 2 and 3 is the same but still scenario 3 has about 20% lower climate impact and almost 30% lower EP. This again shows that material consumption has a big impact in this farm since it makes a big difference when only 2/3 of the equipment of the rope
cultivation is needed (scenario 3). The fact that scenario 2 also has about 13% higher GWP than scenario 1 shows that time for growth is not a negligible factor either.
Compared to other blue mussel farms, studied in other reports, this farms climate impact is similar or lower. Whinter et al. (2009) found that the
emissions of GHG from the cultivation part (excluding transport to wholesale, packaging and processing) of farmed blue mussels Norway is 1,24 kg CO2-eq per edible product. For Danish mussels 0,30 kg CO2-eq/ edible product has been reported (Hallberg 2018) and for Scottish mussels 0,61 kg CO2-eq/kg edible product (Meyhoff 2012). Scenario 4 in this study has a lower climate
4 Discussion
impact than all of those farms, regardless the meat content. For the other three scenarios, with the lowest meat content this production is still better than Scottish and Norwegian farms in terms of climate impact, but not better than the Danish. With a meat content of 30 percent however, scenario 1 and 3 shows better results than the Danish mussels and with 40% meat content all the scenarios in this study have lower emissions of GHG compared to the other farms.
One big difference between this farm and the other farms is the percentage material versus fuel/energy. In all three previous studies mentioned above, the energy and fuel consumption have been higher than the material consumption which is not the case in this study. The high proportions of emissions caused by material in this farm once again indicates that re-seeding leads to a much more material consuming production. However, even in scenario 4, where no re-seeding is performed, the emissions from fuel consumption is lower than for material consumption. This low share from the fuel could be a result of a lower fuel consumption compared to the other farms due to not using big boats in this farm, and instead perform harvest and other processes from stationary barges. One big improvement that the farm could make is to lower the use of material and especially the mesh sock. As mentioned before, scenario 3 has a significant lower impact than scenario 2 even though the scenarios have the same growth time. This is because not as much ropes and mesh sock is required for scenario 3 where only 2/3 of the mussels is re-seeded and the rest is left on the nets. If the proportion of mussels being re-seeded could be lowered more there would be a lowered consumption of the mesh sock. This would also require less rope and lower the other material consumption further. If 50% where to be re-seeded (instead of 2/3) only one rope would be required instead of two. Another act of mitigation would be to expand the lifetime of the equipment by using the best suited material and make sure enough maintenance is being made. Also, the use of more energy efficient engines for the machines to reduce fuel consumption could make a different in emissions. Especially for the harvest machine that accounts for more than 50% of all the fuel
consumption.
The biggest improvement however, would be if the producers could control the meat content of the mussels and keep it as high as possible. This is of course depending partly on external factors that cannot be controlled. But if the producers could optimize the condition the best way possible considering for example location, timing, density and growth time that gives the highest meat content this would have a positive effect on the emissions per FU.
4.1 Uncertainties
As with all LCA studies, there is assumptions and uncertainties in this study that needs to be considered when interpreting the results. For example, the emission data taken from ecoinvent is based on global or European mean
values for the production. This could differ a lot between different factories and producers and the exact emission for the material used on this farm is not known. This is important to have in mind since the material turned out to have a great impact on the results. One factor that would have been extra interesting to examine further is the emissions from the cotton production. Since the consumption of cotton is very high, and since it is not reusable, the
environmental impact for producing it plays a big part and turned out to be very high in ecoinvent LCIA database. It is possible that this impact could be lower for the cotton mesh sock used on the farm depending on where and how it is produced. As seen in the sensitivity analysis (figure 3.8), if the emissions per kg produced cotton would be 20% lower this would lead to a decrease of total GHG emissions for the farm with up to 7% and up to 15% lower emissions of PO4-eq.
Another important uncertainty about this study is that the farm that is being studied is relatively new and still in a developing phase. This means that these scenarios of what the farm could look like in the future is based on some assumptions when it comes to for example the growth time for the mussels, the annual yield and the lifetime of the materials. These are all factors that could lead to over or underestimated calculations of the environmental impact. Finally, it is possible that factors that this study do not consider could have an important impact on the total emissions from the farm. For example, other studies have reported that the mussels could contribute to as well carbon sequestration as well as CO2 release in the shell production (Aubin et al. 2018;
Ray et al, 2018). This circulation of carbon has not been included in the calculation for climate impact for this farm and would have to be further studied to decide if it is of relevance for the result or not. Another factor that has not been considered is the effect that the decomposition of the cotton in water could have on the EP.
4.2 Conclusion
To summarize the result and lead back to the research question of this thesis, the climate impact for producing 1 kg mussel meat varies between 0,12-0,46 kg CO2-eq depending on method used and meat content of the mussels. The EP is much more negative than positive due to the mussel’s uptake of nutrients and the calculations results in a net removal of 0,19 kg PO4-eq. The biggest
difference in environmental impact can be seen between the scenario where the mussels are being left on the nets compared to the scenarios where there is re-seeding. The hotspots of emission are the material and especially the mesh sock that is being used and measures for mitigation could preferably be addressed to this part of the production chain to have the biggest impact. Even though the process of re-seeding turned out to be a fuel and material consuming step of the production, the farm still has similar or lower total environmental impact than other farms that has been studied. The investment in modern machines and measures for minimum waste (only about 5%) and
less fuel consumption (when using barges instead of boats) could possibly be a big contributor to this since these issues has shown to be a few of the biggest challenges in other farms. Even if scenario 4 has the least emission at this study, the other scenarios are still sustainable ways to produce food and protein with several times lower emission than other kinds of food. Looking at a bigger perspective, if scenario 4 is an ineffective and not economical beneficial way to farm mussels for this farm it may not be the best option. Right now, it is more important to have a functional production with a high yield that can provide for the market so that mussels can be a relevant alternative to other foods.
However, as the mussel industry grows, environmental aspect will be more important, and these small differences plays a bigger part. There is a need for further research in how to make the most efficient and sustainable production for large scale mussel farming.
Aubin, J., Fontaine, C., Callier, M., Roque d’orbcastel, E., 2018. Blue mussel (Mytilus edulis) bouchot culture in Mont-St Michel Bay: potential mitigation effects on climate change and eutrophication. Int. J. Life Cycle Assess. 23, 1030–1041. https://doi.org/10.1007/s11367-017-1403-y
Aubin, J., Papatryphon, E., van der Werf, H.M.G., Chatzifotis, S., 2009. Assessment of the environmental impact of carnivorous finfish production systems using life cycle assessment.
Emanuelsson, A., Ziegler, F., Pihl, L, Sköld, M., Sonesson, U., 2014. Accounting for overfishing in Life Cycle Assessment: new impact categories for biotic resource use. I J LCA 19:1156-1168
FAO 2018 State of the Worlds Fisheries and Aquaculture
Garnett, T., 2011. Where are the best opportunities for reducing greenhouse gas emissions in the food system (including the food chain)? Food Policy 10. Gode, J., Martinsson, F., Hagberg, L., Öman, A., Höglund, J., Palm, D. 2011. Miljöfaktaboken 2011. Värmeforsk service AB, Stockholm
Guinée, JB. 2001. Handbook on LCA, operational guide to the ISO standards. Springer Netherlands
Haamer, J., 1996. Improving water quality in a Eutrophied fjord system with mussel farming. Ambio Vol. 25 No.5, August 1996
Hallberg, V. 2018. Mapping of production of farmed BLUE MUSSELS (Mytilus edulis) in Denmark using Life Cycle Assessment.
Heller, M.C., Keoleian, G.A., Willett, W.C., 2013. Toward a Life Cycle-Based, Diet-level Framework for Food Environmental Impact and Nutritional Quality Assessment: A Critical Review. Environ. Sci. Technol. 47, 12632–12647. https://doi.org/10.1021/es4025113
ISO. 2006a. Environmental management – Life cycle assessment – Principles and framework. ISO 14040:2006(E). International Organization for
Standardization. Geneva. Switzerland.
4 References
ISO. 2006b. Environmental management – Life cycle assessment –
Requirements and guidelines. ISO 14044:2006(E). International Organization for Standardization. Geneva. Switzerland.
Little, D.C., Newton, R.W., Beveridge, M.C.M. 2016. A rapidly growing and significant source of sustainable food? The Nutrition Society Summer Meeting. University of Nottingham, 6-9 July 2015, Nottingham.
doi:10.1017/S0029665116000665
Matthews, H., Hendrickson C. T., Matthews, D. 2014. Life Cycle Assessment: Quantitative Approches for Decisions that Matter.
Meyhoff, J. 2012. Carbon footprint of Scottish Suspended Mussels and Intertidal Oysters. Scottish Aquaculture Research Forum (SARF)
Myhre, G., D. Shindell, F.-M. Bréon, W. Collins, J. Fuglestvedt, J. Huang, D. Koch, J.-F. Lamarque, D. Lee, B. Mendoza, T. Nakajima, A. Robock, G. Stephens, T. Takemura and H. Zhang, 2013: Anthropogenic and Natural Radiative Forcing. In: Climate Change 2013: The Physical Science Basis. Contribution of Working Group I to the Fifth Assessment Report of the Intergovernmental Panel on Climate Change [Stocker, T.F., D. Qin, G.-K. Plattner, M. Tignor, S.K. Allen, J. Boschung, A. Nauels, Y. Xia, V. Bex and P.M. Midgley (eds.)]. Cambridge University Press, Cambridge, United Kingdom and New York, NY, USA.
Pérez-Chamacho, A., Labarta, U., Vinseiro, V., Fernánders-Reiriz, M. J. 2013. Mussel production management: Raft culture without thinning-out.
Aquaculture. Available:
https://reader.elsevier.com/reader/sd/pii/S0044848613002536?token=F67C969 FBE7F768AFD04FACBAF92947C7BC445A11D9A210B1EE37A3B936D92 0080569ED855CAF9BC97A9F09AACE8680F [2019-06-01]
Ray, N. E., O’Meara, T., Wiliamson, T., Izursa, J-L., Kangas, P. C. 2018.
Consideration of carbon dioxide release during shell production in LCA of bivalves. Int J Life Cycle Assess. 23:1042–1048. DOI: 10.1007/s11367-017-1394-8
Tilman, D., Clark, M., 2014. Global diets link environmental sustainability and human health. Nature 515, 518–522. https://doi.org/10.1038/nature13959 Willett, W., Rockström, J., Loken, B., Springmann, M., Lang, T., Vermeulen, S., Garnett, T., Tilman, D., DeClerck, F., Wood, A., Jonell, M., Clark, M., Gordon, L. J., Fanzo, J., Hawkes, C., Zurayk, R., Rivera, J. A., De Vries, W., Sibanda, L. M., Afshin, A., Chaudhary, A., Herrero, M., Agustina, R., Branca, F., Lartey, A., Fan, F., Crona, B., Fox, E., Bignet, V., Troell, M., Lindahl, T., Singh, S., Cornell, S. E., Reddy, K. S., Narain, S., Nishtar, S., Murray, C. J. L. 2019. Food in the Anthropocene: the EAT–Lancet Commission on healthy diets from sustainable food systems.
Winther, U., Ziegler, F., Skontorp Hognes, E., Emanuelsson, A.,Sund, V., Ellingsen, H. 2009. Carbon footprint and energy use of Norweigan seafood products. SINTEF fisheries and aquaculture
Ziegler, F., Winther, U., Hognes, E.S., Emanuelsson, A., Sund, V., Ellingsen, H. 2013. The Carbon Footprint of Norwegian Seafood Products on the Global Seafood Market. J. Ind. Ecol. 17, 103–116. https://doi.org/10.1111/j.1530-9290.2012.00485.x
Sveriges Lantbruksuniversitet Institutionen för energi och teknik Box 7032
750 07 UPPSALA
http://www.slu.se/institutioner/energi-teknik/
Swedish University of Agricultural Sciences Department of Energy and Technology P. O. Box 7032
SE-750 07 UPPSALA SWEDEN