Master’s thesis • 30 credits
Agricultural programme – Economics and Management
Degree project/SLU, Department of Economics, 1209 • ISSN 1401-4084 Uppsala, Sweden 2019
Sustainability effects of introducing legumes
in traditional cropping systems
- an experimental case study in Swedish
context
Ulrik Bergsland
Jakob Rönnholm
Swedish University of Agricultural Sciences
Faculty of Natural Resources and Agricultural Sciences Department of Economics
Sustainability effects of introducing legumes in traditional
cropping systems -an experimental case study in Swedish
context
Ulrik Bergsland Jakob Rönnholm
Supervisor: Hans Andersson, Swedish University of Agricultural Sciences, Department of Economics
Examiner: Richard Ferguson, Swedish University of Agricultural Sciences, Department of Economics
Credits: 30 hec
Level: A2E
Course title: Master thesis in Business Administration
Course code: EX0906
Programme/Education: Agricultural programme –
Economics and Management 270,0 hec Course coordinating department: Department of Economics
Place of publication: Uppsala Year of publication: 2019
Name of Series: Degree project/SLU, Department of Economics
Part number: 1209
ISSN 1401-4084
Online publication: http://stud.epsilon.slu.se
Key words: cropping system, legumes, optimization, profitability, sustainability
iii
Acknowledgements
We would like to place a thank you to our supervisor Prof. Hans Andersson for the help and ideas during the work of this thesis. We would also like to thank our seminar group, which has provided us with important insights during the writing process.
We would also like to thank our fellow student colleagues, friends, and family who have helped us keep motivation up during the writing process. All the hours in front of the computer would not have been possible without the occasional coffee breaks.
Thank you!
Uppsala, June 2019
v
Abstract
The agricultural sector of the world faces a growing food demand because of a growing world population. To support this growing demand, it could be necessary that agricultural production increases, this increase in production must be achieved sustainably. One way to achieve more sustainable production in agricultural could be to diversify the production systems. Legumes are a crop group that holds properties that could be of importance when trying to achieve more diverse and sustainable agriculture.
This study aims to examine how a diversification with legumes would affect typical Swedish cereal dominated cropping systems in terms of sustainability. More specifically, the three dimensions of the triple bottom line are investigated separately. Indicators of sustainability in each dimension are identified, and these show the effects of legumes in the cropping systems. To examine the effects legumes attributable to the sustainability in the cropping systems, two case farms are developed. Five different indicators are applied; these are profitability, nitrogen usage, phosphorus usage, energy production, and protein production. The study considers three different legumes, feed peas, yellow peas, and broad beans. From the two case farms, a mathematical optimization model is developed from which the indicators are calculated. The approach of the study is quantitative and uses secondary data from several sources.
Results from the study indicate that legumes could increase the profitability of both case farms. The results show an increase in the profitability of between 0-4 %. The study indicates that nitrogen and phosphorus usage on the farm decreases. The results on phosphorus differ from previous studies, where it is found that legumes would increase the usage of phosphorus in a cropping system. The results on the indicators of energy and protein are similar to previous research and point towards an increase in protein production and a decrease in energy production. The major conclusion is that diversification with legumes could have an impact on the sustainability of the two case farms. Only one out of five indicators point towards reduced sustainability compared to a state with no legumes; this is the indicator of energy production. However, in the discussion, the implication of lower energy production is discussed, and it is found that a lower energy production might not be bad for the single farmer.
vi
Sammanfattning
Jordbrukssektorn i världen står inför en växande efterfråga på livsmedel på grund av en växande världsbefolkning. För att möta denna växande efterfråga är det nödvändigt att jordbruksproduktionen ökar, denna produktionsökning måste uppnås på ett hållbart sätt. Ett sätt att uppnå en mer hållbar jordbruksproduktion kan vara att diversifiera produktionssystemen. Baljväxter är en gröda som kan vara betydande vid försök att uppnå ett mer diversifierat och hållbart jordbruk.
Denna studie syftar till att undersöka hur en diversifiering med baljväxter skulle påverka traditionella svenska spannmålsdominerade växtodlingssystem med avseende på hållbarhet. Mer specifikt undersöks de tre dimensionerna; ekonomisk hållbarhet, miljömässig hållbarhet och social hållbarhet separat. Indikatorer identifieras i varje dimension för hållbarhet, och dessa visar effekterna baljväxter har i växtodlingssystem. För att undersöka hållbarhetseffekterna av baljväxter i växtodlingssystem utvecklas två fiktiva fallgårdar. Fem olika indikatorer tillämpas och dessa är lönsamhet, kväveanvändning, fosforanvändning, energiproduktion och proteinproduktion. Studien undersöker tre olika baljväxter, foderärt, gulärt och åkerbönor. Utifrån fallgårdarna utvecklas en matematisk optimeringsmodell där indikatorerna beräknas. Studiens tillvägagångssätt är kvantitativt och använder sekundärdata från olika källor.
Resultaten från studien tyder på att baljväxter kan öka lönsamheten på Svenska växtodlingsgårdar. Lönsamheten ökar enligt resultaten mellan 0-4 % på fallgårdarna. Resultaten indikerar att gårdarnas kväve- och fosforanvändning minskar. Resultaten på fosforanvändningen skiljer sig från tidigare studier, där det konstateras att behovet av fosfor ökar i växtodlingssystem där baljväxter ingår. Resultaten på indikatorerna för energi- och proteinproduktion överensstämmer med tidigare forskning och pekar på en ökning av proteinproduktion och en minskning av energiproduktion. Slutsatsen är att en diversifiering med baljväxter kan öka hållbarheten hos de två fallgårdarna. Endast en av fem indikatorer pekar på lägre hållbarhet med baljväxter inkluderat i växtodlingssystemen jämfört med växtodlingssystem utan baljväxter.
vii
Table of Contents
1 INTRODUCTION ... 1 1.1 Background ... 1 1.2 Problem statement ... 3 1.3 Aim... 4 1.4 Delimitations ... 41.5 Structure of the report... 6
2 LITERATURE REVIEW ... 7
2.1 Previous studies of legumes ... 7
2.1.1 Economic effects of legumes ... 7
2.1.2 Environmental effects of legumes ... 8
2.1.3 Social effects of legumes ... 9
2.2 Economic models of farms and cropping systems ... 9
2.3 Sustainability assessment methods ... 10
2.4 Summary of literature review ... 11
3 THEORETICAL FRAMEWORK ... 13
3.1 Applied microeconomics and production economics ... 13
3.1.1 Profit maximization ... 13
3.2 Indicators of sustainability ... 14
3.2.1 Indicators of sustainability within agriculture ... 15
3.2.2 Indicators applied in this study ... 16
3.3 Motivation of theories and alternative theoretical approach ... 17
4 METHOD ... 18 4.1 Research strategy ... 18 4.2 Research design ... 18 4.3 Case farms ... 19 4.4 Data collection ... 21 4.5 Empirical model ... 22 4.5.1 Applied optimization ... 22 4.5.2 Optimization model ... 24 4.6 Quality assurance ... 26 4.6.1 Reliability ... 26 4.6.2 Validity ... 27 4.7 Ethical considerations ... 27 5 RESULTS ... 28 5.1 GSS ... 28 5.1.1 Economic sustainability ... 30 5.1.2 Environmental sustainability ... 31 5.1.3 Social sustainability ... 32 5.2 SS ... 33 5.2.1 Economic sustainability ... 34 5.2.2 Environmental sustainability ... 35 5.2.3 Social sustainability ... 36
6 ANALYSIS AND DISCUSSION ... 37
6.1 Summary of results ... 37 6.2 Economic sustainability ... 38 6.3 Environmental sustainability ... 39 6.4 Social sustainability ... 39 6.5 General discussion ... 40 7 CONCLUSIONS ... 42 7.1 Further research ... 43 REFERENCES ... 44 APPENDIX ... 49
viii
Appendix 1 Collected data ... 49
Appendix 2 Constraints ... 53
List of figures
Figure 1. Distribution of crops in Sweden 2017... 2Figure 2. Total legume acreage in Sweden as a percentage of the total acreage for agricultural production ... 3
Figure 3. Production areas in southern Sweden ... 5
Figure 4. Illustration of the structure of the report ... 6
Figure 5. Example of an indicator framework and what indicators can measure ... 15
Figure 6. The crop allocation at the two case farms ... 20
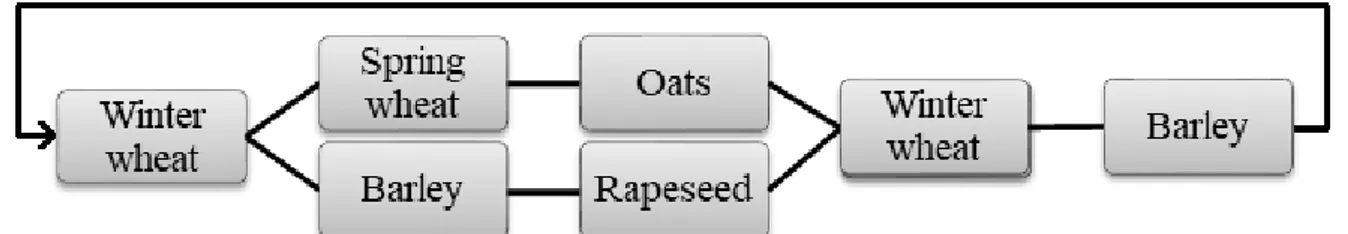
Figure 7. The current state in region GSS, this is what is grown on the case farm ... 21
Figure 8. The current state in region SS, this is what is grown on the case farms ... 21
Figure 9. Illustration of the optimization process ... 23
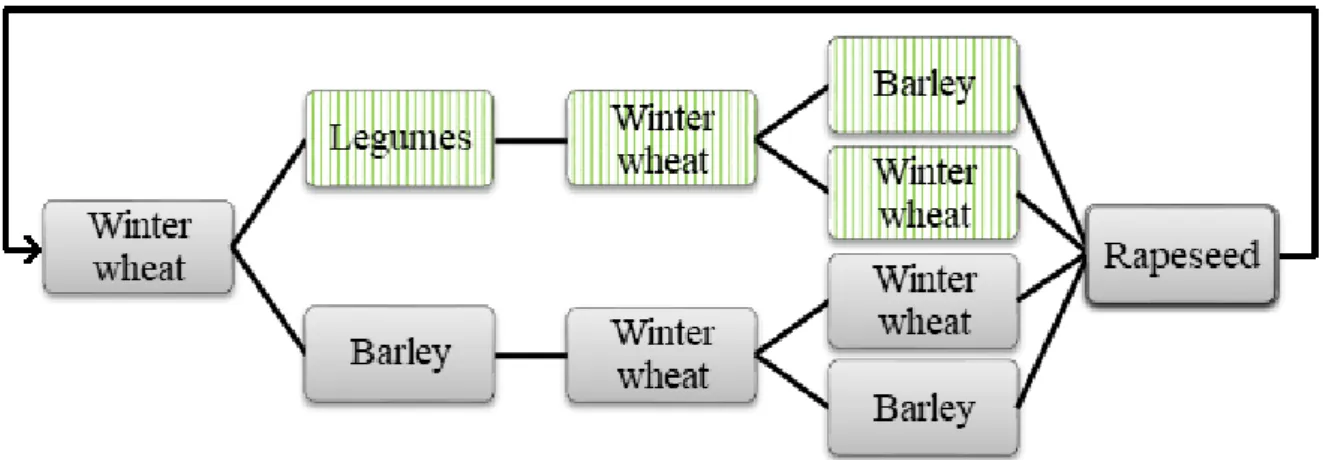
Figure 10. Crop rotation for the farm in GSS when legumes are introduced ... 28
Figure 11. The crop allocation for the farm in GSS with 0% legumes and 15% legumes ... 29
Figure 12. The profitability of the farm in GSS when legumes are introduced ... 30
Figure 13. Nitrogen usage on the farm in GSS when legumes are introduced ... 31
Figure 14. Phosphorus usage on the farm in GSS when legumes are introduced ... 31
Figure 15. Energy production on the farm in GSS when legumes are introduced ... 32
Figure 16. Protein production on the farm in GSS when legumes are introduced ... 32
Figure 17. Crop rotation for the farm in SS when legumes are introduced ... 33
Figure 18. The crop allocation for the farm in SS with 0% legumes and 15% legumes ... 33
Figure 19. The profitability of the farm in SS when legumes are introduced ... 34
Figure 20. Nitrogen usage on the farm in SS when legumes are introduced ... 35
Figure 21. Phosphorus usage on the farm in SS when legumes are introduced ... 35
Figure 22. Energy production on the farm in SS when legumes are introduced ... 36
Figure 23. Protein production on the farm in SS when legumes are introduced ... 36
List of tables
Table 1. Earlier studies within the research field regarding legumes, cropping systems and sustainability indicators presented in alphabetical order ... 11Table 2. The indicators applied in this study based on the research by Hayati et al. (2011) and Nambiar et al. (2001) ... 16
Table 3. Shadow price and indifferent prices for legumes in GSS ... 30
Table 4. Shadow price and indifferent prices for legumes in SS ... 34
Table 5. Summary of empirical results ... 37
1
1 Introduction
The introduction presents a brief background of the agricultural sector in the world. This is followed by an introduction of cropping systems, and the possible contribution legumes could provide in a more sustainable agricultural system. The problem is stated, and the aim and research question is introduced.
1.1 Background
Since the latter half of the 19th century, global food production and world population have increased (Yang et al., 2018). As the world population increases the demand for food increases as well, and Yang et al. (2018) argue that market demand will keep on growing until 2050. To support the increasing demand for food, agricultural production in the world needs to increase, and this growth in production needs to be achieved without harming the environment (Diaz-Bonilla et al., 2014). The agrarian sector in the world accounts for a substantial environmental impact (Bockstaller et al., 2008). These impacts could be greenhouse gas emissions, eutrophication, and loss in biodiversity.
The United Nations (UN) has defined sustainable development goals that aim for a sustainable future (United Nations, 2018). It consists of 17 goals that relate to different areas of sustainable development. Number 2 of the sustainable development goals is the goal Zero Hunger that addresses aspects of sustainable development in connection with agricultural production. One sub-target of the Zero Hunger goal is to reach a more diversified agricultural production with more diverse farming systems. Since the 1900s, 75 % of crop diversity has disappeared from the fields, and the UN aims for a more diversified agricultural production. In order to develop a more sustainable agricultural production, it could be of importance that farming systems become more diversified (Imadi et al., 2016). According to Imadi et al. (2016), more sustainable farming systems could enhance biodiversity and increase food security.
A common way to define sustainability is by triple bottom line with three dimensions of sustainability; economic sustainability, social sustainability, and environmental sustainability (Elkington, 1998). Environmental factors in agriculture can be, greenhouse gas emissions from the production of crops, social factors can be, contribution to food security and economic factors may be, the profitability of a company (Zhen & Routray, 2003). A concept that has a close link to sustainability is the concept of Sustainable development (Székely & Knirsch, 2005). Sustainable development was defined in the book Our Common Future as: “development that meets the needs of the present without compromising the ability of future generations to meet their own needs” (World Commission on Environment and Development, 1987, p. 43). These two concepts have set the pace for the sustainability work in today’s enterprises (Székely & Knirsch, 2005)
In research regarding sustainable agriculture, the farm is viewed as a system that produces outputs in terms of, e.g., cereals, livestock or milk (Craheix et al., 2016; Imadi et al., 2016). A cropping system is described as a sequence of crops grown and the practices used for producing them (Blanco-Canqui & Lal, 2008). The concept includes the consideration of all techniques used for producing a crop and all possible cropping sequences over time. Within a cropping system, farmers form decisions on which crops and inputs to use (Dury et al., 2012). Essential factors to consider within a cropping system are resources such as arable land, fertilizer input, and which crop to grow at each field. The management of these resources influences the
2
profitability of the farm (Debertin, 2012). According to Blanco-Canqui and Lal (2008), it is common to concentrate on high yield and high-value crops in a cropping system without considering the effects one crop can have on another crop. These effects could be the pre-crop effect, enhanced soil structure, and a decrease in fertilizer usage. Depending on how the cropping system is managed, it can affect the sustainability of a farm (Lehtonen et al., 2005; Pannell & Glenn, 2000). The focus on high-value crops is also a trend in Swedish agriculture. Statistics of Swedish crop allocation shows that a large acreage of Sweden is covered with cereal crops (Fogelfors, 2015).
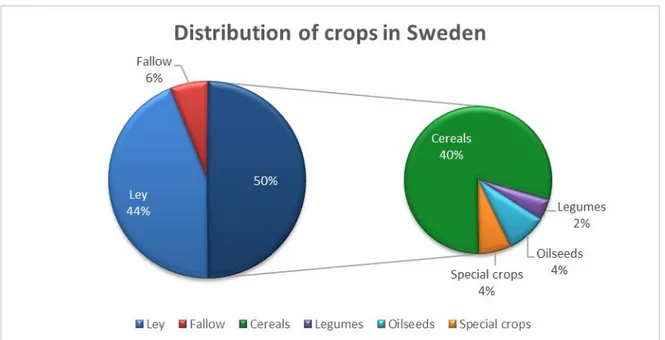
The Swedish crop producing farms tend to focus on a few crops, and figure 1 shows the distribution (Jordbruksverket, 2018b). The year 2017, cereal, legumes, oilseed, and special crops covered 50 % of the total acreage in Sweden, ley covered 44 % of the total acreage, and 6 % was fallow land. Without consideration of ley and fallow, 80 % of the acreage consists of cereals, and 20 % consists of oilseed, legumes, and special crops such as sugar beets and potatoes. Generally, crop-producing farms do not grow ley, and the smaller circle represents how a crop-producing farm in Sweden would allocate its resources (Fogelfors, 2015).
Figure 1. Distribution of crops in Sweden 2017 (Jordbruksverket, 2018b) (own rendering)
More sustainable cropping systems could be systems that include other crops than today’s agriculture (Liu et al., 2016). Cropping systems that include more types of plants can contribute to a reduction of the use of fertilizer and chemicals, which both reduce the climate impact and the eutrophication (Stagnari et al., 2017). According to Liu et al. (2016), it could be necessary to diversify the crop rotation to tackle future problems with diseases connected to crops that might arise due to climate change. One way to diversify the cropping systems could be to increase the acreage of legumes in cereal dominated cropping systems (Ebert, 2014). The legumes could contribute both by the possibility to fixate nitrogen in the ground and its economic pre-crop values (Preissel et al., 2015). Examples of legume crops are soybeans, peas, and broad beans.
Figure 2 shows the acreage of legumes in Sweden between the years 2005 and 2018. During the years 2005-2015, the acreage of legumes in Sweden has been at an average level of 1.4 % of the total acreage (Jordbruksverket, 2018b). In 2015 the European Union launched a policy known as the ecological focus area (EFA) where the farmer needs to grow a particular crop
3 such as legumes or fallow on 5 % of cultivated land (Söderberg, 2016). As a result, the legume production acreage increased from 1.4 % to 2.3 % of the total acreage in Sweden.
Figure 2. Total legume acreage in Sweden as a percentage of the total acreage for agricultural production (Jordbruksverket, 2018b) (own rendering)
1.2 Problem statement
In 2018, the European Union launched the protein plan; this plan intends to increase vegetable protein production in the European Union (European Comission, 2018). One goal is to diversify the cropping systems by increasing the acreage of protein crops in the union, e.g., legumes. The protein plan also proposes that the European Union should increase its self-sufficiency on plant-based protein for human consumption. Within the European Union, there is a trend towards more awareness of what people eat. People tend to consume more vegetable protein to benefit the environment (Naylor, 2016). The demand for plant-based protein for human consumption has increased by 11 % annually in the years 2013-2017 (European Comission, 2018). This green trend opens the possibility for producers to market products that might have been uneconomic to produce before due to low demand and low prices (Naylor, 2016). From the increasing demand, legumes could become more competitive in an economic perspective compared to other crops. This trend, combined with the protein plan, might increase the acreage of legumes in the European Union (European Comission, 2018).
It is widely agreed that legumes are a possible way to increase the environmental sustainability in today's cropping systems (Röös et al., 2018; Reckling et al., 2016a; Ebert, 2014). By diversifying the cropping system, legumes can contribute to more robust and less vulnerable systems, concerning diseases, which could reduce the dependency on pesticides and increase profits (Zander et al., 2016). Previous research in an international context tend to focus on methods to evaluate the sustainability of a farm, and not predict how a farm would perform with new crops (Liu et al., 2016; Robert et al., 2016; Sadok et al., 2009). Tidåker et al. (2018) presented different methods to evaluate sustainability on-farm level and found that no universal system exists. Examples of systems for assessing sustainability are the RISE and MASC systems (Sadok et al., 2009; Hani et al., 2003). These focus on collecting a large amount of data regarding a specific farm, and from this data, develop several indicators that contribute to assessing the sustainability of the farm.
4
Reckling et al. (2016b) performed a study of legumes and the effects it would have on cropping systems in the Swedish region Västra Götaland. Reckling et al. (2016b) found that the legumes had a positive impact based on the indicators, nitrogen efficiency, nitrogen leakage, and gross margin. The study that Reckling et al. (2016b) performed focuses mainly on the benefits of the nitrogen fixation and does not focus on the three dimensions of the triple bottom line. International studies of sustainability in agriculture tend to use other sets of indicators than Reckling et al. (2016b) applied, such as energy efficiency and profitability (Tidåker et al., 2018; Hayati et al., 2011; Yli-Viikari, 1999). The United States Environmental Protection Agency argues that it could be of importance to monitor the phosphorus usage in agriculture since it causes eutrophication (Environmental Protection Agency, n.d.). When studying crop effects and sustainability in an international context, the study apply optimization models to capture what happens in the cropping system (Liu et al., 2016). From these optimization models, it is possible to identify indicators of sustainability, and these contribute to show whether the systems are more, or less sustainable (Meul et al., 2008).
Within Sweden, no optimization study regarding the sustainability aspects, in terms of the triple bottom line, of legumes in a cropping system exists. This creates a gap in the literature and leads to the aim of this study (Sandberg & Alvesson, 2011). A study of the triple bottom line aspects could act as both decision support for farmers and politicians (Magrini et al., 2016). For farmers, a deeper understanding of the effect legumes hold in a cropping system could be helpful in the planning of their business (Zimmer et al., 2016). For politicians, information concerning the triple bottom line aspects of the legumes could be helpful when forming future policies (Meynard et al., 2018).
1.3 Aim
This study aims to examine how a diversification with legumes would affect typical Swedish cereal dominated cropping systems in terms of sustainability. More specifically, the three dimensions of the triple bottom line will be investigated separately. Indicators of sustainability in each dimension are identified, and these show the effect legumes hold in the cropping system. To reach the aim, the following three research questions are developed.
How is profitability affected when more legumes are introduced in typical Swedish cereal dominated cropping systems?
How is nitrogen use and phosphorus use affected when more legumes are introduced in typical Swedish cereal dominated cropping systems?
How are energy production and protein production affected, in terms of edible energy and protein for livestock and human, when more legumes are introduced in typical Swedish cereal dominated cropping systems?
To answer the questions, an optimization model is constructed of the cropping system to explore what happens when legumes are introduced. Two case farms are developed and used in the optimization model to examine how the indicators change.
1.4 Delimitations
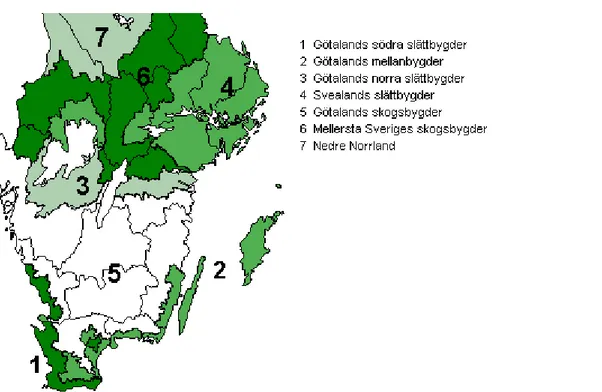
The study is geographically limited to consider two crop-producing areas in Sweden. The crop producing areas that are considered and investigated separately are Götalands Södra Slättbygder (GSS) and Svealands Slättbygder (SS). Figure 3 shows where these crop-producing areas are located. These two regions are chosen due to the regional differences in terms of crops grown.
5 In SS 85 % of the cultivated cropping area is grown with only cereals (excluding ley and fallow), while in GSS 67 % of the area is grown with only cereals (excluding ley and fallow). The other percentages consist of other crops such as rapeseed and sugar beets. The exclusion of ley is motivated since crop farms rarely include ley in their cropping system (Fogelfors, 2015). In SS 1,9 % of the acreage is covered with legumes and in GSS 1,6 % of the acreage is covered with legumes, which is close to the average amount of legumes in Sweden (Jordbruksverket, 2018b).
Figure 3. Production areas in southern Sweden (Jordbruksverket, 2018c) (own rendering)
Three legumes are considered in this study, broad bean, yellow peas, and feed peas. These crops are already grown in Sweden and are possible to grow in the two considered regions (Fogelfors, 2015). These three crops can be used for both feed consumption and human consumption, and this is the reason for focusing on these three crops. Other legumes are excluded due to a lack of data on harvest levels and Pre-Crop effects. The study only considers conventional production.
This study is delimited to consider cropping systems and the effects that occur within a cropping system. The effects that livestock could have in a farming system are therefore not considered. All harvested crop is expected to be sold in the market, and it is assumed that the possibility to sell the produced goods exist. The study does not consider whether market channels exist to market the products. This study is delimited to analyze the effects of diversification with legumes from a triple bottom line perspective of sustainability. This study evaluates what happens with a cropping system without legumes and with legumes, based on several indicators of sustainability. These indicators could be of help for decision makers.
The study does not consider the risk attitude of farmers and the risk that is connected to growing legumes. Reckling et al. (2018) argue that the risk is higher in legume crops than cereal crops. The risk is higher since the variation in legume harvest level is greater, and the farmer takes a higher risk when growing this crop. However, there is research which indicates the opposite, Döring (2015) states that yield variation of legumes is often overestimated and in some cases,
6
it is lower than cereal yield variation. Risk is not considered in this study since focus lies on the sustainability effects of introducing legumes.
The nutritional contents of the crops can be challenging to determine (Nemecek et al., 2008). This study is limited to investigate the actual energy and protein produced by the crops and not the energy that humans or animals can process. No valuation of the quality of energy and protein produced is done; instead, the differences between the two cases, no legumes and with legumes are discussed. This approach is similar to the way Nemecek et al. (2008) designed the study on how legumes affect cropping systems in Europe.
1.5 Structure of the report
In this section, the structure of the report is presented and is illustrated in figure 4. Chapter two presents a literature review of articles relevant for this study to obtain a deeper understanding of the research field. Chapter three presents the theoretical framework that is used in this study, and the central theories are explained. Chapter four presents the methodology applied in this paper. The fifth chapter presents the data and empirical results. The sixth chapter discusses the implications of the results, and the seventh chapter presents the conclusion.
Figure 4. Illustration of the structure of the report
7
2 Literature review
A literature review is a thorough and critical evaluation of previous research on a topic of interest to the author. A useful literature review will define key terminology and identify a theoretical framework for the topic being addressed (Allen, 2017). The literature review will also help to describe previous research in the field that is relevant for the aim and research question (Bryman & Bell, 2015). In this study, a narrative literature review is applied. The narrative literature review provides the potential for individual insights and opportunities for speculation compared to, for example, a systematic review (Allen, 2017).
The literature review of this paper is built around the keywords: Sustainability of legumes, sustainability indicators, cropping systems, crop rotation effects, diversification of cropping systems, optimization, and profit maximization. The databases that are used are Google Scholar, Food Science and Technology Abstracts, Web of Science, and SLUs search engine PRIMO. The material in the literature review is collected from academic journals, theses, books, and dissertations.
There are numerous scientific articles and books regarding the properties of legumes, both international and Swedish. Previous research focuses on the properties of the legumes plants and the possible contribution it could have to the sustainability of the cropping systems. The following literature review presents previous research within the field of legumes. It also presents previous research on economic models of farms and cropping systems. Lastly, it gives a brief introduction to the previous research of sustainability indicators.
2.1 Previous studies of legumes
Several articles on the properties of legumes were found in the literature review. The most relevant articles are presented in the following chapter.
2.1.1 Economic effects of legumes
Within the research field of legumes and the effects legumes can have within a cropping system a number of articles have been published (Zander et al., 2016; Zimmer et al., 2016; Döring, 2015; Plaza-Bonilla et al., 2015; Preissel et al., 2015). Preissel et al. (2015) performed a literature review of previous articles published on pre-crop effects and benefits of legumes. Preissel et al. (2015) find that the pre-crop properties affect the economic and environmental sustainability within a cropping system positively. Ebert (2014) presented similar results in his review on food security in a changing world. In the study, Ebert (2014) found that a legume supported cropping system could increase the income of the farmers because of the pre-crop effects. Ebert (2014) also found that a legume supported cropping system could increase the food security of the system. Meynard et al. (2018) propose that more research should be done on the economic and environmental values of legumes in cropping systems to advance the state of knowledge in the field. Research on such effects should be done in the specific regions where the crops are grown (Preissel et al., 2015). Reckling et al. (2016b) performed a study in the Swedish region Västra Götaland to examine the effects of legumes on cropping systems in the region. Through quantitative data collected from the board of agriculture, Reckling et al. (2016b) simulated possible crop rotations in the region and then modeled gross margins for the crops and how the legumes affected the nitrogen usage. The findings pointed towards an environmental gain in terms of less nitrogen usage but only a small effect on the gross margin.
8
Most research that examines the effect crops have in a cropping system tends to be of the modeling nature (Smith et al., 2017; Stagnari et al., 2017; Reckling et al., 2016b; Zander et al., 2016). Pre-crop effects are introduced as an attribute on the subsequent crop to create an image of how the pre-crop properties affect the entire system. The effects legumes on the subsequent crop are usually an increase in yield of 500-1500 kg. This yield increase is not always considered as an attribute of the legume but rather an attribute of a subsequent plant rotation (Magrini et al., 2016).
Magrini et al. (2016) investigated the rare presence of legumes in French agriculture from an evolutionary economics perspective. Evolutionary economics takes into account the disequilibrium of a specific event, taking place on the market. It could be a disequilibrium in terms of knowledge, technological expertise, or how the market has developed during the years investigated. According to Magrini et al. (2016), the profitability of legumes is too low because farmers do not calculate margins and yields at the scale of rotation. Magrini et al. (2016) also argue that the low presence of legumes is due to how the markets in Europe have developed. The market favors cereal crops since these are crops where expertise and knowledge exist. The market is in a lock-in that favors cereal crops. Magrini et al. (2016) propose that more research needs to be performed on the subject of cost-accounting methods and nitrogen management in agriculture, to get out of this lock-in. Zimmer et al. (2016) did a study on the attitude that Luxemburgish farmers have towards legumes. The study built on a survey-based method that tried to find an answer to the question of why farmers choose not to grow legumes. The findings pointed towards a gap in the knowledge between farmers and researchers. The main conclusion of the study was that there is a wide gap between the farmers’ perception of the value of legumes and the economic fact of their relative competitiveness. Meynard et al. (2018) performed 55 semi-structured interviews with French farmers to find the reasons for lack of diversification in French agriculture. The authors highlight that the value-chain needs to be further developed to diversify the cropping systems in France.
Preissel et al. (2015) argue that the profitability within a cropping system is a way to measure economic sustainability. The argument that profitability can measure economic sustainability is supported by Hayati et al. (2011). Smith et al. (2017) conducted a study on the performance of cropping systems in Canada. In the study, different sets of crop-rotations were analyzed to check for its economic performance with and without legumes. Smith et al. (2017) found that the legumes had the potential to improve the gross margin of the cropping system to 194 dollars per hectare compared to the 62 dollars for the traditional crop rotation. The model Smith et al. (2017) designed was quantitative, and they used data from a long-term crop rotation experiment to develop the model. The traditional crop rotation in this region of Canada was considered as Wheat – Wheat – Fallow. According to Preissel et al. (2015), studies of the profitability of legumes in cropping systems are useful as decision support for both farmers and politicians.
2.1.2 Environmental effects of legumes
The research on the environmental effects of legumes tends to focus on the nitrogen fixating properties of the plant (Zander et al., 2016; Preissel et al., 2015; Therond et al., 2011). The ability to fixate nitrogen is a biological property of the plant. Legumes can fixate around 130 kg of nitrogen and of that nitrogen 20-30 kg is left in plant residue for the subsequent crop (Zander et al., 2016). The production of fertilizer (Nitrogen, Phosphorus, and Potassium) is energy intensive, and approximately 40 % of the greenhouse gas emissions from crop farms originate from the production of chemical fertilizer (Berglund et al., 2009). In most research regarding the sustainability of legumes, nitrogen usage in the cropping system is used as an
9 indicator of the sustainability of the system (Zander et al., 2016; Preissel et al., 2015; Therond
et al., 2011). Hayati et al. (2011) highlight that it could be necessary to focus on more indicators
when assessing the environmental sustainability of cropping systems, and presents dependency on Phosphorus as another important indicator to account.
Phosphorus is a finite resource, and according to Cordell et al. (2009), an essential component in today’s agriculture. Cordell et al. (2009) believe that it is necessary to monitor the use of phosphorus to get a good view of how the finite resource could be optimally used in the future. Since phosphorus is a scarce resource, it is likely that prices would rise in the future. Price rise on a resource could influence both the economic and environmental sustainability of a cropping system (Preissel et al., 2015; Debertin, 2012). A price increase could also have a socioeconomic effect since a rise in prices would affect poor farmers first (Ebert, 2014; Cordell et al., 2009). In a study of the world production on cereal and legumes, it was found that cropping systems that included legumes, used more phosphorus than the cropping systems without legumes (Lott
et al., 2011). The study was performed in a world content, and six continents, Asia, Europe,
South America, Oceania, North America, and Africa were investigated. Lott et al. (2011) argue that it is essential to monitor phosphorus usage in agriculture since it holds a possibility to influence the sustainability of today’s agriculture. In the study, they investigated phosphorus use in systems with and without legumes to see how the phosphorus usage was affected. The method was quantitative, and they found that the cropping system including legumes, used around 18% more phosphorus than the ones excluding legumes. According to Mitran et al.
(2018), legumes need more phosphorus to keep the plants growing because the phosphorus is
needed in the nitrogen-fixation process.
2.1.3 Social effects of legumes
Ebert (2014) argues that legumes could be important in future cropping systems to support the growing population of the world and contribute to social sustainability. According to Ebert (2014), a legume supported cropping system could increase both the energy production of the system and protein production. Nemecek et al. (2008) support the arguments proposed by Ebert (2014) that protein production could increase in the system. However, Nemecek et al. (2008) find that energy production in cropping systems including legumes produces 1-19 percent less gross energy compared to cropping systems without legumes. If energy production and protein production is affected negatively when legumes are introduced into a cropping system, it is possible that social sustainability decreases (Ebert, 2014).
According to Stagnari et al. (2017), it could be of importance to perform further research on the topic of the socioeconomic effects that legumes hold. Examples of socioeconomic benefits proposed are that legumes could decrease the use of external inputs such as fertilizers and agrochemicals. This could also increase the health of the farmers growing legumes, and in the end hold a social benefit in the society as a whole (Ebert, 2014)
2.2 Economic models of farms and cropping systems
It is possible to develop empirical models of farms that economically mirror the farms (Liu et
al., 2016; Debertin, 2012; Andersson & Wall, 2009; Larsén, 2008; Blad, 2004). These models
can be in the form of a profit maximization problem where the optimal allocation of resources within a farm is identified. These models are similar to the profit maximization models that Preissel et al. (2015) presented. By creating an empirical model in terms of an optimization model of the cropping systems, it is possible to change parameters within the system. These
10
parameters could be fertilizer usage or which crop to grow. Liu et al. (2016) treats the subject of crop production systems and develops a dynamic model of the crop production systems. In the research, a dynamic optimization model is applied to collected data. The optimization framework is developed to account for long-term effects that crops could have in-between years factors, and data collected from several sources are used to determine the effects crops can have in the system.
Castellazzi et al. (2008) present a detailed economic model of crop rotations. In the paper, Castellazzi et al. (2008) discuss that crop rotations do not necessarily have to be fixed in terms of what crops are grown every year. Crop rotation is said to be fixed, cyclical or flexible. In flexible crop rotation, the farmer changes its decision depending on price levels and the yearly properties. The paper presents a good illustration of the decisions the farmer faces when designing crop rotations. Larsén (2008) modeled crop rotations by using crop rotational constraints in the dissertation on how collaboration affects farms in Sweden. The crop rotational constraints are designed from the biological properties of the plants, the technology available on the farm, and the area in which the crop is grown. Within the modeling of a cropping system, the information provided by Castellazzi et al. (2008) and Larsén (2008) is useful to mirror the decisions a farmer faces when deciding what crops to grow.
2.3 Sustainability assessment methods
Pannell and Glenn (2000) discuss the problem of the many sustainability indicators proposed by scientists. Most of the sustainability indicators today are inspired by the triple bottom line. According to Pannell and Glenn (2000), there is no guidance to which of the indicators provided in the literature that provide sufficient information about the complex issue of sustainability. A fundamental criterion for choosing to monitor an indicator is that the benefit of doing it must exceed the costs. They see no meaning to include indicators who already are widely monitored, for example, yield, weed problems, market prices, bank balance, equity, and interest rates. It should not do any different to include these indicators into a sustainability indicator framework because the farmers already consider it.
Singh et al. (2012) presented an overview of sustainability assessment methods and concluded that there are several existing methods to assess sustainability. Within these methods, the authors conclude that most existing approaches to measure sustainability tend to focus on environmental sustainability, and not the three dimensions of the triple bottom line. The authors argue that it could be of importance to think of the interlinkages between indicators and between different properties within a system. Tidåker et al. (2018) did a review on the many sustainability indicators that exist today; in the review, it is concluded that no universal system exists. However, it can be noted in the review that when assessing the sustainability of a cropping system, most assessment methods try to assess the sustainability of the three dimensions of sustainability. According to Hayati et al. (2011), it is essential that sustainability indicators capture the three dimensions of sustainability. No single indicator can do this; instead, a set of indicators can be used to assess sustainability.
11
2.4 Summary of literature review
Table 1. Earlier studies within the research field regarding legumes, cropping systems and sustainability indicators presented in alphabetical order
Author Subject Region Method
Andersson and Wall (2009)
Emissions from Swedish farms Sweden Quantitative modeling Berglund et al. (2009) Emissions from Swedish agriculture Sweden Quantitative
Blad (2004) Modeling of farms Sweden Quantitative modeling Castellazzi et al.
(2008)
How to model crop-rotations UK Quantitative Cordell et al. (2009) Food security and phosphorus Global Review Debertin (2012) Agricultural production economics Global Book Döring (2015) Discusses legumes in cropping systems Europe Quantitative Ebert (2014) Food security and cropping systems Taiwan Qualitative Hayati et al. (2011) Ways to measure agricultural
sustainability
Global Review Larsén (2008) Presents methods to model cropping
systems
Sweden Quantitative Liu et al. (2016) Economic model of crop rotations Not clear Quantitative Lott et al. (2011) Role of phosphorus in legume and cereal
production
Global Quantitative Magrini et al. (2016) Presence of legumes in French
agriculture
France Qualitative/quantitative Meynard et al. (2018) Diversification in French agriculture France Qualitative
Mitran et al. (2018) Phosphorus role in legume production Global Review Nemecek et al. (2008) Protein and Energy production in
agriculture
Europe Modeling Pannell and Glenn
(2000)
Sustainability indicators in agriculture Australia Quantitative Plaza-Bonilla et al.
(2015)
Discusses the benefits of legume plants France Field study and simulation Smith et al. (2017) Diversification of crop rotations Canada Quantitative Zander et al. (2016) Increase legumes in the EU EU Review
Preissel et al. (2015) Benefits of legumes in cropping systems Europe Modeling/quantitative Reckling et al. (2016b) Assessment of legumes in cropping
systems
Germany, Sweden
Quantitative Singh et al. (2012) Overview of sustainability assessment
methods
Global Review Smith et al. (2017) Diversification of crop rotations Canada Quantitative Stagnari et al. (2017) Benefits of legumes Not clear Quantitative/review Therond et al. (2011) Modeling of cropping systems EU Quantitative simulation Tidåker et al. (2018) Ways to measure sustainability Sweden Review
Zander et al. (2016) Decline in legume production EU Review Zimmer et al. (2016) The gap of knowledge on legume
production amongst farmers
Luxembourg Qualitative
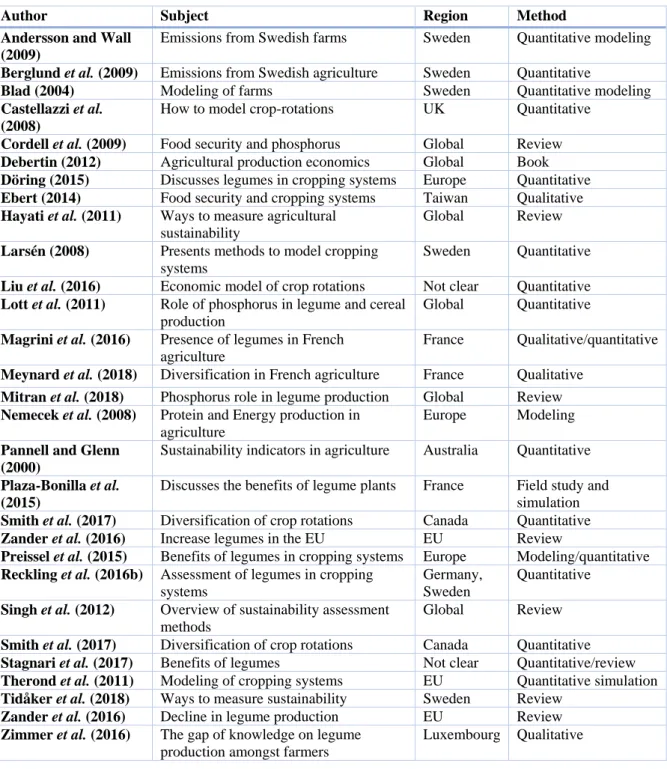
Research exists both on indicators of sustainability, cropping systems, and the effects of introducing legumes in cropping systems. Table 1 shows the articles which are identified as the most important ones in the literature review. Most studies identified in the literature review have been performed in other countries than Sweden. Within Sweden, only one study that examines the effects of legumes in cropping systems has been identified (Reckling et al., 2016b). The study performed by Reckling et al. (2016b) focuses on nitrogen use and efficiency within the cropping system and does not capture all the dimensions of the triple bottom line.
12
According to Hayati et al. (2011), it is of importance to capture all three dimensions of the triple bottom line when assessing sustainability. The theoretical gap that is identified is that no previous study has focused on the three dimensions of the triple bottom line within legume production in Sweden. It is also identified that a common way to measure how diversification affects a cropping system is by performing simulations with different types of crop combinations and collect indicators of how the system performs (Smith et al., 2017). This study aims to fill this gap and to provide relevant decision support for farmers when forming decisions regarding the cultivation of legumes.
13
3 Theoretical framework
This chapter presents the central theories applied in this paper. Firstly applied microeconomics is introduced and the theories of profit maximization. Secondly, the theories regarding sustainability and sustainability indicators are introduced. Finally, alternative theoretical approaches are presented, and arguments are presented on the suitability of the theoretical framework applied in this paper.
3.1 Applied microeconomics and production economics
A central part of this study has microeconomics as a theoretical ground. The foundation of microeconomics is about the economic behavior of individual entities (Pindyck, 2018). Production economics is an area within the microeconomic theory, which is mainly applied in this study combined with theory regarding sustainability. Production economics describes, based on the preferences of a producer, for example, the complex relationship between economy, technology, and biology and how limited resources are optimally utilized (Olhager, 2013).
Producers are often assumed to maximize the profits of their businesses, but they could have other individual goals (Debertin, 2012). In the case of agriculture, farm managers design their farm to maximize profits based on resource restrictions such as land, labor and climate conditions, but they could also organize their farm to maximize farm size or minimize climate impact. One thing that suggests that farmers choose to maximize profits is that they can use the profits to meet other goals.
3.1.1 Profit maximization
Profit maximization aims to produce the products and the number of products that yield the highest profit (Debertin, 2012). Equation (1) generally describes the simplest maximization problem with one output product and one input resource.
Π = 𝑃𝑦 ∗ 𝑌 − 𝑃𝑥∗ 𝑋 𝑠. 𝑡. 𝑌 ≥ 0, 𝑋 ≥ 0 (1)
Where the profit (Π) is obtained through the difference between total revenue and total cost (Debertin, 2012). Total revenue is obtained by output price (Py) and quantity produced (Y), and
the total cost is obtained by input price (Px) and the quantity of used resources (X).
The quantity (Y) depends on the number of inputs and is explained like a function of the input (𝑓(𝑋)) (Debertin, 2012). The quantity (Y) can also be fixed, and the number of inputs (X) depends on the quantity (Y) and is explained like a function of output(𝑋(𝑌)). The functions describe the biological and technical relationship between input and output, and it is called the production function. In the short term, there are often costs that are not affected by the quantity produced (Y), and these are fixed costs (FC). A general form of this relationship is presented in equation (2) and (3).
Π = 𝑃𝑦 ∗ 𝑓(𝑋) − 𝑃𝑥∗ 𝑋 − 𝐹𝐶 𝑠. 𝑡. 𝑋 ≥ 0 (2)
14
Maximal profit is given by the relationship in equation (4) an (5) where marginal revenue is equal to marginal cost (Debertin, 2012).
𝜕Π 𝜕𝑋 = 0 ⟹ 𝑃𝑦∗ 𝜕𝑓(𝑋) 𝜕𝑋 − 𝑃𝑥 = 0 ⟹ 𝜕𝑓(𝑋) 𝜕𝑋 = 𝑃𝑥 𝑃𝑦 (4) 𝜕Π 𝜕𝑌 = 0 ⟹ 𝑃𝑦− 𝑃𝑥∗ 𝜕𝑋(𝑌) 𝜕𝑌 = 0 ⟹ 𝜕𝑋(𝑌) 𝜕𝑌 = 𝑃𝑦 𝑃𝑥 (5)
Producers often act in situations where many different inputs are required to produce many different outputs (Debertin, 2012). Equation (6) describes a general profit maximization problem with many outputs and many inputs.
Π = 𝑃𝑌1∗ 𝑌1+. . . +𝑃𝑌𝑚∗ 𝑌𝑚− 𝑃𝑋1 ∗ 𝑋1−. . . −𝑃𝑋𝑛∗ 𝑋𝑛− 𝐹𝐶 (6) Where: 𝑌1 = 𝑓1(𝑋1, … , 𝑋𝑛) 𝑌𝑚 = 𝑓𝑚(𝑋1, … , 𝑋𝑛) Or: 𝑋1 = 𝑋1(𝑌1, … , 𝑌𝑚) 𝑋𝑛 = 𝑋𝑛(𝑌1, … , 𝑌𝑚)
In the agricultural sector, farm managers face a situation such as described in equation 6. The farm manager must determine which crops/products (𝑌1, … , 𝑌𝑚) to grow, such as wheat, barley,
rapeseed and legumes, and how much inputs (𝑋1, … , 𝑋𝑛) such as fertilizer, seed, chemical and, labor to be used for each crop. The price levels of the inputs and outputs could influence the economic sustainability of a farm (Preissel et al., 2015). Depending on the price levels of the inputs, the profit can either raise or fall (Debertin, 2012). A rise in prices of outputs could affect how much a specific input is used, and if the input price of a resource increases, it could affect the optimal allocation within the analyzed system. In the case of this study, a high price on the resource nitrogen might contribute towards a profit maximization solution with more legumes. This because of the pre-crop properties, and the fact that it contributes to 20-30 kg of nitrogen to the preceding crop (Zander et al., 2016).
3.2 Indicators of sustainability
Today, a lot of the frameworks that exist to measure sustainability account for the three aspects of economic, social and environmental sustainability (Tidåker et al., 2018; Singh et al., 2012; Labuschagne et al., 2005). Within these frameworks, it is common to design indicators that can measure distinct parts of the sustainability dimensions, as is shown in figure 5. These indicators are designed to capture the effects in separate parts of the system where sustainability is measured (Labuschagne et al., 2005).
15
Figure 5. Example of an indicator framework and what indicators can measure (Labuschagne et al., 2005)
The indicators can be designed to measure the effects that take place within the system if a change is made to the system. According to Pannell and Glenn (2000), it is essential that the benefits of evaluating a system with an indicator exceed the costs of doing it. Sustainability is a complex issue, and no single indicator can measure all three dimensions of sustainability. According to Nijkamp and Lancker (2000), a major scientific challenge in any analysis of sustainability is to offer an empirical test to whether a given system is more sustainable than another case. Further on, Nijkamp and Lancker (2000) argue that it is necessary to specify a set of sustainability indicators that can be measured in either a qualitative or quantitative way. It is not necessary to determine whether one state is more or less sustainable, but rather, the indicators should be seen as pointers that help in development planning and decision-making. Within the field of sustainability, there are specific frameworks that are designed to assess the sustainability of agricultural systems. These indicators could, therefore, serve as useful information for farmers in the planning of their business, or decision makers when forming policies.
3.2.1 Indicators of sustainability within agriculture
As explained in the previous section, sustainability indicators deal with the complex issue of measuring sustainability, and no single indicator can measure all dimensions of sustainability (Pannell & Glenn, 2000). Within the field of agriculture, there are some developed frameworks to measure sustainability at the farm level (Tidåker et al., 2018). According to Hayati et al. (2011), most of the frameworks and indicators designed to measure the sustainability of agriculture are suitable to evaluate the sustainability of agriculture at an aggregate level. However, Hayati et al. (2011) argue that there are indicators that can capture sustainability effects within a farm system, and to capture the effects it is necessary to define a boundary of the system that is analyzed. The distinct systems can be cropping systems, farming systems, or landscape district levels. In this paper, the limit of the system is the cropping system.
16
The indicators for sustainability within the field of agriculture are designed to capture specific issues that a farmer can face (Tidåker et al., 2018). Indicators of sustainability within the field of agriculture could be indicators such as crop yield, nitrogen usage, and energy production. The literature regarding indicators of sustainability within farming systems presents a diversity of distinct frameworks to evaluate sustainability performance (Keys, 2017; Singh et al., 2012). Examples of such frameworks are the MOTIFS, RISE, and MASC framework (Craheix et al., 2016; Sadok et al., 2009; Meul et al., 2008; Hani et al., 2003).
Nambiar et al. (2001) present six considerable criteria when designing and constructing indicators for sustainability in agriculture. The six criteria are: (i) Social and policy relevance (economic viability, social structure, etc.); (ii) Analytical soundness and measurability; (iii) Suitable for different scales (e.g., farm, district, country, etc.); (iv) Encompass ecosystem processes and relate to process-oriented modeling; (v) Sensitive to variations in management and climate; (vi) Accessible to many users (e.g., acceptability). In the research by Nambiar et
al. (2001), a number of different indicators are presented that can help assess the sustainability
of a farm, e.g., crop yield, soil quality, and agricultural management practices.
3.2.2 Indicators applied in this study
The indicators applied in this paper are indicators of profitability, nitrogen usage, phosphorus usage, energy production, protein production within the cropping system, see table 2. These indicators are based on what is found relevant in the literature review and are also proposed in the paper by Hayati et al. (2011) as indicators that can measure the sustainability of agriculture. These all fit in on the criteria proposed by Nambiar et al. (2001). According to Hayati et al. (2011), dependency on fertilizer, such as Phosphorus and Nitrogen, shows the dependency on natural resources. Energy production and protein production show how the system manages to provide food for the growing population of the world, and profit will act as an indicator of economic sustainability. By combining these indicators, it is possible to measure the three dimensions of the triple bottom line. By assessing the farm with these indicators, it is possible that some other important aspect of sustainability is omitted. This could, for example, be the dependency on herbicides or pesticides. The indicators proposed by Hayati et al. (2011) are applied to assess the sustainability of the cropping systems.
Table 2. The indicators applied in this study based on the research by Hayati et al. (2011) and Nambiar et al. (2001)(own rendering)
Economic sustainability Environmental
sustainability
Social sustainability
Profitability Nitrogen usage Energy production
Phosphorus usage Protein production
In table 2, it is shown what dimension of the triple bottom line the indicators are expected to measure. Profitability is proposed to be the indicator that measures economic sustainability. This indicator was proposed as an important economic indicator by Zhen and Routray (2003) and Hayati et al. (2011). The measurement of environmental sustainability is nitrogen usage and phosphorus usage. These indicators can act as important measurements of environmental sustainability because they hold the ability to capture both effects on eutrophication and decrease in emissions (Hayati et al., 2011; Lott et al., 2011). Social sustainability is measured through energy production and protein production, which both act as indicators of food security (Ebert, 2014). The energy production is measured in the unit megajoule (MJ).
17
3.3 Motivation of theories and alternative theoretical approach
The profit maximization theory, combined with indicators of sustainability that are inserted in the empirical model introduced in chapter 4, will help answer the research questions of this study. Creating an experimental profit maximization model to examine the effects of diversification with legumes in a Swedish cropping system is considered the best possible theoretical choice. By creating a profit maximization problem and using applied optimization, the possibility to identify how the cropping system acts under different circumstances is possible. The result may be useful both for farmers in decision making on production systems and for policymakers. The theory allows the researchers to identify how the cropping system performs with and without legumes. By introducing indicators, profitability, nitrogen usage, phosphorus usage, energy production, and protein production, in the model, it is possible to indicate how the three dimensions of sustainability of the systems change under different circumstances. The profit maximization model in this paper is inspired by the previous work of Jonasson (1996), Brady (2003), Blad (2004), Larsén (2008) and Andersson and Wall (2009).
Evolutionary economics perspective is another theoretical approach, which would be a possible way to understand why there is a lack of diversification within the cropping systems of Sweden. This study could be carried out similarly as the study by Magrini et al. (2016), where semi-structured interviews were carried out with stakeholders in the agricultural sector of France to identify why there has been a decrease of legume production in France. If a similar study is done in Sweden, it would create a possibility to increase the knowledge of why farmers choose not to grow legumes. The paper by Magrini et al. (2016) would be useful if this study aimed to find the reasons behind the relatively low production of legumes in Sweden and possible ways to solve this. This type of study would create a possibility to identify necessary policy changes or necessary technological changes.
The study conducted by Zimmer et al. (2016) is also an inspiration for another theoretical approach. The study investigated the value-chains of linseed, peas, and hemp in France. A similar approach within this study would create a possibility to identify whether there are lock-ins in the value-chain that favor the dominant cereal crops. If this study aimed to investigate why there is a lack of diversification within the Swedish cropping system, a similar approach would be suitable. An approach similar to the approach by Zimmer et al. (2016) would be of help to identify the socio-technical factors that cause farmers to make the decisions to grow the most dominating cereal crops. This type of study could be carried out with a qualitative approach with interviews of stakeholders in the agricultural industry of Sweden, similar to the approach by Zimmer et al. (2016).
18
4 Method
This chapter presents the chosen research strategy and the research design of this study. How the data is collected, and the sources of data are presented. It also presents the empirical model and how the model is designed. Lastly, reliability, validity, and ethical considerations of the research are presented.
4.1 Research strategy
When designing a study and choosing a research strategy, the researcher is generally faced with two different options, the qualitative and quantitative research strategy (Saunders, 2007). Depending on the choice of research strategy, the study may reach different results. This occure since there are differences in the way data is collected and how the analysis is performed. This study aims to examine how a diversification with legumes would affect typical Swedish cereal dominated cropping systems in terms of sustainability. To reach the aim, a quantitative method is applied with a deductive approach and an experimental design. The deductive approach is applied since the purpose of this study is to answer questions and not to generate a new theory (Bryman & Bell, 2015). A quantitative researcher is generally faced with two types of modeling designs, experimental and descriptive. An experimental study determines the causality between variables, and the descriptive determines the relationship (Bryman & Bell, 2015). When applying the theory of profit maximization to numerical data, the causality between the variables is determined and not only the relationship (Debertin, 2012).
According to Bryman and Bell (2015), it is important to mention the ontological and epistemological standpoint when performing research. In this research, the ontological standpoint is objectivism and refers to the philosophical standpoint that there is an objective reality and that events take place independently of social actors. The sustainability effects of legumes in a cropping system are connected to the biological properties of the plant that is introduced in the system (Lott et al., 2011). Therefore, our standpoint is that the role of the social actor is somewhat reduced. The social actor influences the cropping system by choosing what crops to grow and input to use. Once the decision has been made, the social actor does not influence the sustainability of the system. The epistemological standpoint in this paper is positivistic, which means that it is believed that knowledge is based on natural phenomena (Saunders, 2007). The study is based on empirical data where theory is used to examine the issue, and the positivistic standpoint fits the study. In the positivistic view, the influence of the researcher on the data is marginal (Saunders, 2007). As an example, the researcher cannot change the properties of the plants; this is a fact and not something that the researcher influence (Bryman & Bell, 2015; Fogelfors, 2015). It could be argued that the researcher influences the collection of data and the choice of research method (Saunders, 2007). By using a structured methodology in this paper, the aim is to make the study replicable, and another researcher should achieve similar results (Gill & Johnson, 2002).
4.2 Research design
The research design of a study provides the framework for the collection of data and analysis of the data (Bryman & Bell, 2015). The research design of this study is inspired by previous research in the field (Liu et al., 2016; Reckling et al., 2016b; Lehtonen et al., 2005). In general, researchers tend to use similar frameworks as previous research (Yin, 2009). Yin (2009) argues that this is a good way to make the results comparable to previous studies. The previous studies
19 mentioned above have all created experimental models of cropping systems to solve the research problem in question.
According to Yin (2009), the choice of research design can affect the generalizability of the results. In this study, a case study research design is used to collect the data for the study. Two fictitious case farms are examined; this can affect the generalizability of the study since the investigation will provide results from two different farms. Since these farms are located in two regions of Sweden with different production conditions, it is possible that the results are difficult to generalize. However, by using two case farms, the generalizability could raise compared to a study with only one case (Yin, 2009). In a multiple case study with more than two cases, the results can become more generalizable than in a study with two cases. By using two cases from different regions of Sweden, it is possible to create a picture of the situation in different parts of Sweden. Since the case farms are designed to mirror a crop-producing farm in each region, it is possible that another farm with similar production conditions would show similar results.
The use of fictitious case farms is inspired by previous research of Reckling et al. (2016b) and Andersson (2018). The fictitious case farms mirror cereal-producing farms in the two regions SS and GSS. A statistical comparison of how cereal-producing farms are organized is made through aggregate data from the Swedish Board of Agriculture. This statistical analysis consists of an analysis of how the farms allocated their cropping land and are used to develop a fictional crop rotation. This crop rotation is presented as the current state in the methods chapter 4.3 and is used to calculate the indicators for the current state. A more extensive background to the case farms are presented in chapter 4.3. Agronomic expertise through crop advisors is used to discuss if the case farms correctly mirror a cereal-producing farm in the distinct region (pers, comm., Eriksson, 2019; pers comm., Lagerholm, 2019).
The case study is constructed as an experimental study since the intention is to find out what happens to the case farms if legumes are introduced into the cropping system (Stake, 1995). An experimental model in terms of an optimization model is then developed to reach the aim of this study. The two case farms are used to evaluate different scenarios. These scenarios are the two case farms with and without legumes. The experimental design intends to find out what happens with the indicators proposed in table 2, chapter 3.2.1, profitability, nitrogen use, phosphorus use, energy production, and protein production. These indicators are calculated for a scenario with legumes and one scenario without legumes. The indicators will then consist of what happens within the system, depending on the level of legumes within the system.
There is some critique against case studies. Yin (2009) highlights that researchers performing case studies could allow a biased view in their collection and report of data which could influence the results. To try and not influence the results is necessary to consider while performing case study research (Bryman & Bell, 2015). To somewhat eliminate the risk of biasedness in the report of data, it is important that the researcher is careful to report data and findings fairly and correctly (Yin, 2009).
4.3 Case farms
This study develops two fictional case farms, one for the region GSS and one for the region SS. The two farms are located in regions GSS and SS, the allocation of the farms to these regions is made due to their differences in production today (Jordbruksverket, 2018b). In SS, 90 % of the cultivated area is covered with cereals, excluding ley, and in GSS, 70 % is covered with