Proceedings of the USDA-ARS Workshop
“Real World” Infiltration
July 22-25, 1996
ARS Workshop on
"Real World" Infiltration
Proceedings of the 1996 Workshop
July 22-25, 1996
Pingree Park, CO
Planning Committee
L. R. Ahuja, GPSR, Fort Collins, CO (coordinator) David Bosch, SEWRL, Tifton, GA
Gerald Flerchinger, NWWRC, Boise, ID Gary Frasier, RRR, Fort Collins, CO
Sally Logsdon, NSTL, Ames, IA Fred Pierson, NWWRC, Boise, ID
Walter Rawls, HL, Beltsville, MD Roger Smith, WMR, Fort Collins, CO
Compiled and edited by:
L. R. Ahuja and Amy Garrison USDA-ARS-GPSR
Published by:
Water Resources Research Institute Colorado State University
Fort Collins, CO 80523 Information Series No. 86
For further technical information:
USDA-ARS-NP A Great Plains Systems Research
P. O.BoxE Fort Collins, CO 80522
Preface
The science of hydrology embraces the process of infiltration which determines the movement of water into and within the shallow soil mantle that covers the terrestrial surface of our planet. The infiltration process has attracted the scientific attention of geophysicists,
hydrologists, and soil scientists because of the vital role that water plays in our biological world. Considerable progress has been made in identifying and defining the physical laws that govern the movement of water within soils and other porous materials, and in characterizing the hydraulic properties of these materials. However, many major scientific challenges, related to the effects of spatial and temporal changes in these hydraulic properties on the movement of water, have defied the efforts of some of the most brilliant minds in the international scientific community for
decades. Increased public awareness and concern about the potentially adverse long-term economic, health and environmental impacts of many agricultural and industrial chemicals has provided the stimulus for improving our knowledge and understanding of the infiltration process. An improved understanding of the infiltration process at field and larger scales, which encompass large spatial and temporal variabilities due to both natural causes and management effects, will provide society with the knowledge and information needed to make optimal decisions on chemical use and resource management. The challenges are great, the benefits substantial.
This workshop was organized by ARS to review the state-of-science and identify critical further research needs to address the above challenges. The outcomes of this workshop
documented in these Proceedings will serve as a framework for the ARS' s strategic plan for research on infiltration in the near future.
David A. Farrell
National Program Leader, Hydrology USDA-ARS, Beltsville, MD
Table of Contents
Executive Summary ... 1 Specific Goall: Knowledge Gained from Past Plot, Field and Small Watershed Studies
Infiltration and Runoff Plot Studies on Rangelands: Rainfall Simulator Experiments
Jeffry Stone and Ginger Paige . . . 6 Predicting WEPP Effective Hydraulic Conductivity Values on Rangelands
Fred Pierson, Ken Spaeth, Mark Weltz, Steven Van Vactor,
and Mary Kidwell . . . 24 Infiltration Parameters for the WEPP Green-Ampt Model: Cropland Applications
Nearing, M.A., X. Zhang, B.Y. Liu, and L.M. Risse ... 38 Small Watershed Studies: Infiltration Data and Research Needs
G.W. Frasier . . . 57 Infiltration Parameter Calibration using Rainfall-Runoff Data
Roger E. Smith . . . 65
Specific Goal2: New Ideas for Characterizing Spatial Variability
Indirect Estimation ofHydraulic Conductivity and its Spatial Distribution
Dennis Timlin, Walter Rawls, Robert Williams, and Laj Ahuja ... 76 Estimating the Soil Water Retention Curve with Soil Bulk Density and -33 kPa Value
Robert D. Williams, Laj R. Ahuja, and Dennis Timlin ... 91 Use Of Remote Sensing for Determining Spatial Infiltration Characteristics
Thomas J. Jackson and Walter J. Rawls . . . 102 Measurement Methods to Identify and Quantify Spatial Variability oflnfiltration on Rangelands
Ginger Paige and Jeff Stone . . . 109 Statistical and Geostatistical Characterization of Spatial Variability
David Bosch and David Goodrich . . . 122 Characterization of Soil Spatial Variability with Fractals
Daniel Gimenez and Walter J. Rawls . . . 130
Specific Goal 3: Characterizing Temporal Variability
Temporal Variability: Tillage, Reconsolidation, and Compaction Effects on Infiltration Parameters
Walter J. Rawls . . . 142 The Characteristics and Temporal Variability of Infiltration as Affected by Macropores and Plants
Temporal Character of Surface Seal/Crust: Influences ofTillage and Crop Residue
R R. Allmaras, J.L. PikulJr., C.L. Douglas Jr., and R.W. Rickman ... 171 Shrinking/Swelling, Freezing/Thawing And Grazing Effects On Infiltration
G.N. Flerchinger, G.W. Frasier, R.B. Grossman, K.N. Potter,
B.S. Sharratt, and J.D. Williams ... 189
Specific Goal4: Innovations in Computer Modeling of Variabilities
Status and Future ofModeling Spatial and Temporal Variability oflnfiltration
R. E. Smith and D.C. Goodrich ... 204 Infiltration- Scale Interactions
D.C. Goodrich, R.E. Smith, D.D. Bosch, J.J. Stone, G. Paige, J.R. Simanton, W.E. Emmerich, T.O. Keefer, R.A. Shillito, and C.L. Unkrich ... 214 Macropore Modeling: State of the Science
S.D. Logsdon, M. H. Nachabe, and L. R. Ahuja ... 217 Modeling Infiltration Into Frozen Soils
G.N. Flerchinger ... 228
Poster Abstracts
Spatial Variability ofRunoffFrom Small Agricultural Watersheds On Similar Soil-Map Units
James V. Bonta ... 234 "Real World" Precipitation
James V. Bonta and Virginia Ferreira ... 236 Subsurface Lateral Transport in Glacial Till Soils During a Wet Year
S.D. Logsdon and D. B. Jaynes ... 237 Scaling Analysis oflnfiltration at R-5 Catchment
Huan Meng, Jorge A. Ramirez, Jose D. Salas, Lajpat R. Ahuja ... 239 Roughness Influences on Soil Acoustic Impedance
Ron W. Rickman, James M. Sabatier, and K. Attenborough ... 241 "Real World" Infiltration Research at the National Sedimentation Laboratory
M. J. M. Romkens and S. N. Prasad ... 243
Appendix
Partnership with NRCS
T. M. Sobecki and R. D. Y eck ... 246 Research Needs Selected and Prioritized by the Cross-Goal Interest Groups ... 250 Enhanced Consolidated Research Needs and Priorities Assigned
Executive Summary
In today's agriculture, infiltration ofwater into soils is a fundamental hydrological process that plays a dominate role in almost all important natural resource problems or issues, such as runoff, erosion, irrigation, water conservation, groundwater and surface water quality, and global environmental change. Research during the last half century has established a fundamental theory of infiltration into soils at a given point. Attempts to apply this theory to infiltration at a field scale have had only a limited success, mainly due to the large spatial and temporal variability of the governing parameters that exist at field scale. Lumped parameter models have failed to provide the accuracy we need. The research on spatial variability during the last quarter century has enlightened us about the nature of this variability, but the application of this knowledge to develop a field-scale infiltration theory is still in its infancy. Major hurdles are in approximating, measuring, and quantifying the large and complex patterns of spatial and temporal variabilities, and implementing these into a model for field-scale infiltration. Also, very little research has been conducted on characterizing the effects of land use and management practices on the temporal and spatial variabilities; these effects are often more important than the natural variabilities in a given area. These major issues call for new innovative methodologies in characterizing
variabilities, as well as new scale-dependent infiltration theories. At the suggestion of the ARS National Program Staff, the ARS Workshop on "Real World" Infiltration was held at Pingree Park, Colorado, July 22-25, 1996, to address the above issues by reviewing current ARS research and identifying future research needs. Planning for the Workshop started a year earlier. A notice for the Workshop was sent to all ARS research units dealing with natural resources, the National Program Staff, and several cooperating agencies. Thirty-five scientists attended the Workshop, including an invited speaker and two NRCS scientists.
The vision of the Planning Committee was to have a strategic plan for a coordinated ARS infiltration research effort that will accommodate large spatial and temporal variabilities of relevant soil properties at different scales. The following Specific Goals were delineated:
1) Review and analyze the knowledge gained from the past experimental studies on infiltration at plot, field, and small watershed scales, separately for crop- and
rangelands. Assess how parameter variabilities were determined and incorporated in modeling.
2) Analyze old and explore new concepts for identifying and quantifying spatial variability and patterns of relevant soil infiltration parameters of crop- and rangelands, and
practically feasible experimental methods of determining these variabilities at different scales.
3) Analyze, identify, and quantify temporal variability of relevant soil infiltration
parameters of crop- and rangelands, and practically feasible experimental methods of determining these variabilities at different scales.
4) Explore possibilities of new scale-dependent infiltration equations that may indirectly account for large variabilities in relevant infiltration parameters, as well as a
framework for incorporating spatial and temporal variabilities in existing equations and the use of GIS technology.
Teams were organized before the Workshop to prepare written reports on the state-of-the-science and future research needs pertaining to the above goals. These reports were consolidated and sent to all participants before the Workshop.
The first day of the Workshop was devoted to giving of a charge to the participants by the National Program Leaders, followed by presentations by the Specific Goal teams of the state-of-the-science and future research needs identified. Feedback was encouraged after each team presentation. In the evening, Dr. Vijay Gupta, University of Colorado, Boulder, gave an invited talk on the potential use of Cascade Theory in simple- and multi-fractal scaling of infiltration for different spatial scales.
On the second day, eight Cross-Goal Interest groups discussed, modified, added, and ranked the research needs identified by the Specific Goal teams relevant to the subject assigned to each group. The eight Cross-Goal Interest Groups were:
Group 1: MechanicaVmanagement/tillage effects - process knowledge, space-time-causal factor relationships, modeling . . .
Group 2: Experimental methods/measurements for field-scale quantification of spatial and temporal variabilities
Group 3: Biological effects --roots, canopy, worms, ... process knowledge, space-time-causal factor relationships, modeling, . . .
Group 4: Physical effects--freezing-thawing, hydrophobicity, swelling-shrinking, ... Group 5: Parameterization/estimation
Group 6: Stochastic statistical characterizations and modeling Group 7: Spatial characterization needs for precision farming
Group 8: Special topics: Minimum data set, methodologies, amending infiltration, and some general items
In the afternoon, the group leaders presented their group's conclusions to the entire workshop. In the evening, the two National Program Leaders and the two NRCS cooperators gave their
opinion on the prioritized research needs. On the third day, the participants as a whole suggested to National Program Leaders that they appoint a small committee to take the prioritized list of research needs and develop them into a strategic plan for a coordinated ARS research on infiltration. The participants also decided that the proceedings of this Workshop should be published soon.
Prioritized research needs identified by each of the eight Cross-Goal Interest groups are attached as an Appendix. The twelve highest ranked needs overall, not in any order of priority, are as follows:
~ Develop consolidated database of existing plot and watershed infiltration data. Similarities and differences in data sets need to be identified and documented. Need one FTP site for
all data, in standardized format and with information such as georeference, size, soil, methods, etc.
A new book on standardized methods of measurement and analysis; revise Hydrology Handbook and include a data collection protocol - minimum data set, appropriate methodology, and data format .
.,.. Examine relationships between correlation scales and measurement scales in order to minimize the affect of the method (or size of the measurement) on the resulting analysis.
Incorporate terrain attributes into relationships for surface soil attributes, soil hydraulic properties and soil textures to obtain regional-scale prediction equations.
Test multifractal techniques for modeling spatial dependence of properties/processes including methods to incorporate parameter variability into parameter estimation .
.,.. Develop improved predictive models which include:
b) seasonally varying infiltration rates due to plant growth and worm activity, shrink/ swell;
c) systematic small-scale spatial variability such as crop-row position effects.
Conduct a comprehensive review and evaluation of existing data and creation of new data to quantify/estimate the temporal/spatial character of seal/crust as influenced by
distributed residue cover, soil type, wetting/drying, and crops.
Measure and quantify spatial variability of infiltration parameters between plant bases and interspaces, as a function of soil type, grazing intensity, and other factors.
Quantify the changes in infiltration behavior from changes in soil parameters as a result of mechanical modifications, including modeling the aggregate behavior of an area containing internal infiltration variability, with application to "management" modeling.
Improve our knowledge of disaggregation statistics and rainfall intensity distributions.
At larger scales (e.g., 10 ha +),modeling a really variable infiltration should not be done independently of the surface runoff, which has considerable organized and random
heterogeneity itself, nor should it be modeled without consideration of small-scale rainfall rate heterogeneities.
Describe the mean and variance of soil water stored in the root zone as a function of size of the area to help in decision support for precision farming.
Specific Goall
Knowledge Gained from Past Plot, Field and Small Watershed
Studies
Abstract
Infiltration and Runoff Plot Studies on Rangelands:
Rainfall Simulator Experiments
Jeffry Stone and Ginger Paige1
Plot studies on rangelands have been used since the 1930's to investigate fundamentals of the rainfalVrunoff/erosion process and the impacts of grazing management and land characteristics on these processes. The vast majority of studies have reported final infiltration rates on small plots as affected by either grazing intensity or vegetation and soil surface characteristics. Most of the studies are consistent with each other on a qualitative basis. That is, interspace areas have lower infiltration rates than under canopy areas and infiltration rates under high intensity grazing are lower than under low intensity grazing. Ascribing reasons for these differences is more problematic and the studies are less consistent. For example, although many studies have found positive correlations between final rates and increasing vegetation and litter cover, some have not. Parameterization of infiltration models has also been less than successful. The reasons for the lack of success are probably because infiltration is not measured directly and none of the experiments were expressly designed to measure infiltration parameters. Considerations for future research include defining rainfall characteristics in the Western U.S., determining a correspondence between natural and simulated plot response, determining a correspondence among simulators at point, small plot, and large plot scales, quantifying partial area response, conducting interio·r plot measurements, and examining all components of the hydro graph.
Introduction
Plot studies on rangelands have been used since the 1930's to investigate fundamentals of the rainfalVrunoff/erosion process and the impacts of grazing management and land characteristics on these processes. Although some of the studies have monitored plot response under natural rainfall, the vast majority have used some variation of an infiltrometer or rainfall simulator. Rainfall simulation provides a relatively easy and economical way of obtaining a large amount of data under controlled conditions in a short period oftime. In addition, controlled application rates allow for the comparison of steady state infiltration response to alternative management systems, to differences in vegetation and soil characteristics, and facilitates model parameter identification. The two basic components of a rainfall simulator experiment are the type of rainfall simulator used and the experimental design. The types of rainfall simulators used for rangeland infiltration experiments have been drop formers on small plots and stationary and intermittent sprinklers on both small and large plots. The experimental design generally has consisted of an initial wetting of the plot and a data run the following day with the primary data collected being the runoff at the end of the plot.
1
USDA-ARS, Southwest Watershed Research Center, 2000 E. Allen Rd., Tucson, AZ 85719
Problem Statement
The key factors of infiltration rainfall simulator experiments on rangelands have been; 1. measuring the process, 2. relating infiltration rates to land use or vegetation/soil characteristics, 3. identifying infiltration parameters for specific infiltration models, and 4. estimating those parameters from easily measured soil and/or vegetation characteristics. The impact of these factors varies with plot size and thereby influence the manner in which data are obtained, reduced, and presented.
Small plot experiments have the advantages of minimizing the natural heterogeneity of rangeland vegetation, soil, and surface characteristics, reaching steady state relatively quickly, and being easy to implement. The disadvantages are that the absolute amount of runoff during the early portion of the simulated event is small so that measurement error becomes a factor and there can be a fair amount of variability among plots.
Large plot experiments have the advantages that the heterogeneity is averaged and the runoffhydrograph is better defined because the absolute rates are higher. However, spatial variability effects are harder to measure directly and the cost and effort are greater than with the small plot experiments. In addition, given the spatial variability, it is uncertain if the entire plot is contributing to runoff if only one application intensity is used.
Experiments at both scales do not measure the infiltration rate directly but compute it from the runoff rate. On small plots, generally infiltration rates are computed as the rainfall rate minus the runoff rate. On large plots, an infiltration model is needed to compute the infiltration rate which presents an inverse problem where the runoffhydrograph has to be de-routed in order to compute the rainfall excess rate and then infiltration.
Rainfall Simulator Types
Rainfall simulators are designed to apply a controlled amount and rate of water on a plot. Among the characteristics which are important in the design of simulators are 1. drop size and impact velocities near that of natural rainfall, 2. drop characteristics and intensity uniform over the plot, 3. application on a plot size sufficient to represent the conditions to be evaluated,
4. application rate representative of the storm size of interest, 5. impact angle near vertical, and 6. portability, ease of operation, and cost (Meyer, 1979). The selection of which type of simulator to use is a tradeoff among the factors listed above.
Rainfall simulators can be classified either as drop formers or sprinklers (Mutchler and Hermsmeier, 1965). Drop formers apply a uniform drop size over a small area. Sprinklers apply a distribution of drop sizes over an area limited only by the number of sprinkler heads used. Bubenzer (1979) classified sprinkler simulators as continuous or intermittent application and as stationary, lateral, oscillating, or rotating. Most rangeland infiltration studies on small plots have used either drop formers or stationary sprinkler simulators. For large plot studies, stationary or rotating boom simulators have been predominantly used. A list of some of the simulators and their characteristics are presented in Tables 1 and 2.
T bl 1 D a e rop ormer stmu a or c aractensttcs 1 t h
I
NameI
IntensityI
Plot sizeI
Comments mm/hr m Mobile Infiltrometer 25-152 0.36(Barnes and Costel, 1957)
Double-Tower 25-150 1<
(Rhodes, 1961)
Drop former 1 40% natural kinetic energy
(Meeuwig, 1969)
Mobile Infiltrometer 5-200 1
(Blackburn et al., 1974)
Portable Simulator 28-250 0.36 40% natural kinetic energy
(Malkuti and Gifford, 1978)
Rotating Boom Simulator
Since the 1980's, rotating boom experiments of relatively uniform experimental design have been conducted by the United States Department of Agriculture-Agricultural Research Service (USDA-ARS) at many rangeland sites. These have included the Reynolds Creek Experimental Watershed, ID; Walnut Gulch and Santa Rita Experimental Watersheds, AZ; over 50 rangeland sites as part of the rangeland Water Erosion Prediction Project (WEPP) and the Interagency Rangeland Water Erosion Team (IRWET) field programs; Department ofEnergy sites Los Alamos National Laboratory, NM, Nevada Test Site, NV, and Idaho National
Laboratory, ID; US Forest Service sites in Arizona and California, and several sites in northern Mexico. As such, the rotating boom experiment represents one of the largest rainfall simulator data bases available, much of it in electronic format. The rotating boom nozzle, the VeeJ et 80100, was first used by Meyer and McCuen (1958) on a Purdue simulator. Meyer and Harmon (1979) compared the impact energy, terminal velocity, and raindrop distribution ofthe VeeJet 8070, 80100, and 80150 nozzles with characteristics of natural rainfall. They obtained a good correspondence between the 80100 and 80150 nozzles and natural rainfall energy data from northern Mississippi (McGregor and Mutchler, 1977) and with drop size data taken by Carteret al. (1974) in the south United States for storms of intensities of2-13 and 26-51 mm/hr
respectively.
T bl 2 S "nkl a e ;pn er stmu a or c arac ens tcs lt h t " f
Name Type Intensity Plot Size Comments
mmJhr m
TypeD Continuous 3x4
(Beutner et al., 1940) Stationary
TypeF Continuous 3x4 low intensity
(Kincaid et al., 1964) Stationary
Modified Purdue Continuous 64-115 1 Spraying Systems
(Bertrand and Parr, 1961) Stationary Full Jet 5b, 5d, 7LA
Mobile Infiltrometer Continuous 1
(Rauzi and Smith, 1973) Stationary
Rocky Mountain Continuous 127 variable TypeF
Infiltrometer Stationary
(Dortignac, 1951)
Wilcox Continuous 70-200 1 Spraying Systems
(Wilcox et al., 1988) Stationary Full Jet 1/4G10
USGS Continuous 50 Rainjet 78C
(Lusby, 1977) Stationary
Purdue Oscillating Intermittent 10-140 1 VeeJet 80100,
(Meyer and Harmon, 1979) Oscillating 80150
Rotating Boom Intermittent 60,120, 3 X 10 VeeJet 80100
(Simanton and Renard, Rotating 180
1982; Simanton et al., 1991)
Rainfall Simulator Comparisons
Very little research has been conducted to compare plot response due to the simulator type thus making it difficult to draw other than qualitative conclusions among the various studies. One ofthe first comparisons of simulators was done by Kelly (1940) who compared the Type F, a stationary sprinkler simulator, with an oscillating intermittent Colorado simulator and found that the Type F gave final infiltration rates which were 20-30% lower. Rhodes et al. (1964) compared final intake rates measured using a tower drop former (Rhodes, 1961) with a double ring
infiltrometer and found that the ring infiltrometer gave rates that were 2 to 3 times higher. Aboulabbes et al (1985) found similar results when comparing sprinkler infiltrometers and ring infiltrometers. On croplands, Neibling et al. (1981) found slightly less soil loss and runoffwhen a shorter oscillation time was used on a Purdue type simulator. Ward (1986) compared the Purdue
small area simulator (1 rn2
) with a modified Colorado standpipe sprinkler large area simulator (2000 ft?) and found that both gave similar final infiltration rates at three former ARS watersheds in New Mexico.
Natural runoff events rarely reach steady state so direct comparisons of infiltration rates with those of simulated rainfall are difficult. Kincaid et al. (1964) computed steady state infiltration using the Type F infiltrorneter on 1. 8 x 3. 7 rn2
plots at Walnut Gulch and Kincaid and Williams (1966) measured natural rainfall-runoff on the same plots. Infiltration rates were not computed for the natural events because the steady state assumption was not met. Lusby and Lichty (1983) compared optimized Green-Arnpt Mein-Larson (GAML) infiltration model (Mein and Larson, 1973) saturated hydraulic conductivity obtained from rainfall simulation with those computed from naturally occurring rainfall on Willow Gulch near Denver CO. They found that the conductivity term for the observed data was lower than that obtained from rainfall simulation at two upland ponderosa sites but was about the same for two low land grass sites.
Experimental Designs
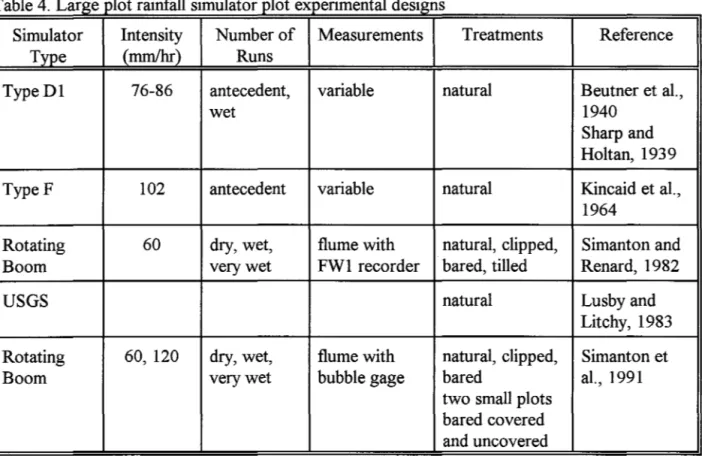
The important factors in a rainfall simulator experimental design are 1. water application characteristics (rate, duration, number of runs), 2. plot size, 3. treatments, and 4. measurements. Tables 3 and 4 list design characteristics of selected small and large plot rangeland experiments.
T a e bl 3 S 11 1 rna Jlot rat a s1rnu ator pJ ot expenrnenta estgns ·m:ll · 1 1 ld .
Simulator Intensity Number of Measurements Treatments Reference
Type (rnrn!hr) Runs
Blackburn 208 pre-wet, 30 minute grazmg McCalla et al.,
drop former wet sample 1984
153 5 minute grab grazmg McGinty et al.,
-do- sample 1978
140 average of 28 canopy Blackburn et
-do- and 3 0 minute interspace al., 1990 samples
Malekuti 64, 127 pre-wet, variable grazmg Devaurs and
wet, very Gifford, 1986
wet
Meyer and 110 pre-wet, 30 minute vegetation Pluhar et al.,
Harmon wet average 1987
Wilcox 103 pre-wet, 5 minute grab vegetation Wilcox et al.,
Table 4 Large plot rainfall simulator plot expenmental designs Simulator Type TypeD1 TypeF Rotating Boom USGS Rotating Boom
Intensity Number of Measurements Treatments
(mmlhr) Runs
76-86 antecedent, variable natural wet 102 60 60, 120 antecedent dry, wet, very wet dry, wet, very wet variable natural
flume with natural, clipped, FW1 recorder bared, tilled
flume with bubble gage
natural
natural, clipped, bared
two small plots bared covered and uncovered
Water application characteristics
Reference Beutner et al., 1940 Sharp and Holtan, 193 9 Kincaid et al., 1964 Simanton and Renard, 1982 Lusby and Litchy, 1983 Simanton et al., 1991
The water application rate for sprinkler simulators typically depends on the nozzle type, operating pressure, number of sprinklers, and the duration of intermittent application. Drop formers generally can vary the application rate through a wide range through the use of flow meters. Sprinklers vary application rate through pressure, number of nozzles, or by intermittent application on the plot. Typical application intensities have varied between 60 - 150 mmJhr although some studies have used higher rates (Blackburn et al., 1980). Some studies have attempted to simulate a specified return period storm. Most of the studies have used a single application rate. However, it has been observed that the apparent infiltration rate increases as the rainfall application rate increases (Cook, 1946; Moldenhauer et al., 1960; Hawkins, 1982; Dunne et al., 1991). The proposed explanation is that as the application rate increases, portions of the plot which have a high infiltration capacity begin to contribute to runoff and thus the apparent infiltration rate becomes greater. This implies that for the typical single application rate of
simulator experiments, only a portion of the plot may be contributing to runoff Sharp and Holtan (1940), Lusby and Litchy (1983), and the WEPP rangeland field experiments (Simanton et al., 1991) used multiple application rates within the same run but did not attempt to quantify the relationship between intensity and infiltration capacity.
60 minutes which has been generally sufficient for the runoff to reach steady state. A few studies were run until the runoff rate was constant.
Most of the experiments have used a simulator run at a single application rate for one hour one day after a pre-data run. The pre-data run is used to obtain uniform moisture on the plot. The WEPP experiments (Simanton et al., 1991) used three runs; a dry run at a single intensity followed 24 hours later by a wet run at a single intensity followed 3 0 minutes later by a very wet run at two intensities.
Plot size
Plot sizes have varied as indicated in Tables 1 and 2. The most common plot sizes have been on the order of a square meter used in many grazing and canopy/interspace studies,
1.8 x 3.7 mused with the Type F infiltrometer, and 3 x 10m used with the WEPP experiments.
Treatments
The majority of small plot experiments used to evaluate grazing management have not treated the plot, but have placed the plot within a treated area of study. Most of the grazing studies have used a control or no grazing treatment and ranges of grazing intensity. The standard WEPP experiment had three treatments on 3x10 m plots, natural, clipped, and bared. The clipped and bared treatments are to isolate the effects of vegetative cover and ground cover respectively on runoff and erosion. Two additional treatments were used on 1x.6 m plots, bared and
bared/covered. The small bared plot and covered bare plot were intended to separate the effects of soil crusting on infiltration in addition to identify the WEPP interrill erosion parameter.
Measurements
As mentioned in the introduction, the infiltration rate is not measured on the plot scale but is computed from the runoff hydro graph either as a steady state infiltration rate or computed from an optimized infiltration equation. Ancillary measurements include initial soil moisture conditions, vegetation and soil surface characteristics, and microtopography. These are used either in
developing regression equations relating final infiltration rates and plot characteristics or in parameter estimation of infiltration and runoff models.
Most ofthe experiments compute the runoff rate by taking a volume ofwater as a grab sample and dividing it by the sample time duration. The sample is taken either at the end of the plot or pumped or gravity fed to a tank. A common sample interval for small plot experiments is every 5 minutes. Beutner et al. (1940) and Kincaid et al. (1964) took grab sample on large plot studies and took more samples during the rise of the hydro graph than during the steady state period. Flumes either coupled with water level recorders or bubble gages have been used on large plot studies by Lusby and Litchy (1983) and by the WEPP rangeland experiment (Simanton et al.,
1991).
Plot characteristics such as soil surface and vegetation properties have been measured primarily to either develop regression relationships between final rates of infiltration and plot
characteristics or to develop parameter estimation equations for infiltration models such as the GAML model (Alberts et al., 1995) for WEPP. Initial soil moisture conditions have been measured generally by gravimetric samples, canopy and surface cover characteristics have been measured by point frames (i.e. Wood et al., 1986), the line intercept method (Gamougoun et al., 1984), and the gridded sampling quadrat method (Blackburn et al., 1980).
Almost all the experiments can be classified as steady state and lumped because 1. the infiltration rate is assumed to be equal to the difference between the application rate and steady state runoff rate and 2. the runoff rate is measured only at the end of the plot. Inherent in all the experiments is the assumption that at steady state, the entire plot is contributing to runoff.
Results
Results of simulator experiments on rangelands have been reported as 1. final rates as influenced by grazing intensity, vegetation characteristics, and chemical or mechanical treatment of vegetation, 2. regression relationships between final rates and vegetation/soil characteristics and 3. parameter estimation of infiltration equations.
Grazing effects
Gifford and Hawkins ( 1978) reviewed the rangeland infiltration literature of studies conducted to examine the impact of grazing on infiltration. Grazing treatments were classified into ungrazed, light, moderate, or heavy grazing, and good, fair, or poor range condition. The initial soil moisture conditions ranged from dry to field capacity. The infiltration rates presented range from averages over the entire run to final rates. Gifford and Hawkins (1978) concluded that there was a significant difference in final infiltration rates between ungrazed and grazed and between heavy and moderate/light grazing but that it was difficult to determine differences between moderate and light grazing. Studies carried out after Gifford and Hawkin's review are consistent their report. Statistically significant differences between final infiltration rates for heavy and light to moderate grazing have been reported on the Texas Experimental Station (McGinty et al., 1978; Blackburn et al., 1980; McCalla et al., 1984; Knight et al., 1984), Fort Stanton, NM (Gamougoun et al., 1984; Weltz and Wood, 1986), Utah (Merzougui and Gifford, 1987; Devaurs and Gifford, 1986) and Arizona (Tramble et al., 1974).
Cover Effects
Grazing intensity and range condition are both qualitative terms so that many studies beginning in the late 1970's began to attempt to quantify the effects of grazing on measurable characteristics such as vegetation and soil surface cover. Positive and negative correlations between final infiltration rate and vegetation and soil characteristics found in the literature are listed in Table 5.
Vegetation: Among the variables listed in Table 5, the effect ofvegetation has been questioned. Weltz and Wood (1986) and Wood et al. (1987) found positive correlations with total above
ground biomass, grass standing crop, and litter accumulation. However, Johnson and Niederhof (1941) and Marston (1952) found no strong relationship between vegetative cover and
infiltration. Smith and Leopold (1942) and Dortignac and Love (1966) found large changes in infiltration with only small changes in vegetation density. Busby and Gifford (1981) found that clipping crested wheatgrass and compacting the soil in southeastern Utah had no significant effects on infiltration. They concluded that because the cover was less than 50% and the clipping did not reflect long term conditions, that there was no impact. They also found no single set of variables which could explain differences in infiltration across all treatments. Johnson and Blackburn (1989) reported an 18% increase in runofffor clipped plots on only the very wet run on sagebrush sites in Utah, while Simanton et al. ( 1991) found that clipping grass canopy cover had no significant effect on final infiltration rate or the runoff/rainfall depth ratio using the WEPP data. Kincaid et al. (1964) found a non-linear relationship between increasing canopy cover and increasing infiltration rates but that below a certain percent cover that there was no relationship on a brush dominated site at Walnut Gulch. Lane et al. ( 1987) found significant positive correlations between final infiltration rates and vegetative and ground cover on large plots in Arizona and Nevada. Bolton et al. (1990) found that on the Jornada Range in New Mexico, vegetation did not affect runoff depth on 4 m2 natural rainfall plots but had a significant effect on
1 m2
rainfall simulator plots. Dunne et al. ( 1991) examined the vegetative cover effects on final infiltration rates in Kenya using a sprinkler rainfall simulator. They found little influence of vegetative cover postulating that the root system had more of an influence on infiltration rates. They also found a relationship between application rate and apparent final infiltration rate that was independent of the percent vegetative cover.
Table 5. C orre at10ns 1 . b etween fi na 1 1 "nfil trat10n rate an d vegetatiOn an d sm c aractenst1cs "1 h
I
PositiveI
NegativeI
Canopy cover Clay
Live biomass Gravel cover
Litter cover Rock cover
Basal cover Bulk density
Soil organic carbon Surface horizon structure
Roughness coefficient Bare ground
Porosity
Number of depressions Total ground cover
Canopy Interspace: On many rangelands, there are discrete areas of shrubs or trees and
interspaces without vegetation. Blackburn et al. (1975) found a significant difference between 30 minute infiltration rates for the coppice dune and the interspace areas. Infiltration rates were positively correlated with the extent and surface morphology of dune interspace areas and negatively correlated with vesicular horizons. The negative correlation with bare ground
compared with results ofDuley and Domingo (1949) and Branson and Owen (1970). The
positive correlation of plant and litter cover was not as strong as reported by Dortignac and Love (1966), Rauzi et al. (1968), and Meeuwig (1969). Balliette et al. (1986) found that average final infiltration rates were greater under sagebrush canopy than in the interspace areas. Rostagno (1989) found that eroded shrub interspace areas had lower infiltration rates than non-eroded in northeastern Patagonia, Argentina. Blackburn et al. (1990) studied the temporal and spatial variation of infiltration under and outside of sagebrush canopy from February to May at Reynolds Creek. Interspace rates were significantly lower than the canopy areas and the February-March rates were significantly lower that the remainder of the simulations. Tromble (1980) studied the effects ofrootplowing creosote dominated rangeland on the Jornada Experimental Range in New Mexico and found that final infiltration rates were greater on creosote plots than the plowed plots. Johnson and Gordon (1984) found that the interspace area produced 2.5 times the runoff as the under sagebrush canopy area.
Rock Effects: Poesen et al. (1990) contrasted the results of authors who reported positive (Tromble et al. 1974, Blackburn et al. 1975) with those who reported negative (Kincaid et al.,
1966; and Tromble, 1976) effects of rock fragments on the soil surface with the amount of runoff volume on small rainfall simulator plots. They postulated that imbedded rock fragments increase runoff while if they lay on the soil surface they decrease runoff volume.
Rangeland Treatments: Brocket al. (1982) examined the effects of herbicides and rootplowing for brush control on infiltration in north central Texas. They found that regardless of treatment, final infiltration rates were higher within the canopy than within the interspace areas but that there was no significant difference between the control and the treatments. Bedunah and Sosebee (1985) found that the vibratill and shred treatments significantly increased the infiltration rate while all other brush control treatments were not significantly different from the control. Contrary to studies by Knight et al. (1984) and Brocket al. (1982), they found no difference between the infiltration rates under and outside mesquite canopies. Wood et al. (1986) found that final infiltration rates on fertilized and unfertilized pasture were different than the control. Knight et al. (1986) studied oak mottes on the Edwards Plateau in Texas and found that 30 minute infiltration rates were higher for undisturbed conditions than for areas where mulch and organic layers were removed.
Infiltration Parameters
Small Plot Experiments
Sabol et al. (1982) used the modified Purdue simulator to develop runoff ratios, Curve Numbers, and GAML parameters for 10 sites, developed and undeveloped, in the Albuquerque area. They used a least squares procedure to obtain the conductivity and capillary terms of the GAML model and obtained values which were in the same range as Rawls et al. (1982).
Devaurs and Gifford (1986) used a modular drop forming device on .37m2
plots located within 3 m x 10.5 m plot which were used with the rotating boom rainfall simulator on Reynolds
Creek. The treatments were grazed, ungrazed, and tilled. They compared GAML parameters obtained by a least squares fitting of the data to those computed from soil texture (McCuen et al., 1981). The data were fitted by plotting the infiltration rate versus the reciprocal ofthe cumulative infiltration depth so that the intercept is the GAML conductivity term and the slope is the
hydraulic conductivity times the effective matric potential. This method gave negative values of the GAML parameters for some cases. The texture derived parameter values worked best for the tilled rangeland soils but did poorly for the control plots. Hutten and Gifford (1988) compared the observed infiltration rates with those predicted from soil characteristics (McCuen et al., 1981) and found that the observed rates were much higher than the soil predicted rates on native
rangeland and plowed sites.
Large Plot experiments
Large plot experiments differ not only in the plot size but also in the information which can be obtained from the experiment. Because of the size, processes which may be negligible on a smaller scale may become significant on the larger scale. Sharp and Holtan (1940) stated
... only during those portions of the hydrograph when runoff is constant, and after satisfaction of depression- and surface-storage, can infiltration rates be determined directly, and with any degree of accuracy. During any period of the hydrograph when the rate of runoff is changing, three other factors, rate of infiltration, and amounts of depression- and surface-storage may or may not be changing also.
The point is that the only data available from large plots are runoffhydrographs so that to identify time varying infiltration rates or model the process, the entire hydrograph has to be analyzed. The Sharp and Holtan statement is true for small plots, but because of the small absolute amounts of runoff, it is harder to accurately define the rise and recession of the hydro graph.
Some of the first and still most complete analyses of the runoff hydro graph were performed in the late 1930's. Sharp and Holtan (1940) analyzed hydrographs for detention storage and depression storage from rainfall simulator experiments on the Concho River
Watershed, TX. A graphical method was used to compute detention storage from the recession of the hydro graph and depression storage as the residual of the plot water balance at steady state. Beutner et al. (1940) computed Horton infiltration (Horton, 1939) parameters, stage-discharge relationships, and roughness coefficients similar to Manning's n for 14 sites in Arizona.
Lusby and Litchy (1983) used trial and error to fit GAML and the kinematic wave model Manning's n using simulated and natural rainfall plot data and natural rainfall watershed data in Colorado with inconsistent results. Kuczera and Patterson (1993) used a stationary rainfall simulator on 2 by 8 m plots to fit parameters for a coupled Horton-kinematic wave model. The wet run was used to fit Manning's n, the final infiltration parameter of the Horton equation, and depression storage. The dry run was used to fit the remainder of the Horton equation parameters. They obtained good fits of the hydro graph but were uncertain what the results meant in regards to the kinematic wave model.
Alberts et al. (1995) used the WEPP and IRWET rangeland data to develop optimized GAML conductivity terms and estimation procedures based on vegetation and soil characteristics.
The methodology used the WEPP model to estimate the matric term, adjusted that term with the site soil porosity and initial soil water conditions, and adjusted the conductivity until the simulated runoff volume matched the observed volume for the wet run. Multiple regression analysis was then used with the fitted conductivity terms to develop equations which predicted conductivity as a function of vegetation and soil properties.
Roughness coefficient
The roughness coefficient, expressed as Manning's n or Chezy C, has been used with the kinematic wave model to route rainfall excess. Two approaches which have been used to evaluate the roughness coefficient using rainfall simulator data are to directly measure the local flow depth or velocity on the plot and to use the hydro graph at the outlet of the plot with the kinematic wave model. Studies which have used the first approach are Emmett (1970) and Abrahams et al. (1986) who measured flow depths at regular intervals downslope on large plots (9 to 14.4 m) on natural rangeland hillslopes. Engman (1986) used the second approach which consisted of a method that minimized the difference squared between the observed and predicted hydrograph as computed by a finite difference solution of the kinematic wave model. However, Woolhiser (1975) suggested that, because the flow depth is so small on rangelands, the roughness coefficient be computed using the recession portion of the hydro graph with the equation for kinematic storage on the flow surface at steady state.
The majority of studies on rangelands have related optimized values of the roughness coefficient (generally Manning's n) to qualitative descriptions ofvegetation (Emmett, 1970; Woolhiser, 1975), vegetative or surface condition (Ree et al., 1977; Abrahams et al., 1986), or
simply as a broad class termed "range" (Engman, 1986). The most comprehensive list of Manning's nand Chezy C values for rangelands was compiled by Weltz et al. (1991) who used Engman's hydro graph fitting method to identify Darcy-Weisbach friction factors for natural, clipped, and bared WEPP rangeland rainfall simulator plots. They estimated the total friction factor as a summation of friction sub-factors associated with grain roughness, random roughness, ground surface cover, and canopy cover.
Summary
The vast majority of studies have reported final infiltration rates on small plots as affected by either grazing intensity or vegetation and soil surface characteristics. Most of the studies are consistent with each other on a qualitative basis. That is, interspace areas have lower infiltration rates than under canopy areas and infiltration rates under high intensity grazing are lower than under low intensity grazing. Ascribing reasons for these differences is more problematic and the studies are less consistent. For example, although many studies have found positive correlations between final rates and increasing vegetation and litter cover, some have not.
Parameterization of infiltration models, primarily the GAML model, has also been less than successful. The reasons for the lack of success are probably because none of the experiments were expressly designed to measure the GAML parameters and could be an indication that
Considerations for Future Research
1. Rainfall characteristics in the Western U.S.: In much of the western U.S., rainfall intensity is the controlling factor in the initiation and rates of runoff However, the relationship between important natural rainfall characteristics (kinetic energy, drop size distribution) occurring in the western US and rainfall simulator characteristics has not been extensively studied. For example, Tracy et al. (1984) found that thunderstorm rainfall in southeastern Arizona had a higher kinetic energy as measured using a distrometer than the rainfall energies found by Carteret al. (1974) and McGregor and Mutchler (1977) in other parts of the country. 2. Correspondence between natural and simulated plot response: There have been very few
studies relating infiltration rates or parameter estimates obtained from simulation to those obtained from natural rainfall. Several plots used for the USLE experiments at Walnut Gulch were monitored for natural rainfall (Simanton et al., 1984) for a year but were discontinued because of equipment problems. Results indicated that both runoff and sediment yield were greater for the natural events than for the rainfall simulation events. There is a potential for some comparisons with existing watershed data. Both the rangeland USLE and WEPP experiments were done at the Walnut Gulch and Reynolds Creek Experimental Watersheds. The WEPP experiment also had plots at watersheds R5 and R 7 at Chikasha, OK,
Cottonwood, SD, and Los Alamos National Laboratories.
3. Correspondence among simulators at point, small plot, and large plot: Point measurements, such as ring infiltrometers and disk permeameters, are popular methods of characterizing infiltration because they are easy to use, quick, and economical. Studies have shown that these methods yield higher infiltration rates than plot scale measurements using rainfall
simulators. If point measurements and small and large plot simulators are going to be used in the future, there is a need to relate infiltration rates and parameter values obtained at the three scales.
4. Partial area response: At both the small and large plot scale, partial area response can be a significant process controlling the rates and amounts of infiltration. Because most
experiments are run at a single intensity and the runoff is computed assuming the entire plot area is contributing, extending results to natural rainfall is difficult. Experiments must be designed to take into account the observed increase in apparent infiltration rate with increasing application rate.
5. Interior plot measurements: Spatial variability of infiltration includes the runon-runoff process, that is areas which have runoff flowing onto areas where the infiltration capacity is greater than the rainfall intensity. Quantification of this process will involve routing models which can account for dynamic infiltration and rainfall excess routing. In order to validate these models, runoff measurements must be taken not only at the end of the plot but also within the plot. If point measurements are made within the plot, then as stated in point 3
above, a correspondence must be made between point and plot scale measurements of infiltration.
6. Examine all components of the hydrograph: The only data available at the plot scale is the hydrograph. Progress in infiltration research is dependent on being able to define the change in depression and surface storage with time as well as being able to compute runoff
References
Aboulabbes, 0., D.J. Kotansky, and R.H. Hawkins. 1985. Interrelating infiltration measurements. In Symposium on
Watershed Management in the Eighties. ASCE. Denver, CO.
Abrahams, A.D., A.J. Parsons, and S.H. Luk. 1986. Resistance to overland flow on desert hillslopes. Journal of Hydrology. 88(3/4):342-363.
Alberts, E.E., M.A. Nearing, M.A. Weltz, L.M. Risse, F.B. Pierson, X. C. Zhang, J.M. Laflen, and J.R. Simanton. 1995. Ch. 7. Soil Component. In Technical Documentation. USDA-Water Erosion Prediction Project (WEPP). NSERL ReportNo. 10. WestLafayette,IN. pp7.28-7.34.
Balliette, J.F., K.C. McDaniel, and M.K. Wood. 1986. Infiltration and sediment production following chemical control of sagebrush in New Mexico. J. Range Management. 39(2): 160-165.
Barnes, O.K. and G. Costel. 1957. A mobile infiltromer. Agron. Journal. 49(2): 105-107.
Bedunah, D.J. and R.E. Sosebee. 1985. Influence of site manipulation on infiltration rates of a depleted west Texas range site. J. Range Management. 38(3):200-205.
Bertrand, A.R. and J.F. Parr. 1961. Design and operation of the Purdue sprinkling infiltrometer. Purdue Univ. Res. Bull. No 723. Lafayette, IN.
Beutner, E.L., R.R. Gaebe, and R.E. Horton. 1940. Sprinkled-plat runoff- and infiltration-experiments on Arizona desert soil. Trans. AGU. pp. 550-558.
Blackburn, W.H, R.O. Meeuwig, and C.M. Skau. 1974. A mobile infiltrometerforuse on rangelands. J. Range Management. 27:322-323.
Blackburn, W.H., R.E. Eckert, Jr., M.K. Wood, and F.F. Peterson. 1975. Influence of vesicular horizons on watershed
management. In Proceedings of Watershed Management, A Symposium. Irrigation and Drainage Division. ASCE.
Logan UT.
Blackburn, W.H., R.W. Knight, M.K. Wood, and L.B. Merril. 1980. Watershed parameters as influenced by grazing. Symposium on Watershed Management '80. ASCE. Boise ID. pp. 552-572.
Blackburn, W.H., F.B. Pierson, and M.S. Seyfried. 1990. Spatial and temporal influence of soil frost on infiltration and erosion of sagebrush rangelands. Water Resources Bulletin. 26( 6):991-997.
Bolton, S., T.J. Ward, and W.G. Whitford. 1990. Rainfall infiltration and loss on a bajada in the Chihuahuan desert, New Mexico. Hydraulics/Hydrology of Arid Lands. ASCE International Symposium. San Diego CA.
Branson, F.A. and J.B.Owen. 1970. Plant cover, runoff, and sediment yield relationships on Mancos Shale in western Colorado. Water Resources Research. 6:783-790.
Brock, J.H., W.H. Blackburn, and R.H. Haas. 1982. Infiltration and sediment production on a deep hardland range site in north central Texas. J. Range Management. 35(2): 195-198.
Bubenzer, G.D. 1979. Inventory of rainfall simulators. In Proceedings of the Rainfall Simulator Workshop. Tucson,
AZ. ARM-W-10:120-130.
Busby, F .E. and G.F. Gifford. 1981. Effects of livestock grazing on infiltration and erosion rates measured on chained and unchained pinyon-juniper sites in southeastern Utah. J. Range Management. 34:400-405
Carter, C.E., J.D. Greer, H.J. Braud, and J.M. Floyd. 1974. Raindrop characteristics in south central United States. Trans. ASAE 17(6):1033-1037.
Cook, H.L. 1946. The infiltration approach to the calculation of surface runoff. EOS Transactions AGU. 27:726-7 4 7. Devaurs, M. and G.F. Gifford. 1984. Variability of infiltration within large runoff plots on rangelands. J. Range Management. 37(6):523-528.
Devaurs, M. and G.F. Gifford. 1986. Applicability of the Green and Ampt infiltration equation to rangelands. Water Resources Bulletin 22(1): 19-26.
Dortignac, E.J. 1951. Design and operation of Rocky Mountain Infiltrometer. Station Paper No. 5. USDA-FS. Rocky Mountain Forest Experiment Station, Ft. Collins CO
Dortignac, E.J. and L.D.Love. 1966. Infiltration studies on Ponderosa pine ranges of Colorado. US Forest Service Rock Mt. Forest Range Experiment Station Paper 59:1-34.
Duley, F.L. and C.E. Domingo. 1949. Effect of grass on intake of water. Nebraska Agricultural Experiment Station ResearchBull. 159:1-15.
Dunne, T., W. Zhang, and B.F. Aubry. 1991. Effects of rainfall, vegetation, and microtopography on infiltration and runoff. WaterResourcesResearch. 27(9):2271-2285.
Emmett, W.W. 1970. The hydraulics of overland flow on hillslopes. USGS Professional Paper 662-A. U.S. Government Printing Office, Washington, D.C. 68pp.
Engman, E. T. 1986. Roughness coefficients for routing surface runoff. ASCE Journal of Irrigation and Drainage. 112(1):39-53.
Gamougoun, N.D., R.P. Smith, M.K. Wood, and RD. Pieper. 1984. Soil, vegetation, and hydrologic responses to grazing management at Fort Stanton, New Mexico. J. Range Management. 37(6):538-541.
Gifford, G.F. and R.H. Hawkins. 1978. Hydrologic impacts of grazing on infiltration: a critical review. Water Resources Research 14(2):305-313.
Hawkins, R.H. 1982. Interpretations of source area variability in rainfall-runoff relations. In Rainfall-Runoff
Relationship. Proceedings of the International Symposium on Rainfall-RunoffModeling. Mississippi State Univ. Ms. p303-324.
Horton, R.E. 1939. Analysis of runoff-plat experiments with varying infiltration capacity. Trans. American Geophysical Union. pp 693-711.
Rutten, N.C. and G.F. Gifford. 1988. Using the Green and Ampt infiltration equation on native and plowed rangeland soils. J. Range Management 41(2):159-162.
Johnson, C.W. and N.D. Gordon. 1988. Runoff and erosion from rainfall simulator plots on sagebrush rangeland. Trans. ASAE 31(2): 421-427.
Johnson, C.W. and W.H. Blackburn. 1989. Factors contributing to sagebrush rangeland soil loss. Trans. ASAE. 32:155-160.
Johnson, W.M, and C.H. Niederhof. 1941. Some relationships of plant cover to runoff, erosion, and infiltration on granitic soils. J. For. 39. 854-858.
Kelly, L.L. 1940. A comparison of the Colorado and Type-F artificial rainfall applicators. Office of Research. USDA-SCS. Washington, D.C. 27p.
Kincaid, D.R., J.L. Gardner, and H.A. Schreiber. 1964. Soil and vegetation parameters affecting infiltration under semi-arid conditions. lASH Publ. 65. 440-453.
Kincaid, D.R. and G. Williams. 1966. Rainfall effects on soil surface characteristics following range improvement treatments. J. Range Management. 19(6):346-351.
Knight, R.W., W.H. Blackburn, and L.B. Merrill. 1984. Characteristics of Oak Mattes, Edwards Plateau, Texas. J.
Range Management. 37(6):534-537.
Kuczera, G. and E. Patterson. 1993. Estimation of infiltration and overland flow parameters using a portable sprinkler infiltrometer. Hydrology and Water Resources Symposium. Newcastle, AUS.
Lane, L.J., J.R. Simanton, T .E. Hakanson, and E.M. Romney. 1987. Large-plot infiltration studies in desert and semiarid rangeland areas of the southwestern U.S.A. Proceedings on the International Conference on Infiltration Developments and Applications. Univeristy of Hawaii.
Lusby, G. C. 1977. Determination of runoff and sediment by rainfall simulation. In Erosion research techniques, erodibility and sediment delivery. Geo. Abstracts Ltd. Norwich England.
Lusby, G. C. and R. W. Lichty. 1983. Use of rainfall simulator data in precipitation runoff modeling studies. U.S. G. S. Water Resources Investigation Report 83-4159.
Malekuti, A. and G.F. Gifford. 1978. Natural vegetation as a source of diffuse salt within the Colorado River Basin. Water Resources Bulletin. 14: 19 5-20 5.
Marston, R.B. 1952. Ground cover requirements for summer storm runoff control on aspen sites in Northern Utah. J. For. 50:303-307.
McCalla II, G.R., W.H. Blackburn, and L.B. Merril. 1984. Effects of livestock grazing on infiltration rates, Edwards PlateauofTexas. J. Range Management. 37(3):265-269.
McCuen, R.H., W.J. Rawls, and D.L. Brakensiek. 1981. Statistical analysis of the Brooks-Corey and Green-Ampt parameters across soil textures. Water Resources Research. 17 ( 4 ): 1005-1013.
McGinty, W.H., F.E. Smeins, andL.B. Merrill. 1978. Influence of soil, vegetation and grazing management on infiltration rate and sediment production of Edwards Plateau rangeland. J. Range Management. 32:33-37.
McGregor, K. G. and C.K. Mutchler. 1977. Status of the R-factor in northern Mississippi. Proceedings of the 197 6 National Conference on Soil Erosion. W. Lafayette, IN. SCSA Specl. Publ. No. 21:135-142.
Meeuwig, R.O. 1969. Infiltration and soil erosion as influenced by vegetation and soil in northern Utah. J. Range Management 23(3):185-188.
Mein, R. G. and C.L. Larson. 1973. Modeling infiltration during a steady rain. Water Resources Research 9(2):384-394.
Meyer, L.D. and D.L. McCune. 1958. Rainfall simulator for runoff plots. Agricultural Engineering. 39(10):644-648. Meyer, L.D. 1979. Methods for attaining rainfall characteristics in rainfall simulators. In Proceedings of the Rainfall Simulator Workshop. ARM-W-10. pp35-44
Meyer, L.D. and W.C. Harmon. 1979. Multiple intensity rainfall simulator for erosion research on row side slopes. Trans. ASAE. 22:100-103.
Moldenhauer, W. C., W. C. Barrows, and D. Swartzendruber. 1960. Influence of rainstorm characteristics on infiltration measurements. Transactions of the International Congress of Soil Science. 7:426-432.
Mutchler, C.K. andL.F. Hermsmeier. 1965. A review of rainfall simulators. Trans. ASAE. 8(1):67-68.
Neibling, W.H., G.R. Foster, R.A. Natterman, J.D. Nowlin, and P.V. Hobert. 1981. Laboratory and field testing of a programmable plot-sized rainfall simulator. Erosion and Sediment Transport Measurement. lAHS Pub. no 133. pp 405-414.
Pluhar, J.J., R. W. Knight, and R.K. Heitschmidt. 1987. Infiltration rates and sediment production as influenced by grazing systems in the Texas rolling plains. J. Range Management. 40(3):240-243.
Poesen, J., F. Ingelmo-Sanchez, and H. Mucher. 1990. The hydrological response of soil surfaces to rainfall as affected by cover and position of rock fragments in the top layer. Earth Surface Processes and Landforms. 15:653-671.
Rauzi, F.C., C.L. Fly, and E.J. Dyksterhuis. 1968. Water intake on mid continental rangelands as influenced by soil and plant cover. USDA Tech Bull. 1390:1-58.
Rauzi, F. C. and F .M. Smith. 1973. Infiltration rates: three soils with three grazing levels in Northeastern Colorado. J. Range Management 26(2):126-129.
Rawls, W.J., D.L. Brakensiek, and K.E. Saxton. 1982. Estimation of soil water properties. Transactions of the ASAE Special Edition, Soil and Water. (25):1316-1320.
Ree, W.O., F.L. Wimberley, and F.R. Crow. 1977. Manning's nand the overland flow equation. Transactions of the ASAE. 20(1):89-95.
Rhoades, E. D. 1961. A mobile double-tower sprinkling infiltrometer. J. Soil and Water Conservation. 16( 4): 181-182. Rhodes, E.D., L.F. Locke, H.M. Taylor, and E.H. Mcilvain. 1964. Water intake on a sandy range as affected by 20 years of differential cattle stocking rates. J. Range Management. 17 ( 4): 185-190.
Rostagno, C.M. 1989. Infiltration and sediment production as affected by soil surface conditions in a shrub land of Patagonia, Argentina. J. Range Management 42(5):382-385.
Sabol, G.V., T.J. Ward, and A.D. Seiger. 1982. Phase II- Rainfall infiltration of selected sites in the Albuquerque drainage area. Research Report submitted to Albuquerque Metropolitan Arroyo Flow Control Authority (AMAFCA) and City of Albuquerque. 90 p.
Sharp, A.L. and H.N. Holtan. 1940. A graphical method of analysis of spinkled plot hydro graphs. Trans. AGU 21 :558-570.
Simanton, J.R. and K. G. Renard. 1982. Seasonal change in infiltration and erosion from USLE plots in southeastern
Arizona. Hydrology and Water Resources in Arizona and the Southwest. Office of Arid Land Studies, Univ. of Arizona, Tucson. 12:37-46.
Simanton, J.R., L.J. Lane, and J.J. Stone. 1984. Plot runoff and sediment from simulated and natural rainfall.
Proceedings of the Specialty Conference Water Today and Tomorrow. ASCE Irrigation and Drainage. Flagstaff, AZ. Simanton, J.R., M.A. Weltz, and H.D. Larsen. 1991. Rangeland experiments to parameterize the water erosion prediction project model: vegetation canopy cover effects. J. Range Management. 44(3):276-282.
Smith, H.L. and L.B. Leopold. 1942. Infiltration studies in the Pecos River Watershed, New Mexico. Soil Sci. 53: 195-204.
Tracy, F.C., K.G. Renard, and M.M. Fogel. 1984. Rainfall energy characteristics for southeastern Arizona. Proceedings of the Specialty Conference. Irrigation and Drainage. ASCE. Flagstaff AZ. July 24-26.
Tromble, J.M, K. G. Renard, and A.P. Thatcher. 197 4. Infiltration for three rangeland soil-vegetation complexes. J. Range Management. 27(4):318-321.
T romble, J.M. 97 6. Semiarid rangeland treatment and surface runoff. J. Range Management. 29(3) :251-25 5. Tromble, J.M. 1980. Infiltration rates on rootplowed rangeland. J. Range Management. 33(6):423-425.
Ward, T.J. 1986. A study of runoff and erosion processes using large and small area rainfall simulators. Technical Completion Report. Project No. 1423672. New Mexico WaterResourcesResearchinstitute. 7lp.
Weltz, M.A. and M.K. Wood. 1986. Short duration grazing in central New Mexico: effects on infiltration rates. J. Range Management 39(4):365-368.
Weltz, M.A., A.A. Arslan, and L.J. Lane. 1991. Hydraulic roughness coefficients for native rangelands. ASCE Journal of Irrigation and Drainage. 118(5):776-790.
Wilcox, B.P., M.K. Wood, and J.M. Tromble. 1988. Factors influencing infiltrabililty of semiarid mountain slopes. J. Range Management. 41:197-206.
Wood, M.K., G.B. Donart, and M.A. Weltz. 1986. Comparative infiltration rates and sediment production on fertilized and grazed blue grama rangeland. J. Range Management 39(4):371-374.
Wood, J.C., M.K. Wood, and J.M. Tromble. 1987. Important factors influencing water infiltration and sediment production on arid lands in New Mexico. Journal of Arid Environments 12:111-118.
Woolhiser, D.A. 1975. Chapter 12: Simulation of unsteady overland flow. In: Mahmood, K. and V. Yevjevich, Ed.
Predicting WEPP Effective Hydraulic Conductivity Values on Rangelands
Fred Pierson\ Ken Spaeth2, Mark Weltz3, Steven Van Vactor\ and Mary Kidwell3
Abstract
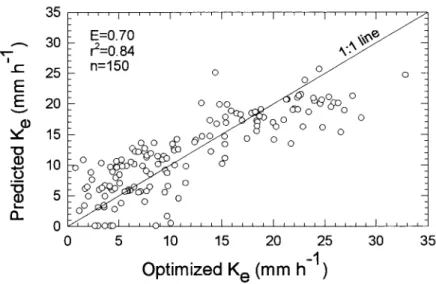
The Agricultural Research Service (ARS) and the Natural Resource Conservation Service (NRCS) cooperatively conducted rainfall simulation experiments at 26 sites in 10 western states for a total of 444 plot-runs. The data was combined with other similar rainfall simulation data from an additional21 sites collected as part ofthe original ARS Water Erosion Prediction Project (WEPP) to create a database containing a total of 820 plot-runs. Subsets of this database were then used to estimate WEPP Green-Ampt effective hydraulic conductivity values for rangelands. This paper provides site-specific summaries of the soil, vegetation and hydrology data collected from all sites and presents regression equations for estimating time-invariant WEPP effective hydraulic conductivity values on rangelands.
Introduction
In 1990, the Agricultural Research Service (ARS) and the Natural Resource Conservation Service (NRCS) entered into a cooperative effort to specifically address the development of the Water Erosion Prediction Project (WEPP) model for use on rangelands. As a result of this cooperation, the National Range Study Team (NRST) and Interagency Rangeland Water Erosion Team (IRWET) were created. The NRST conducted rainfall simulation experiments at 26 sites in 10 western states for a total of 444 plot-runs. IRWET combined the NRST data with other similar rangeland rainfall simulation data from an additional 21 sites collected by the WEPP T earn to create a database containing a total of 820 plot-runs. Subsets of this database were then used to develop, calibrate, and validate rangeland specific components of the WEPP model. This paper outlines the database and methodology IRWET used to estimate WEPP Green-Ampt effective hydraulic conductivity values for rangelands.
Rainfall Simulation Experiments
Rainfall Characteristics
A rotating boom simulator (Swanson, 1965; Swanson, 1979; Simanton et al., 1987, 1990) was used at all locations. It is trailer-mounted and has ten 7.6 m booms radiating from a central stem. The 30 nozzles on each boom spray continuously downward from an average height of3 m. The boom movement is circular over the plots and applies rainfall intensities of approximately
1
USDA-ARS, NWRC, 800 Park Blvd, Plaza 4, Suite 105, Boise, ID 83712 2
USDA-NRCS, NWRC, 800 Park Blvd, Plaza 4, Suite 105, Boise, ID 83712
65 or 130 mm/hr with drop size distributions similar to natural rainfall. Simulation was done at 65 mm/hr on each plot for 60 minutes or until steady state runoff was achieved for a 'dry run'
(initially dry), for 30 minutes or until steady state runoff occurred for the 'wet run' (initially at field capacity i.e. 24 hours after the 'dry run'), and finally 130 mm/hr of rainfall was applied until steady state runoff was achieved for the 'very wet run' (i.e. 30 minutes after the 'wet run').
Runoff Plots
Rainfall was simulated uniformly over three pairs of3.05 by 10.67 m plots. Distribution of rainfall within each plot was determined by both non-recording and recording rain gauges. Runoff was determined by using pressure transducer bubble gauges calibrated to the flume positioned at the plot headwall (Simanton et al., 1987, 1990). Runoff samples were collected on timed intervals to measure sediment concentration and estimate total sediment yield. For the WEPP data, six plots were sampled at each site where paired plot treatments consisted of natural, clipped (vegetative material was clipped to a 20 mm height) and bare soil (all soil cover removed) treatments. Data from the natural plots were used to develop erosion, runoff, and infiltration relationships whereas data from the clipped plots were used to separate canopy cover effects on runoff and erosion. For the NRST data, all six plots sampled were undisturbed replicates of native vegetation where soil characteristics and slope were nearly constant.
Site Characteristics
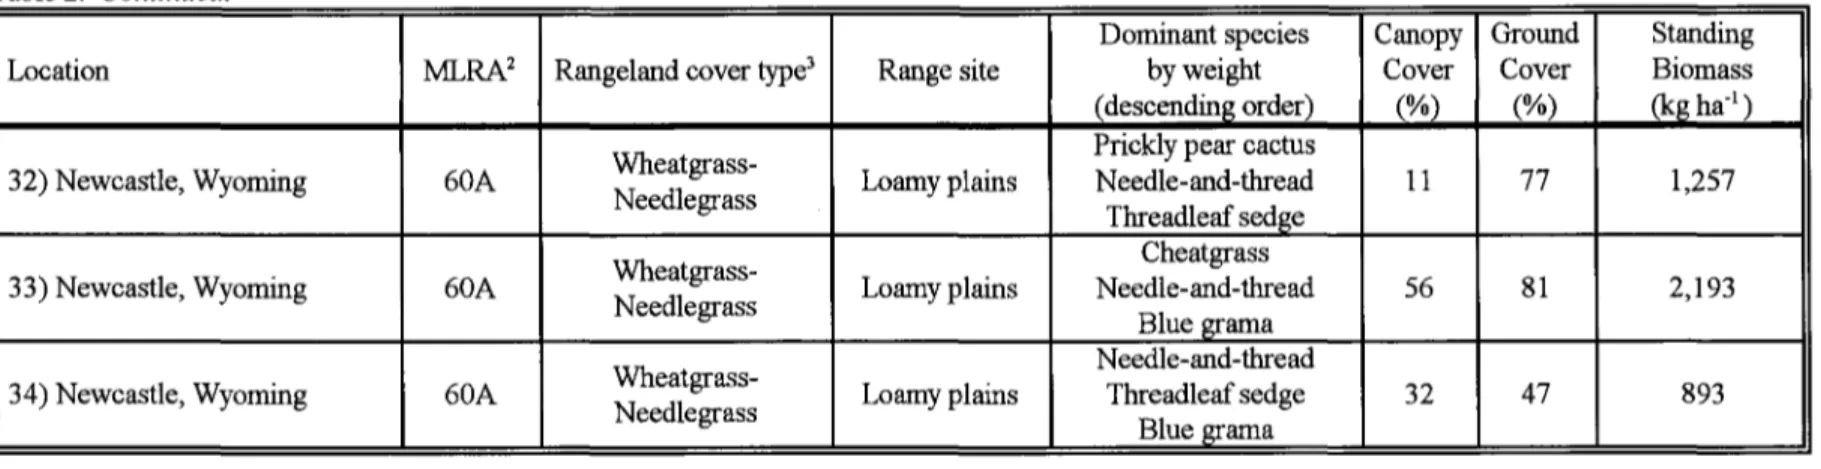
Thirty-four of the 47 locations sampled were used in this analysis (sites and plots were removed from analysis due to missing data or runoff equilibrium problems). All sites were representative of common rangeland soils and plant cover types that contribute to variation in rangeland hydrology. Thirty unique combinations of rangeland cover type, range site, soil family, and soil surface texture were represented (Tables 1 and 2).
Soil Properties
Twenty-two pedons around each study site were examined, five representative pedons were selected and described, and a detailed profile description and characterization was done on one representative pedon. Soil descriptions and characterizations were performed by NRCS personnel and the NRCS National Soil Survey and Soil Mechanics Laboratories in Lincoln, Nebraska. Antecedent soil moisture condition of each plot and bulk density were determined using open-ended core and compliant cavity methods, respectively. Selected soil properties for each study site are shown in Table 1.
Vegetation Characteristics
Canopy and ground cover were determined by point-sampling (Mueller-Dombois and Ellenberg, 1974). The point center quarter method (Dix 1961) was used to determine plant parameters such as height, canopy cover, geometric shape, density, and mean distance of shrub,
bunchgrass, sod, and annual grasses. Estimates of standing biomass of current year's growth by species and previous year's growth plus decumbent litter were collected utilizing SCS double sampling techniques (SCS, 1976) and by clipping and separating all biomass within five sub-plots located in each runoff plot. Biomass was determined by oven-drying and weighing each sample. Plant composition was determined by the weight method (SCS, 1976). A general description of vegetation characteristics for each site is given in Table 2.