Isolation and Characterization of
Mesenchymal Stem Cells from the
Periodontal Ligament of Healthy Teeth
Sara Lagerholm
Supervisor: Andreas Stavropoulos
Master’s Thesis in Odontology (30 ECTS)
Malmö University
Program of Dentistry
Faculty of Odontology
February, 2019
205 06 Malmö
Isolering och karaktärisering
av mesenkymala stamceller
från periodontalligamentet hos
friska tänder
Sara Lagerholm
Handledare: Andreas Stavropoulos
Examensarbete (30 hp)
Malmö Universitet
Tandläkarprogrammet
Odontologiska fakulteten
februari, 2019
205 06 Malmö
TABLE OF CONTENTS
Abstract……….………...1-2 Introduction………...3-6 Materials and Methods………...6-9 Results ………...10-21 Discussion………...21-26 Conclusion……..………....26 Ethical considerations………...27 Acknowledgement ………..………...27 References. ………...28-29
1
ABSTRACT:
Isolation and Characterization of Mesenchymal Stem Cells from the Periodontal Ligament of Healthy Teeth
AIM: To isolate and culture viable cells from the periodontal ligament and confirming their
identity as mesenchymal stem cells.
METHODS AND MATERIALS: Healthy premolars were collected at the time of
orthodontic extractions. The middle 1/3 of the periodontal ligament was scraped and subsequent cell isolation was performed using an enzymatic method; yielding single cell isolates. Cells were cultured and maintained under standard culture conditions. Cell characterization was performed by flow cytometry using two sets of cell surface markers; one known to be present and one known to be absent in mesenchymal stem cells. Ability of the cells for in vitro differentiation into adipogenic and osteogenic lineages was tested using specifically formulated media supplements.
RESULTS: Cells were successfully isolated from 11 of 13 teeth and were maintained as
adherent cultures for up to 8 generations. Cellular expression of positive markers; CD73, CD90 and CD44 were confirmed by flow cytometry. For the negative marker panel, expression of CD45, CD34, CD11b, CD19 and HLA class II were not detectable. The expression of CD105 was inconclusive. As determined by phenotypic changes, cells appeared to have undergone adipogenic and osteocytic differentiation at 21 days.
CONCLUSION: This study has resulted in successful isolation and partial characterization of
mesenchymal stem cells from the periodontal ligament of healthy teeth. Non-invasive access to these cells, provides an excellent tool for future studies, potentially leading to beneficial knowledge transferable to the dental clinical situation.
2
ABSTRAKT:
Isolering och karaktärisering av mesenkymala stamceller från periodontalligamentet hos friska tänder
SYFTE: Att isolera och odla celler från periodontalligamentet samt karaktärisera dem som
mesenkymala stamceller.
MATERIAL OCH METOD: Friska premolarer gjordes tillgängliga vid ortodontiska
extraktioner. Den mellersta 1/3 av periodontalligamentet skrapades varpå en enzymatisk metod användes för isolering av individuella celler. Resulterande celler odlades under standardiserade metoder. Karaktärisering av celler skedde genom flödescymetri med 2 olika paneler av cellyta markörer; en för etablerat positiva uttryck och en för kända negativa uttryck hos mesenkymala stamceller. Möjlighet av celler att differentieras in vitro till
adipocyter och osteocyter testades genom tillförsel av specifika substanser till odlingsmediet.
RESULTAT: Celler från 11 av 13 tänder isolerades och odlades framgångsrikt adherenta till
odlingsytan i upp till 8 generationer. Celluttryck av de positiva markörerna CD73, CD90 samt CD44 bekräftades genom flödescymetri. Inget uttryck observerades för den negativa panelen CD45, CD34, CD11b, CD19 eller HLA class II. Uttrycket av CD105 kunde inte fastställas pga ofullständigt data. Försök till differentiering av celler till adipocyter och osteocyter visade på fenotypiska förändringar efter 21 dagar.
SLUTSATS: Den här studien har bidragit till framgångsrik isolering och delvis karaktärisering
av mesenkymala stamceller från periodontalligamentet hos friska tänder. En icke-invasiv metod av detta slag, resulterande i tillgång till denna cellpopulation utgör ett lovande verktyg för framtida studier med goda möjligheter till ytterligare kunskap applicerbart till kliniska situationer inom tandvården.
3
Study subjects and ethical approval: Ethics approval was granted by the Institutional Review
Board at Tandvårdshögskolan in Malmö (Dnr: STUD 3.5.3 -2017/2138). Study subjects undergoing premolar extractions for orthodontic reasons were recruited to participate in the study. Such enrollment involved signing a consent form agreeing to cell donation from extracted teeth.
Introduction:
Stem cell biology is an exciting field offering the promise of potential repair and regeneration of damaged tissue. In the fields of medicine, dentistry and tissue engineering there are many on-going studies to further understand and take advantage of stem cell capabilities. Characteristic for stem cells is their ability for self-renewal in addition to their specific potency. Potency is the ability of stem cells to differentiate into different cell lineages. Different categories of potency have been defined based on capability of cells to differentiate. The fertilized egg is referred to as being totipotent as it has the ability to differentiate into all possible cell types including extraembryonic tissues with capacity of developing into fetal tissue with later maturation into adult tissue. Embryonic stem cells are pluripotent meaning they have the ability to differentiate into almost any kind of cell except extraembryonic tissue. Going down in potency capability, mesenchymal stem cells are an undifferentiated population of cells said to be multipotent as they have potential to differentiate into a limited number of cells specifically; osteocytes, adipocytes and chondrocytes. Oligopotent stem cells are those with ability to differentiate into a few cell types. An example of oligopotent cells being myeloid stem cells. Lastly, the skin belongs to the unipotent category of stem cells as it is capable of differentiating into one type of cell (1,2).
Studies involving embryonic stem cells raise ethical issues which understandably has led to legislation controlling its use in research related activities (3–5). In the field of dentistry, the oral cavity is known to be an excellent source in harboring mesenchymal stem cells. Such cells have been isolated from dental pulp, the periodontal ligament, the apical papilla, the gingiva, the dental follicle as well as from exfoliated deciduous teeth (6–8). The accessibility of dental tissues and the multipotency of the mesenchymal stem cells makes it an attractive system to study. For example, in the event of a third molar extraction, the apical papilla from a root still developing can be used as a source for isolating cells (8). In a similar fashion, the periodontal ligament of a premolar extracted for orthodontic reasons may serve as a source of cells. At the time of extractions, a small biopsy of the gingiva can yield gingival cells (6).
For cell isolation from the periodontal ligament; the focus of this study, the literature, primarily describes two methods of cell isolation; one relying on cell outgrowth from minced tissues and one from single cell isolates obtained through an enzymatic method. Using both methods, scientists have been able to successfully isolate cells which have been used for further studies (9–12). Although there are two distinct methods described, there are many published protocols which differ in terms of both methods and materials used. For instance, in using the enzymatic method, some groups report using the enzymes Dispase I and Collagenase II digesting the extracellular matrix (10). Other groups rely on Trypsin as the enzyme of choice (13). One group Morsczeck et al. compared the two methods of isolation from the periodontal ligament in a single person and concluded that there was no difference in cell characteristics between the two resulting cell populations (9). Another group Nakahara et al. also reported having used both methods of isolation and that the two cell populations did indeed display different cell behavior in downstream in vivo experiments (14).
In 2006, The International Society for Cellular Therapy (ISCT) published a Position Paper on minimal criteria for defining multipotent mesenchymal stromal cells MSCs (15). Their rationale was that as researchers are using different methods for cell isolation and
4
characterization, there should be fulfillment of uniform criteria pertaining to the cells in order to later enable comparisons of data generated from studies of the cells in question. Their proposed criteria for characterizing MSC are as following:
1. “adherence to plastic in standard culture conditions”
2. “>95% of the MSC population must express CD105, CD73 and CD90 as measured by flow cytometry”
3. “cells must lack expression (<2% positive) of CD45, CD34, CD14 or CD11b, CD79a or CD19 and HLA class II”
4. “the cells must be able to differentiate to osteoblasts, adipocytes and chondroblasts under standard in vitro conditions”
CD stands for cluster of differentiation. Each cluster or group refers to monoclonal antibodies which binds to a particular cell marker. Such markers are surface antigens expressed by cells which can be used to distinguish a cell population from another. Different CD markers can be representative of different lineages or appear as a result of activation or maturation (16,17).
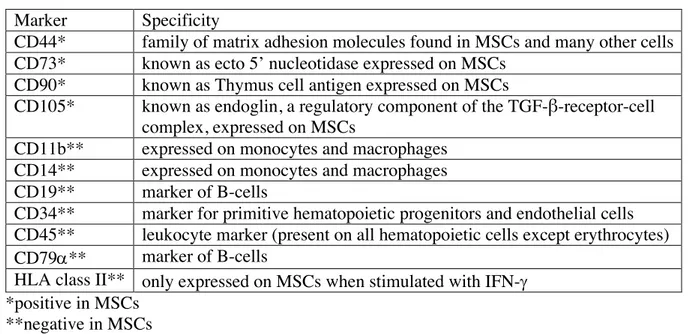
Table 1: Suggested markers for characterizing MSCs (15,18)
Marker Specificity
CD44* family of matrix adhesion molecules found in MSCs and many other cells CD73* known as ecto 5’ nucleotidase expressed on MSCs
CD90* known as Thymus cell antigen expressed on MSCs
CD105* known as endoglin, a regulatory component of the TGF-β-receptor-cell complex, expressed on MSCs
CD11b** expressed on monocytes and macrophages CD14** expressed on monocytes and macrophages CD19** marker of B-cells
CD34** marker for primitive hematopoietic progenitors and endothelial cells CD45** leukocyte marker (present on all hematopoietic cells except erythrocytes) CD79a** marker of B-cells
HLA class II** only expressed on MSCs when stimulated with IFN-g *positive in MSCs
**negative in MSCs
As suggested by ISCT, flow cytometry is the method of choice for verifying the presence and absence of specific markers in order for cells to be confirmed as mesenchymal stem cells. Flow cytometry is, a method that can be used to characterize cells based on size and fluorescence intensity. It allows populations of cells to be distinguished from one another based on expressions of antigens on cell surfaces. to which antibodies conjugated with fluorochromes can bind to. After laser excitation, fluorescence is measured as light emitted at various wave lengths. A flow cytometer instrument is composed of three different systems; fluidics, optics and electronics. The fluidics transport the cells or particles in a stream of fluid to the laser beam (19). The process of hydrodynamic focusing creates a stream of single particles which allows for single cell analysis (20).
In the field of dentistry; stem cell research provides an exciting tool for further studies,
attempting to understand regeneration and factors contributing thereof. One of the most
prevalent diseases worldwide, affecting the periodontium is periodontal disease, most often triggered by the presence of bacteria, and in the absence of oral hygiene tipping the balance point, activating the immune system, in turn leading to tissue destruction, observed as increased
5
pocket depth and bone loss. Successful periodontal treatment is characterized by a gain in attachment and lack of bleeding on probing. Treatment can be conservative and/or surgical and healing, histologically, is primarily characterized by repair; i.e. the new tissues formed at the previously diseased site differ in architecture and/or function from the original tissues. In contrast, regenerative periodontal treatment aims at restoring all specialized tissues of the periodontium, i.e. the alveolar bone proper, the cementum, the periodontal ligament and the gingiva (21,22). For regeneration to occur, all four tissues of the periodontium have to be generated in such a manner similar to what happens during normal tooth development.
Early in embryo development, the periodontium forms in a complex process with preprogrammed events. Cells involved receive signals for further differentiation in a most intriguing way ultimately forming the aforementioned tissues. As a dental professional, it is important to understand embryonic development and the mechanisms for which different tissues of the oral cavity arise. Only after exhibiting this knowledge, one is able to comprehend on a cellular level physiological changes and morbidity affecting the oral tissues and can better understand the effects of treatment and potential healing involved.
Odontogenesis or tooth development happens in stages identifiable as the initiation stage, the bud stage, the cap stage and the bell stage. During these stages, physiological processes occurring in the embryo include induction, proliferation, differentiation, morphogenesis and maturation (23). The induction takes place in the initiation stage and involves interaction between embryonic tissue types. Early in the embryonic period, cells from the neural crest migrate into the first branchial arch and form a band of ectomesenchyme. The ectomesenchyme lies deep to the ectoderm lined stomodeum or primitive mouth of the embryo. The oral epithelium arises from the outer part of the ectoderm and release signals for interactions with the ectomesenchyme. The dental lamina develops by proliferating oral epithelium expanding into growing ectomesenchyme forming a “bud” like structure characteristic of the bud stage. A basement membrane separates the oral epithelium and dental lamina from the ectomesenchyme.
In the cap stage which follows, each bud will develop into a tooth germ with its associated supporting tissue. Condensation of the ectomesenchyme takes place and the resulting “ball” of ectomesenchymal cells becomes the dental papilla which will give rise to the dentin and the pulp as well as the dental follicle which will form the periodontium. The dental papilla as well as the dental follicle are both derived from the echtomesenchyme influenced by neural crest cells. Thus, the dentin, the pulp and the periodontium are all of mesenchymal origin. The cap like structure on top of the condensed ectomesenchyme forms the enamel organ which will eventually create the enamel on the outer tooth surface. The enamel organ is thus derived from ectoderm.
During the bell stage of tooth development, the enamel organ will differentiate into a bell shape with four types of cells, the outer and inner enamel epithelium surrounding the stellate reticulum and stratum intermediate. The inner enamel epithelium will at a later point differentiate into ameloblasts (enamel secreting cells). Differentiation also takes place in the dental papilla with outer cells as well as central cells. The central cells will later form the pulp and the outer cells will differentiate into odontoblasts (dentin-secreting cells). The differentiation of the cells of the dental follicle happens later after crown formation has taken place (21,23,24).
As the development of the dental crown comes to an end, the epithelial cells of the inner and outer enamel epithelium grow apically in a double cell layer called the Hertzwig’s epithelial root sheath (HERS). HERS induce odontoblastic differentiation and the resulting odontoblasts take place in root formation by secreting dentin. Disintegration of HERS happens coronally as the growth of the root proceeds in an apical direction. The products of this disintegration are known as the epithelial cell rests of Malassez which are forever found in the
6
periodontal ligament. The disintegration of the HERS leaves the dentin surface on the root exposed making it accessible to other cells such as the dental follicular cells making up the periodontium. Differentiation of cementoblasts is initiated and the root surface is covered by deposited cementum. In this process, Sharpey’s fibers are inserted both in the cementum side as well as in the bone matrix with longer collagen fibers connecting the two, anchoring the tooth in its socket and providing the supportive periodontal ligament in between (22,25,26).
In their paper, “The Role of the epithelial cell rests of Malassez in the development, maintenance and regeneration of periodontal ligament tissues” Bartold et al. talk about the mesenchymal epithelial cell interactions and suggest that further studies in this area take place (25). Another group Tian et al. have developed an immortalized Hertwig’s epithelial root sheath cell line (27). They have shown that their cell line induced dental papilla cells into odontoblasts in vitro and that they generated dentin-like tissue in vivo. Likewise, it would be of interest to pursue similar studies using mesenchymal stem cells isolated from the periodontal ligament. This in the quest of further understanding regeneration as it applies to the periodontium. Thus, this study was designed and undertaken.
Purpose of this project:
To isolate and culture viable cells from the periodontal ligament and confirming their identity as mesenchymal stem cells.
Hypothesis:
Can viable mesenchymal stem cells from the periodontal ligament of healthy teeth be isolated and maintained in culture preserving their multipotency over several generations?
To test the hypothesis, the following specific aims were developed:
Specific aim 1: To isolate and culture stem cells from the periodontal ligament from healthy
teeth
Specific aim 2: To characterize and confirm the identity of the periodontal ligament cells as
mesenchymal stem cells
Materials and methods:
Recruitment of study subjects and inclusion criteria:
Patients with planned orthodontic extractions were approached and asked for participating in the study, which involved donating the extracted tooth/teeth for cell isolation. After receiving verbal and written information about the proposed study, subjects were presented with a consent form agreeing to participation. Only criteria for enrollment was that the tooth be healthy and that the patient consented to participation by signing the consent form. In the case of subjects under the age of 15, a separate consent form was provided, asking for signatures from guardians in addition to consent by the study subject.
Tooth extractions and collection:
Majority of extractions were performed at a private Orthodontic Clinic in Malmö by Orthodontic Specialists except for three which were carried out by 5th year dental students at Tandvårdshögskolan in Malmö. Extracted teeth were collected in complete DMEM
7
(Dulbecco’s minimum Eagle modified medium containing 10% FBS (Fetal Bovine Serum) and 1% Penicillin/Streptomycin, Gibco BRL) and were transported to the laboratory on ice.
MSC isolation, explant method:
For cell isolation, using an explant method, standard protocols were followed (9,12). Briefly, teeth were rinsed in fresh medium and the middle 1/3 of the root was scraped using a sterile surgical blade (Braun 11). The resulting tissue was minced into smaller pieces and placed on a 35x10mm plastic cell culture plate (Sarstedt). 100µl complete DMEM was added to the tissues and a sterile glass coverslip was placed on top to sink the tissue fragments to the bottom of the plate. The plate was placed at 37°C, 5%CO2 in a humidified atmosphere
(ThermaForma Stericycle CO2 incubator) for an hour before an additional 1ml complete medium was added. The plate was then returned to the incubator to allow cell outgrowth to take place. Every 3-4 days, 75% of the medium was replaced with fresh complete DMEM.
MSC isolation enzymatic method:
For cell isolation by enzymatic method, standard protocols were followed (9,13). Teeth were washed 3x5min in complete medium containing 5% antibiotics. The middle 1/3 of the root was scraped with a sterile surgical blade (Braun 11). The tissue was added to a 15ml tube and 500μl Trypsin-EDTA (0.25%/0.1% Gibco BRL) was added. The tube was placed at 37°C for 20 minutes to allow for enzymatic digestion of the tissue. At 5 min intervals, the tissue was shaken vigorously. To inactivate the enzymatic reaction, 500μl complete DMEM was added whereupon the sample was centrifuged at 1800rpm for 10 min (Biofuge Primo (Heraeus) The supernatant was discarded, and the pellet was resuspended in 1ml complete DMEM. Cell suspension was divided in 2 and added to each of a 35x10mm plastic cell culture plate (Sarstedt). Cells were incubated at 37°C, 5%CO2 in a humidified atmosphere (ThermaForma Stericycle CO2 incubator) overnight to allow for adhesion of cells to the culture plates. The next day, 1.5ml complete DMEM was added to each plate before returning them to the incubator where they were maintained at the earlier mentioned culture conditions. Complete DMEM was replaced every 72 hours. Passaging of cells was performed using 0.05% Trypsin-EDTA and cells were maintained in culture up to passage 8. Passage 1 cells were moved to a T-25 flask while subsequent passages were maintained in T-75 culture vessels (Sarstedt). Cell aliquots at various passages were suspended in 10% DMSO in FBS and were stored at -80°C for future studies. Throughout the cell culture process, cells were observed in an inverted phase-contrast microscope (Olympus CK40). Images were captured and documented using a microscope mounted real time camera (Olympus U-PMTVC OG05022) and the Infinity Capture application software (version 6.5.4).
Characterization as MSCs: Flow cytometry:
Flow cytometry was carried out at the Flow Cytometry Core Facility at the Clinical Research Centre at Skåne University Hospital. Cell sample #10 was analyzed at passage 5. A Human MSC Analysis Kit from BD Biosciences was used. The kit included an hMSC Positive Cocktail with the following antibodies CD90 FITC, CD105 PerCP-CY5.5, CD73 APC as well as an hMSC Negative Cocktail containing antibodies; CD45 PE, CD34 PE, CD11b PE, CD19 PE, HLA-DR PE enabling multi-color analysis. It also included a CD44 PE antibody conjugate to use as a “drop in” for the PE channel. In addition, the kit supplied the appropriate isotype controls for the chosen antibodies as well as individual positive antibody markers to enable compensation set-up.
For staining the cells, the supplied protocol was followed. Briefly, cells were detached from culture flasks using BDTMAccutaseTM Cell Detachment Solution (BD Biosciences). Cells
8
were counted in a hemocytometer using Trypan Blue exclusion dye (0.4% Gibco BRL). For each tube, a 50µl cell suspension of 1x10⁵ cells in BD PharmingenTM Stain Buffer was used. An antibody titration experiment was run to test the optimal concentration of antibody. Concentrations were as following; 1:20, 1:40, 1:60 and 1:80. For each concentration, 9 tubes were set up including the desired antibody targets as well as appropriate controls.
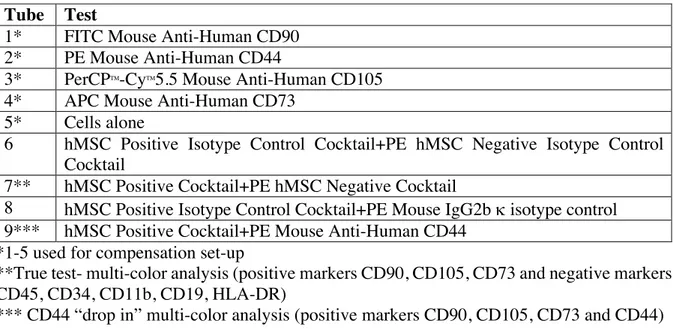
Table 2: Flow cytometry set up was as following: Tube Test
1* FITC Mouse Anti-Human CD90 2* PE Mouse Anti-Human CD44
3* PerCPTM-CyTM5.5 Mouse Anti-Human CD105 4* APC Mouse Anti-Human CD73
5* Cells alone
6 hMSC Positive Isotype Control Cocktail+PE hMSC Negative Isotype Control Cocktail
7** hMSC Positive Cocktail+PE hMSC Negative Cocktail
8 hMSC Positive Isotype Control Cocktail+PE Mouse IgG2b k isotype control 9*** hMSC Positive Cocktail+PE Mouse Anti-Human CD44
*1-5 used for compensation set-up
**True test- multi-color analysis (positive markers CD90, CD105, CD73 and negative markers CD45, CD34, CD11b, CD19, HLA-DR)
*** CD44 “drop in” multi-color analysis (positive markers CD90, CD105, CD73 and CD44) Following staining, for 30 minutes on ice in the dark, cells were washed twice with BD PharmingenTM Stain Buffer. After the final wash and centrifugation in a microcentrifuge (300g, 4°C), final cell pellets were resuspended in 500µl of BD PharmingenTM Stain Buffer whereupon cells were analyzed on a Cytoflex flow cytometer by Beckman Coulter. After compensation and gating, the flow cytometry data was analyzed using CytExpert Software (Beckman Coulter). Data was presented in dot-blots and histograms.
Cell differentiation:
For verification of the ability of the isolated cells to differentiate into osteocytes and adipocytes, a Human Mesenchymal Stem Cell Functional Identification Kit from R&D systems was used. Sample #10 passage 2 and sample #12 passage 1 were chosen for analysis.
The supplied kit protocol was followed: Briefly, cells were detached from culture flasks using BDTMAccutaseTM Cell Detachment Solution (BD Biosciences). Cells were counted in a hemocytometer using Trypan Blue exclusion dye (0.4% Gibco BRL).
For osteogenic differentiation, cells were seeded at a density of 4.2x10³ cells/cm2 in a MEM Basal Media (90% a MEM (Gibco BRL), 10% Fetal Bovine Serum (MSC certified), 100U/ml Penicillin, 100µg/ml Streptomycin, 2mM L-Glutamine (Gibco BRL)). Considering each well was approximately 1.76cm2, 7.4x10³ cells was seeded/well. Prior to seeding, a sterile coverslip had been added to each well, creating a system for cells to attach to a removable surface for subsequent analysis. At 50-70% confluency, the media in each well was replaced by Osteogenic Differentiation Media to induce osteogenesis. To make the Osteogenic Differentiation Media, a concentrated solution supplied with the kit (containing dexamethasone, ascorbate-phosphate, proline, pyruvate and recombinant TGF-b3) was diluted in a MEM Basal Media. This solution was replaced every 3-4 days and was made fresh each
9
time. The cells were incubated at 37°C, 5%CO2 in a humidified atmosphere (ThermaForma Stericycle CO2 incubator) for 21days.
For adipogenic differentiation, cells were seeded at a density of 2.1x10⁴ cells/cm2 (3.7x10⁴cells/well) in a MEM Basal Media. At 100% confluency, the media was replaced by Adipogenic Differentiation Media to induce adipogenesis. The Adipogenic Differentiation Media was made by diluting concentrated Adipogenic Supplement supplied with the kit (containing hydrocortisone, isobutylmethylxanthine and indomethacin in 95% ethanol) to a MEM Basal Media. Like in the case of osteogenic differentiation, the solution was replaced every 3-4 days and was made fresh each time. The incubation was also the same at 37°C, 5%CO2 in a humidified atmosphere (ThermaForma Stericycle CO2 incubator) as well as the time duration of 21 days. Cells were observed in an inverted microscope and photographed every few days to document any phenotypic changes.
As shown below in figure 1, a triplicate of each sample was set up for each differentiation. Sample #10 Sample #12
Osteogenic Differentiation: A1, B1, C1 Osteogenic Differentiation: A1, B1, C1 Adipogenic Differentiation: A3, B3, C3 Adipogenic Differentiation: A3, B3, C3
Figure 1: Plate set-ups for differentiation experiment
After 21 days, osteocytes and adipocytes were fixed and processed for immunostaining. For fixing and permeabilization, an Image-it Fix-Perm kit (Life Technologies) was used. After fixing cells in 4% paraformaldehyde, they were photographed before subjected to immunocytochemistry. Post permeabilization and blocking in 0.3% Triton-X-10, 1%BSA and 10% normal donkey serum (Abcam), cells were incubated with antibodies supplied in the Human Mesenchymal Stem Cell Functional Identification Kit. For the osteogenic differentiation, the antibody was a mouse anti-human Osteocalcin monoclonal antibody which was used at a final concentration of 10ug/ml. For the adipogenic differentiation, the antibody was a goat anti-mouse FABP4 polyclonal antibody used at the same concentration as the Osteocalcin antibody. After incubation with primary antibodies overnight at 4°C and three subsequent washes, the samples were subjected to secondary antibody incubations in the dark for 60 minutes. The secondary antibody was a NL557-conjugated donkey anti-mouse in the case of the osteocytes and a NL557- conjugated donkey anti-goat in the case of adipocytes. Following three washes, the coverslips were carefully removed and mounted cell side down on microscope slides. The mounting media used was ProLongTM Gold Antifade Mountant (Molecular Probes). After 24 hours of curing in the dark, cell samples were imaged in a NIS Elements Nikon eclipse TE 2000-E confocal microscope.
10
Results:
Explant outgrowth method of cell isolation:
Table 3: The following teeth were extracted at Tandvårdshögskolan and the explant method
was used for cell isolation. Subject Date
of extraction
Age Sex Duration FA Tooth Extraction performed by
Sample # 1 Explant 180417 17 M Unknown 15 Dental student 1 Explant 1*
180517 35 Dental student 2 Explant 2
*Sample was discarded after 4 weeks due to no observed cell outgrowth. Bacterial contamination was visible a few days after initial plating.
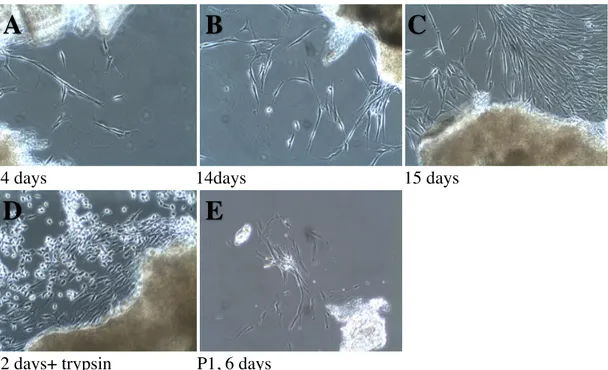
14 days 14days 15 days
22 days+ trypsin P1, 6 days
Figure 2. Photographs of sample Explant 2 from 180517, tooth 35 at different time points after
explant cell outgrowth method (magnification 10X).
As seen in fig. 2, spindle shaped cells were observed as outgrowths from the minced tissues. These were noticeable at 14 days after initial plating and were attached to the plastic plate surface (A). At 15 days, more confluent patches of cells were observed (C). At 22 days, the cells around the explants appeared even more confluent and were subjected to trypsinization to attempt to passage them into a T-25 tissue culture flask (D). Picture (D) also demonstrates the effect of trypsin in detaching cells from the plate. With the loss of attachment, the cells appeared round, without extensions and started floating in the culture media. In (E), cells are shown in passage 1, 6 days after trypsinization. It is clear from the cellular extensions that cells had adhered to the flask and there was some level of cell growth. However, cell density seemed low.
A
B
C
11
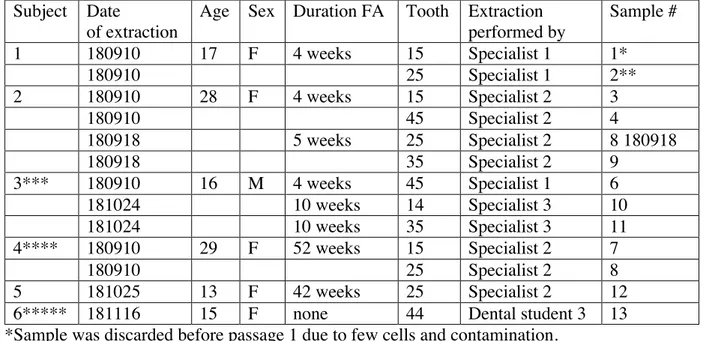
Table 4: The following teeth were extracted, and cells were isolated from the periodontal
ligament using an enzymatic method. Subject Date
of extraction
Age Sex Duration FA Tooth Extraction performed by Sample # 1 180910 17 F 4 weeks 15 Specialist 1 1* 180910 25 Specialist 1 2** 2 180910 28 F 4 weeks 15 Specialist 2 3 180910 45 Specialist 2 4 180918 5 weeks 25 Specialist 2 8 180918 180918 35 Specialist 2 9 3*** 180910 16 M 4 weeks 45 Specialist 1 6 181024 10 weeks 14 Specialist 3 10 181024 10 weeks 35 Specialist 3 11 4**** 180910 29 F 52 weeks 15 Specialist 2 7 180910 25 Specialist 2 8 5 181025 13 F 42 weeks 25 Specialist 2 12
6***** 181116 15 F none 44 Dental student 3 13
*Sample was discarded before passage 1 due to few cells and contamination. ** Sample was discarded after passage 1 due to slow growth.
***Patient consented to donate one of two premolars extracted on this date.
****Patient had FA for one year when a change in therapy required premolar extractions. *****Extraction carried out at Tandvårdshögskolan in Malmö.
Total # of subjects: 6 Total # of samples: 13
The cells adhered to the plastic surfaces both on the initial plates they were plated on as well as to the subsequently used tissue culture flasks.
In table 4, details of the included study subjects are shown. In all, the study included 6 subjects who altogether donated 13 premolars to be used for periodontal ligament cell
isolation after orthodontically indicated extractions. The 13 premolars were referred to as samples. The study group consisted of 5 females and 1 male and ranged in age from 13-29. Of the 13 teeth, 8 were upper jaw premolars, while 5 were lower jaw premolars. A majority of the teeth were second premolars (11), while only 2 were first premolars. At the time of extraction, 5 out of 6 subjects had been fitted with fixed appliances ranging from 4 to 52 weeks. All but one extraction (which was carried out by a student at Tandvårdshögskolan in Malmö) were performed by Orthodontists in a private dental clinic in Malmö city.
PDLSC were successfully isolated from all 13 teeth. Except for the first two samples, all cells were maintained in culture over an extended period of time up to passage 8.
12
7 days 9 days 15 days
P1 1day P1 6 days P2 after plating
P3 3 days
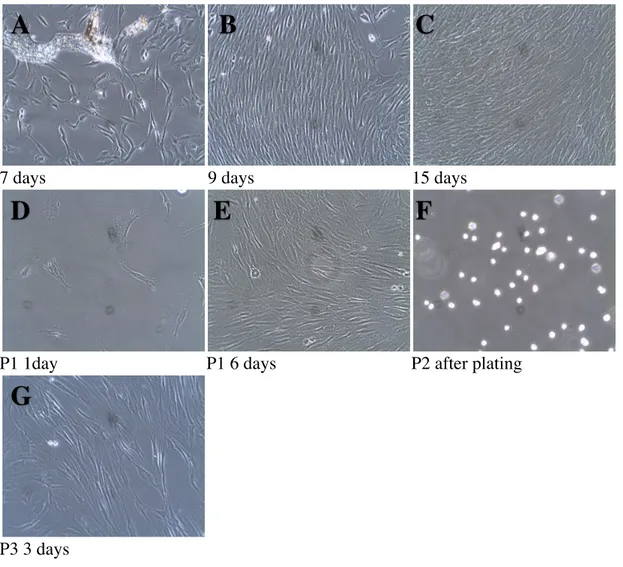
Figure 3. Photographs of Subject 2, sample #4, tooth 45 at different time points after cell
isolation by an enzymatic method (magnification 10X).
In fig.3. spindle shaped cells were observed adhering to the plastic plate at 7 days after isolation. A small piece of tissue is seen around the individual cells (A). At 9 days after plating, cells appeared confluent in patches surrounded by individual cells (B). At 15 days, most patches were confluent, and cells were subjected to trypsinization (C). The next image shows cells 1 day after trypsinization and passaging into a T-25 tissue culture flask. They are evenly dispersed in the flask attached to the bottom (D). As seen at 6 days, cells were already confluent
(E). The following picture demonstrates cells going into passage 2, right after trypsinization at
0 days. The picture demonstrates the effect of the trypsin in detaching the cells from the plate. With the loss of attachment, the cells appeared round without extensions and were floating in the culture media (F). The last image is showing cells in passage3, 3 days after trypsinization as elongated extensions lining up in parallel (G).
A
B
C
D
E
F
13
5 days 8 days 13 days
P1 2 days P1 5 days P1 9 days
P2 after plating P2 4 days P2 6 days
P5 2 days P6 7 days
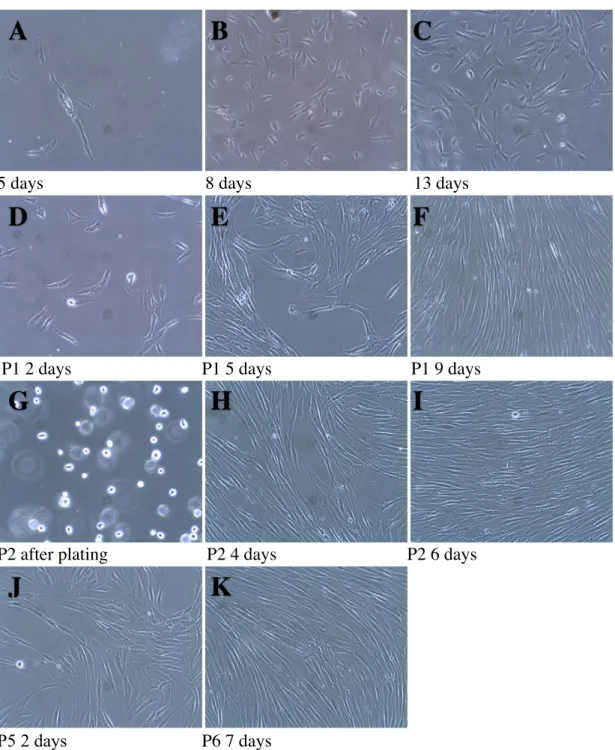
Figure 4. Photographs of Subject 3, sample #10, tooth 14 at different time points after cell
isolation by an enzymatic method (magnification 10X).
In fig.4, spindle shaped cells were observed adhering to the plastic plate at 5 days after isolation
(A). At 8 days after plating, individual cells were evenly dispersed on the plate (B). At 13 days
after plating, cells have expanded both in size and number (C). In (D), cells are shown in passage 1, 2 days after trypsinization. At 5 days after trypsinization, cells are starting to gain confluency in patches (E) which becomes even more evident at 9 days with cells aligned as elongated streaks in parallel (F). In (G), passage 2 cells are shown in their floating stage right after trypsinization and plating. Cells are gaining confluency in an aligned arrangement (H). At 6 days, passage 2 cells are already confluent (I) and were used to set up experiments studying differentiation. At passage 5, 2 days after plating, the phenotype is no different from
A
B
C
D
E
F
G
I
J
K
14
earlier passages (J). At P6, 7 days, cells were confluent and were analyzed by flow cytometry
(K).
4 days 7 days 12 days
P1 2 days P1 5 days P1 13 days
P1 15 days P4 6 days
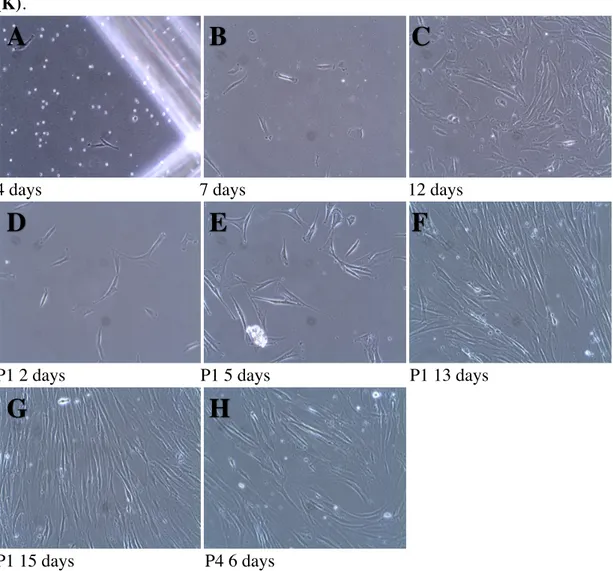
Figure 5. Photographs of Subject 5, sample #12 tooth 25 at different time points after cell
isolation by an enzymatic method (magnification 10X).
In fig.5, spindle shaped cells were observed adhering to the plastic plate at 4 days after isolation
(A). At 7 days after plating, individual cells were evenly dispersed on the plate (B). At 12 days
after plating, cells had expanded both in size and number (C). In (D), cells are shown in passage 1, 2 days after trypsinization. At 5 days after trypsinization, cells are starting to gain confluency in patches (E) which becomes even more evident at 13 days with cells aligned as elongated streaks in parallel (F). In (G), passage 1 cells at 15 days are shown to be gaining confluency in an aligned arrangement. At passage 4, 6 days after plating, the phenotype is no different from earlier passages (H).
A
B
D
E
F
G
H
15
Flow cytometry data:
Figure 6. Dot-plot showing size (forward scatter-width and forward scatter-height), and gating
of Subject 3 cell population, sample #10, tooth 14 stained with positive cocktail mix +CD44 (antibody concentrations 1:80)
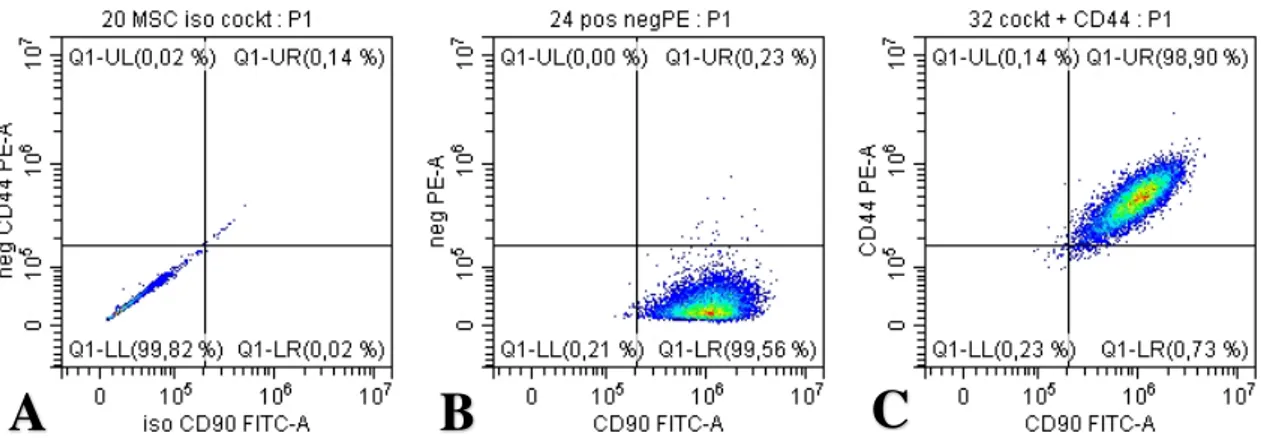
Figure 7. Dot-blot showing expression of CD90 and CD44. In (A), sample #10 is stained with
the appropriate isotype controls for the positive cocktail mix. (B), shows sample #10 stained with the positive and negative cocktail mixes. The y-axis is the expected negative PE-channel and the x-axis is the CD90 FITC-channel. In (C), sample #10 is stained with the positive cocktail mix and the add-in CD44 antibody. The y-axis is the CD44 PE channel and the x-axis the CD90 FITC-channel. (antibody concentrations 1:80)
A
B
C
16
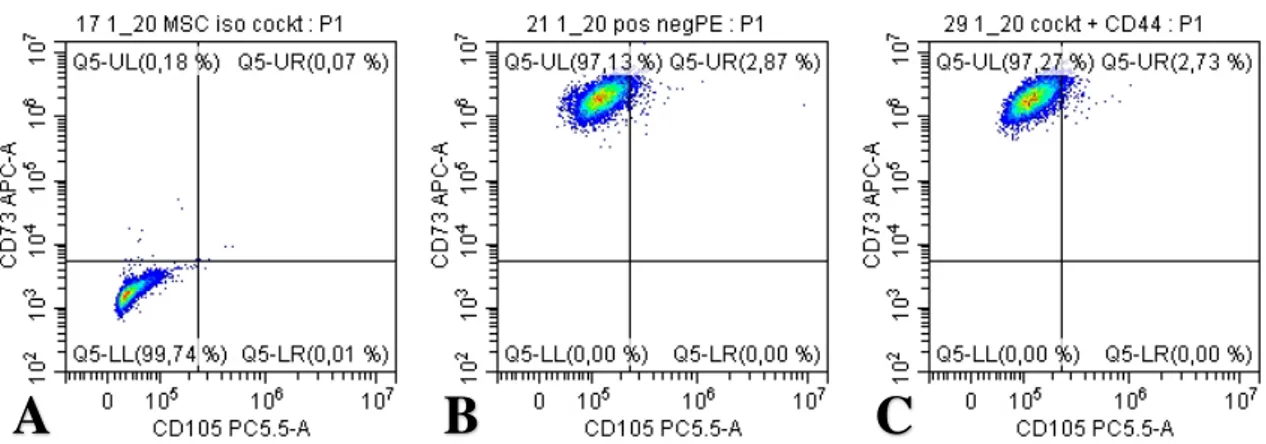
Figure 8. Dot-blot showing expression of CD73 and CD44. In (A), sample #10 is stained with
the appropriate isotype controls for the positive cocktail mix. (B), shows sample #10 stained with the positive and negative cocktail mixes. The y-axis is the expected negative PE-channel and the x-axis is the CD73 APC-channel. In (C), sample #10 is stained with the positive cocktail mix and the add-in CD44 antibody. The y-axis is the CD44 PE-channel and the x-axis the CD73 APC-channel. (antibody concentrations 1:80)
Figure 9. Dot-blot showing expression of CD105 and CD44. In (A), sample #10 is stained with
the appropriate isotype controls for the positive cocktail mix. (B), shows sample #10 stained with the positive and negative cocktail mixes. The y-axis is the expected negative PE-channel and the x-axis is the CD105 PC 5.5-channel. In (C), sample #10 is stained with the positive cocktail mix and the add-in CD44 antibody. The y-axis is the CD44PE channel and the x-axis the CD105 PC 5.5-channel. (antibody concentrations 1:80)
Figure 10. Dot-blot showing expression of CD105 and CD73. In (A), sample #10 is stained
with the appropriate isotype controls for the positive cocktail mix. (B), shows sample #10 stained with the positive and negative cocktail mixes. The y-axis is the expected CD73 APC-channel and the x-axis is the CD105 PC 5.5-APC-channel. In (C), sample #10 is stained with the positive cocktail mix and the add-in CD44 antibody. The y-axis is the CD73 APC- channel and the x-axis the CD105 PC 5.5-channel. (antibody concentrations 1:20)
A
B
C
17
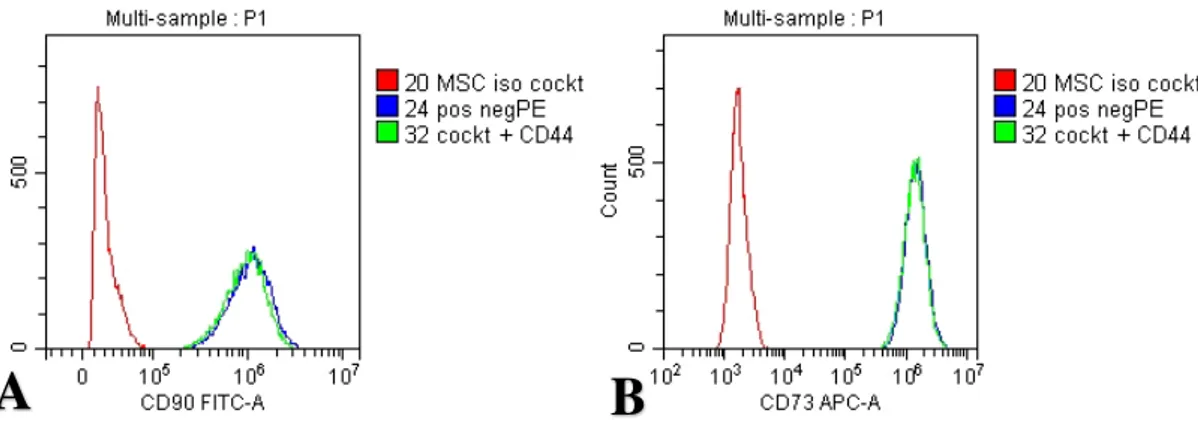
Figure 11. Histograms of sample #10 (A) CD90 FITC and (B) CD73 APC. The color red
denotes; isotype control antibody, blue color; positive and negative antibody cocktails and green color; positive cocktail and CD44 add-in antibody. (antibody concentrations 1:20)
Figure 12. Histograms of sample #10 (A) CD105 PC5.5 (antibody concentrations 1:20) (B)
CD105 PC5.5 (antibody concentrations 1:80). The color red denotes; isotype control antibody, blue color; positive and negative antibody cocktails and green color; positive cocktail and CD44 add-in antibody.
A
B
A
A
18
Osteogenic Differentiation:
Day 1+osteo Day 10+osteo 1 Day 12+osteo
Day 17+osteo Day 21+osteo Day 21+osteo (20X)
Day 21+osteo (fixed sample)
Figure 13. Photographs of subject 3, sample #10, tooth 14 treated with Osteogenic
Differentiation Media (a MEM Basal Media containing dexamethasone, ascorbate-phosphate, proline, pyruvate and recombinant TGF-b3) to induce osteogenic differentiation over 3 weeks.
In fig.13., Cells were about 50% confluent on day 1 of addition of osteogenic media (A). At day 10 of osteogenic induction, cells were 100% confluent and some signs of nodule formation were present (B). At 12 days of exposure to osteogenic media, cells were even more confluent and had a bulging appearance (C). In (D), cells are shown at day 17 of growing in osteogenic media. Confluent cells are aligned and seem even more bulging. At day 21, the phenotype is even more suggestive of cells having undergone differentiation (E) which is seen at a higher magnification (F) also at 21 days. In (G), cells are fixed at 21 days before subjected to immunohistochemistry.
(All pictures are at 10X magnification unless otherwise noted.)
A
B
D
C
E
F
19
Day 1 +osteo Day 10 +osteo Day 17 +osteo
Day 21 +osteo Day 21 +osteo (20X) Day 21 +osteo (fixed sample 20X)
Figure 14. Photographs of subject 5, sample #12, tooth 25 treated with Osteogenic
Differentiation Media (a MEM Basal Media containing dexamethasone, ascorbate-phosphate, proline, pyruvate and recombinant TGF-b3) to induce osteogenic differentiation over 21 days. In fig.14., Cells were about 50% confluent on day 1 of addition of osteogenic media (A). At day 10 of osteogenic induction, cells were 100% confluent and were seen in aligned streaks
(B). At 17 days of exposure to osteogenic media, cells were even more confluent and had a
bulging appearance (C). In (D), cells are shown at day 21 of growing in osteogenic media. Confluent cells are aligned and seem even more bulging. The phenotype is even more suggestive of cells having undergone differentiation as seen at a higher magnification (E) also at 21 days. In (F), cells are fixed at 21 days before subjected to immunohistochemistry. (All pictures are at 10X magnification unless otherwise noted.)
A
B
C
20
Adipogenic Differentiation:
Day 1 +adipo Day 10 + adipo Day 12 + adipo
Day 17 + adipo Day 21 + adipo Day 21 +adipo (20X)
Day 21+ adipo (fixed sample 20X)
Figure 15. Photographs of subject 3, sample #10, tooth 14 treated with Adipogenic
Differentiation Media (a MEM Basal Media containing hydrocortisone, indomethacin and isobutylmethylxanthine in 95% ethanol) to induce adipogenic differentiation over 21 days. In fig.15., Cells were almost 100% confluent on day 1 of addition of adipogenic media (A). At day 10 of exposure to adipogenic media, cell density seemed less (B). At 12 days of exposure to adipogenic media, cells had almost a brush like appearance (C). In (D), cells are shown at day 17 of growing in adipogenic media. Cells are more confluent and although lined up, they seem bulkier. At day 21 (E), the phenotype is even more suggestive of cells having undergone differentiation with vacuoles present. 21 days at higher magnification 20X (F) the vacuoles are clearly detectable. In (G), cells are fixed at 21 days before subjected to immunohistochemistry. (All pictures are at 10X magnification unless otherwise noted.)
A
B
C
D
E
F
21
Day 1 + adipo Day 10 + adipo Day12 + adipo
Day 17 + adipo Day 21 + adipo Day 21 + adipo fixed sample 20X
Figure 16. Photographs of subject 5, sample #12, tooth 25 treated with Adipogenic
Differentiation Media (a MEM Basal Media containing hydrocortisone, indomethacin and isobutylmethylxanthine in 95% ethanol) to induce adipogenic differentiation over 21 days. In fig.16., Cells were about 90% confluent on day 1 of addition of adipogenic media (A). At day 10 of exposure to adipogenic media, cell density seemed less, and cells seemed to have extended lengthwise (B). At 12 days of exposure to adipogenic media, cells had broader appearance (C). In (D), cells are shown at day 17 of growing in adipogenic media. Cells are more confluent and although lined up, they seem bulkier. At day 21 (E), the phenotype is even more suggestive of cells having undergone differentiation with vacuoles present. In (G), cells are fixed at 21 days before subjected to immunohistochemistry. Vacuoles can be observed. (All pictures are at 10X magnification unless otherwise noted.)
Discussion:
In the initial study design, the plan was to recruit study participants from Tandvårdshögskolan in Malmö. After being granted ethics approval, it was soon realized that the majority of orthodontic patients being treated at the specialist clinic at Tandvårdshögskolan were referred from outside clinics which meant orthodontic extractions were performed by general dentists in patients’ “home” clinics. Thus, very few extractions took place at Tandvårdshögskolan, limiting available subjects. To our knowledge, from February 2018- January 2019, only 3 orthodontic patients have had premolar extractions at Tandvårdshögskolan. One patient declined participation, leaving one subject donating two teeth and another subject donating one. To overcome this challenge, contact was made with an outside Orthodontic Clinic in Malmö city where extractions take place on a weekly basis. Due to challenges in enrolling study subjects and receiving tooth donations, no attention was made in recruiting subjects based on age, sex, duration of fixed appliance and etc. As mentioned earlier, the only fulfillment as per the inclusion criteria was for the tooth to be healthy. Thus, the demographics of the subject population ended up being such as described in table 3 and table 4.
A
B
D
E
F
22
Table 3 shows details of the first collected samples which were subjected to the explant isolation method. Initially, this method was selected due to requiring fewer reagents while being less labor intensive. As mentioned in the result section, no cell outgrowths were observed from the first premolar extracted, and after 4 weeks, the plate was discarded. The bacterial growth which was observed may have provided a competitive environment for the cells and prevented further cell growth. The reason for adding antibiotic to the medium was to keep bacterial contamination at bay. At the time of the second extraction from the same patient, it was discovered that a bacterial infection had developed post extraction which had been treated with oral antibiotics. It was therefore considered if a bacterial overload was the potential source of sample contamination. The second premolar from the same subject extracted one month later, yielded more promising result as can be seen in figure 2. Cell outgrowths were observed as migrating cells from the explant tissues. Cells became more confluent indicating there was cell division taking place. After trypsinization, cell density was quite low and cell growth seemed retarded. The flask was maintained in the incubator for several weeks, but cells did not reach confluence. Finally, the flask was discarded. Reason for this lag in cell growth could be several. Perhaps the cell density was too low to begin with and after trypsinization and moving the cells into a larger tissue culture vessel, the density was too low for them to continue to thrive and expand.
There were also questions regarding the extractions themselves and if there was variability in available periodontium pending technique and time duration of extraction. The two extractions at Tandvårdshögskolan were performed by students and the time duration was quite long with an approximate time of 45 minutes. Students also used elevators and luxators in addition to extraction forceps for extracting teeth. Techniques which may have damaged the PDL, affecting not only the amount of available tissue, but also the quality of the tissue. Worth mentioning is that another member of the laboratory attempted isolating cells using the same explant method on at least 6 premolars extracted in the orthodontic specialist clinic without any success. This information made the theory of technique and time duration seem less crucial in the failure of isolating cells. Besides, the one sample that ended up in successful cell isolation was from a premolar extracted in the student clinic.
Another variable which was considered to possibly have an effect on successful cell isolation, was the discovery that the patients at the time of extractions were already fitted with fixed appliances (FA). Considering the applied orthodontic forces and duration of appliance wear, it was speculated if that would impact the targeted cell population within the PDL, resulting in fewer mesenchymal stem cells. In a review article by Kyrkanides et al. it is discussed that some methods of orthodontic movement stimulate mesenchymal stem cells to differentiate into osteoblasts presumably then leading to a cell population in the PDL already differentiated (28). Another group Mao et al. also discuss the PDL in tooth movement. They concluded that regulation on stem cell differentiation caused by the mechanical stress that arises during orthodontic treatment is unknown (29). From this, although in theory extracted teeth from subjects already fitted with FAs may present with fewer mesenchymal stem cells, it cannot be assumed. As seen later, the FAs where not a factor impacting successful isolation of mesenchymal stem cells.
Going back to the literature in quest of overcoming the failure in obtaining cells, it indicated enzymatic digestion may be more favorable than relying on cell outgrowth alone from the explant method (30). Various protocols were analyzed in search of a low-cost alternative that could be carried out within the limitations of the available facility in the Periodontal laboratory (9,13). The protocol which was adapted with some modifications such
23
as adding a series of stringent washes to teeth prior to cell isolation was one by a Mexican group, Clavel et al. (13).
After adopting the enzymatic method of isolation, this study resulted in successfully isolating and maintaining cell cultures from 11 out of 13 samples as seen in Table 4. The enzyme digestion method using trypsin to disintegrate the tissue was successful in yielding single cell isolates. Figure 3, 4 and 5 show cells from 3 samples representing 2 subjects. Cells mostly appeared as individuals attached to the culture plate which then showed elongated extensions and as they reached confluency, they aligned in almost parallel streaks. The phenotype of the cells is very similar in all 3 samples as seen in the pictures. This led to the assumption that a similar cell population was isolated for all samples which was reinforced by flow cytometry data. As seen in figure 6, the majority of the cell population of sample 10 were of similar size as depicted by the forward scatter width and height. Similar observations on cell populations and sizes were noted for sample 6, 8, 10 and 12 (from 3 subjects) which were analyzed by flow cytometry in a preliminary experiment testing the flow cytometry methodology (data not shown). The cells that were isolated were kept in culture up to passage 8 through which the morphology was maintained. Literature suggests that MSCs can be kept up to passage 7-8 before they start losing heterogenicity (31,32). Growth factors naturally occurring in the fetal bovine serum which culture media is supplemented with may have a differentiation effect on the cells (33). To rule out this effect, after cell isolation, cells were maintained in a media containing MSC certified FBS.
Of the 13 samples in which enzymatic cell isolation was attempted (Table 4), sample 1 was discarded early on, as it had few cells and became contaminated. Sample 2 was discarded after passage 1 due to what appeared as retarded cell growth. Sample 1 and 2 being the first samples processed using the new method may be reason for this early failure. In addition, technique of dental practitioner performing tooth extraction was one variable which was re-considered. The fact that one sample which successfully yielded cells was extracted by the same specialist as the first two samples challenged this theory. In addition, the time duration of extraction was a factor revisited as crucial for successful cell isolation. Interestingly, a paper published by Yun et al. has explored how stemness of periodontal ligament stem cells is maintained after prolonged storage of extracted teeth. They were able to show that even after storing a tooth for one week after extraction, MSC characteristics were maintained and comparable to MSCs isolated immediately after extraction. They did however take care to clean the teeth thoroughly by ultrasonic scaling prior to extraction and rinsing with chlorhexidine. The extractions themselves were said to be performed atraumatically taking care not to damage the PDL (34). This study indicates a great resilience of the PDL with care taken to minimize bacterial contamination and trauma. In this study, it is evident that the study population with only 13 samples and many variables in way of age, sex, number tooth, dental provider etc. was too small to elucidate any difference in outcome as far as success. Such information was only considered in troubleshooting the method and refining the protocol. In protocol development it is essential to take all factors into account and consider the potential effect of each variable This way, one can optimize a protocol and eliminate potential errors in the process, one by one.
Having fulfilled specific aim 1 with successful isolation and culturing of cells, work was set out to attempt to characterize cells as MSCs. Preliminary flow cytometry data on sample 6, 8, 10 and 12 indicated high expression of positive markers CD73, CD90 and CD44 as well as an absence of expression of the expected negative markers CD45, CD34, CD11b, CD19, HLA-DR. For CD105, the expression was inconclusive with little to no binding. Data from this early experiment is not shown as the fluorescent signal was extremely high, making
24
it difficult to perform the necessary gating for proper analysis of the flow cytometry data. However, it was concluded from this experiment, that cells were of similar size and that different samples represented a similar cell population. In addition, it was concluded that the antibody concentration was too high.
The flow cytometry experiment was thus repeated for sample number 10 performing a titration experiment, varying the antibody concentration and finding the optimal one for showing maximum expression with low background. Diluting the antibody 4 times to 1:80 as compared to the preliminary experiment of 1:20 yielded the best outcome for CD73 and CD90 expression. For CD44, the most favorable concentration was 1:40 while for CD105 the highest concentration of 1:20 seemed insufficient. In figure 7B, it was noted that for sample 10, 99.56% of cells were positively stained with the CD90 antibody and 98.90% of cells were double stained with CD90 and CD44 (see figure 7C). The negative marker antibodies were conjugated to a PE fluorophore and seeing only 0.23% fluorescence in the PE channel (see figure 7C), it was concluded there was indeed no antibody binding to the sample and that the expected negative markers were truly negative. Similar observation was made in figure 8B, where the CD73 antibody showed 99.49% positivity and 0.51% in the PE channel. For CD44 and CD90, 98.90% of cells were double positive indicating that the vast majority of cells in the gated population, were positive for both CD44 and CD90 (see figure 7C). For CD44 and CD73, 99.99% of gated cells expressed both markers (see figure 8C). This clearly confirmed cells expressed both CD73 and CD90 while expression was lacking for CD45, CD34, CD11b, CD19, HLA-DR, partially fulfilling the minimal criteria for defining multipotent mesenchymal stromal cells (MSC) as proposed by the International Society for Cellular Therapy (ISCT) in terms of marker expression (15). The negative marker panel being truly negative ruled out cells from being hematopoietic cells such as leukocytes, monocytes, macrophages and B- cells. For CD105, the data was still inconclusive. In the dot plot in figure 9, it appears there is no expression of CD105 nor any of the PE labelled negative markers, as 99.17% of cells are in the lower left corner. When the CD44 antibody was added, 99.29% of the cells show expression of CD44 with no expression of CD105 (see figure 9C). CD44 expression is not one of the required markers by ISCT. It has however been shown to be expressed in MSC cells and therefore it was decided to use it as an add-in marker along with the positive cocktail kit that was used (35). The fact that it was conjugated with a PE fluorophore also allowed for testing of the PE channel. As mentioned earlier, the negative cocktail mix contained the negative antibody markers which were also conjugated to PE fluorophores. In this sample number 10, no fluorescence was detected in the PE channel.
Looking at the histogram for the CD105 fluorescence (figure 12), there is a separate peak in the isotype control sample compared to the sample with the positive antibody cocktail (peak also being reproduced in the sample with positive antibody cocktail + CD44 antibody ruling out background staining and CD105 expression as negative. Furthermore, using the CD105 antibody at the higher concentration of 1:20, the fluorescence intensity is even more different from the isotype control with the fluorescence peaks further away on the x-axis and separate from the isotype control. Looking at figure 10 which shows the corresponding dot plots at the higher antibody concentration of 1:20, 97.13% of the cells expressed CD73 while 2.87% cells expressed both CD73 and CD105 in the positive cocktail sample (see figure 10B) and 97.27% of cells expressed CD73 and 2.73% of cells expressed both CD73 and CD105 in the positive cocktail + CD44 antibody sample (see figure 10C). These observations suggest that in order to elucidate the CD105 expression, additional flow cytometry experiments need to be performed. One increasing the CD105 antibody concentration to see if the results are stemming from an antibody more dilute than expected. Another experiment which is planned
25
for is to run Fluorescence minus one (FMO) controls which is what it suggests, the experimental sample stained with all fluorophores minus one. When running a multicolor panel flow cytometry as in the case of the positive cocktail antibody used in this experiment it may be important. By taking the fluorescence spread into account, the FMO controls may provide valuable information as for setting the gates identifying a positive population from a negative one (36).
The last undertaking in characterizing the cells and fulfilling specific aim 2 was to perform an in vitro experiment attempting to differentiate cells to osteocytes, adipocytes and chondrocytes. Sample 10 (passage 2) and sample 12 (passage 1) were selected to be subjected to osteogenic and adipogenic differentiation. Due to laboratory limitations, the chondrogenic differentiation was not attempted at this time. Cells from early passages were selected as they were more likely to be undifferentiated progenitor cells with ability to differentiate than cells of older generations which may have already undergone differentiation. This was an extra precautionary measure considering the phenotype of all 11 successfully isolated and maintained samples stayed the same up to passage 8 when cells were cryopreserved and stored at -80°C. The literature suggests that MSCs can be cultured up to passage 7 without losing heterogenicity (32).
Figure 13 and 14 show the osteogenic differentiation of the two samples respectively. On day 1 of osteogenic media, the cells were about 50-70% confluent and appeared as single cells starting to elongate. On day 10 of osteogenic media supplement, cells had gained confluency and were growing aligned in streaks with the same characteristics as cells grown in regular medium (see figure 3,4 and 5). At day 12 of sample 10 and day 17 of sample 12 of osteogenic media, there were some phenotypic changes observed with nodule like formations visible in the cells. At day 21 of growing in osteogenic media these cuboid looking shapes were more obvious as seen in the images in figure 13 and 14. Fixing the cells at this stage was to see if osteocalcin could be detected by immunocytochemistry indicating osteogenic differentiation. The pictures of the fixed cells under phase contrast prior to staining showed a definite phenotypic change as compared to cells at plating on day 1. At the time of viewing the final slides with stained cells, it was not possible to focus the confocal microscope, making it impossible to view the cells. This was most likely caused by using expired and an insufficient volume of mounting media in the final step of mounting the cells on microscope slides. Instead of protecting and preserving the cells, the insufficient volume of mounting media caused samples to dry up, making the cells impossible to focus in on. (It should be mentioned that the only available mounting media was that left over from a different experiment in the laboratory facility).
Alternative methods of detecting osteogenic differentiation could have been the use of an alkaline phosphatase assay or staining with Alizarin red. Increased Alkaline phosphatase activity is a marker for osteoblast differentiation (9,37). By assaying the Alkaline phosphatse activity at different time points of adding the osteogenic supplements, it would have been possible to pin point biochemically when differentiation was taking place. Alizarin red stains calcium in functional osteoblasts and positive staining would thus have confirmed successful differentiation and cells as mesenchymal stem cells (9,15).
The adipogenic differentiation as shown in figure 15 and 16 demonstrates a phenotypic change over time. Cells were plated at a higher density than cells undergoing osteogenic differentiation, making them already on day one exhibiting the elongated cells typical of the MSC when confluent. With the addition of adipogenic media, the cells showed an increase in
26
size and vacuole looking expansions. This was very evident on day 21 when cells were fixed and subjected to immunostaining for mFABP4 (Fatty acid binding protein 4) which is found in adipocytes. Likewise, for the cells undergoing osteogenic differentiation, the final step of microscopy failed with the use of the available mounting media. Nevertheless, the
observed phenotypic change under phase contrast indicated differentiation took place
An alternative method of confirming adipogenic differentiation could have been staining with oil-red which stains lipids during adipocyte differentiation (1,10).
Concluding the differentiation experiments, the phenotypic observations under phase contrast microscopy showed differentiation of MSCs took place when exposing cells both to osteogenic and adipogenic media. To confirm expression of osteocalcin and FABP4, the immunocytochemistry has to be repeated with some protocol changes. A different mounting media should be used and for prevention of samples drying up, a seal should be added to coverslips (clear nail polish being one alternative). The above suggested alkaline phosphatase assay and staining with Alizarin red and Oil red will further aid in confirming cell differentiation.
In summarizing the results, this study has led to successful isolation of viable cells from the periodontal ligament of healthy teeth following orthodontically indicated extractions. Following isolation, cells were maintained in cultures and were passaged up to 8 generations. Cell characterization resulted in partial fulfillment of the uniform criteria for defining cells as MSCs as suggested and published by ISCT. The observed results were as following:
1. Cells were cultured under standard conditions adhering to plastic vessels.
2. As measured by flow cytometry, >95% of the cell population expressed CD73 and CD90.
3. Cells lacked expression of CD45, CD34, CD11b, CD19 and HLA-DR (<2% positive).
4. Under standard in vitro conditions, cells were able to differentiate to osteoblasts and adipocytes as was shown by phenotypic changes under phase contrast microscopy. With the majority of the criteria fulfilled in addition to positive expression of CD44, it seems the identity of the cells was suggestive of being mesenchymal stem cells. Except for the chondrogenic differentiation which has not yet been attempted, the details lacking for complete fulfillment of criteria for defining cells as MSCs seem to be related to experimental challenges which can be addressed by troubleshooting existing protocols. As discussed earlier these details include showing >95% expression of CD105 as well as verification of differentiation of cells to osteoblasts and adipocytes by immunohistochemistry.
Conclusion:
This study has resulted in describing a method of isolating and characterizing cells from the periodontal ligament. Being able to non-invasively isolate mesenchymal stem cells from healthy teeth extracted for orthodontic reasons provides a valuable resource. This source of cells provides an excellent tool for future studies involving many areas which may be applicable to clinical situations in the field of dentistry.
Future studies:
This work will continue, repeating all experiments and implementing suggestive changes as mentioned above in the discussion. Once, technical issues are resolved and the
27
criteria for characterizing mesenchymal stem cells as suggested by the ISCT has been fulfilled, there are plans to proceed with studies involving regeneration.
Ethical consideration:
Participation in this study carried no additional risks to study subjects as it strictly involved donating teeth extracted as part of orthodontic treatment. In executing the study, there was no conflict of interest as treatment planning was done exclusively by the treating orthodontists who were not in any way linked to the study. The individual gain of participating in this study gave no immediate personal benefits to study subjects other than the satisfaction of having contributed to research; donating teeth which would otherwise have been discarded. On a grander scale, the societal impact of this study is valuable as this non-invasive source of cells can lead to future discoveries potentially benefitting members of the greater society. With this, participants may in the future seek personal benefit from results of additional studies involving mesenchymal stem cells isolated from the periodontal ligament.
Acknowledgements:
Gratitude goes out to my advisor Andreas Stavropoulos for enabling this work by providing the facilities and financial support needed for completion. Special thanks to Rainde Rezende and Reham Albabtain for valuable scientific discussions regarding the study and for practical assistance with everything from ordering of reagents to organizing maintenance and repair of equipment. Many thanks to Corrado Cilio and Jeanette Arvastsson at the Clinical Research Center at Skåne Univerity Hospital for excellent assistance with the flow cytometry part of this project. Thanks to Orthodontists both at the outside clinic in Malmö and at Tandvårdshögskolan who allowed access to their patient pools.
Most of all, thanks to my family, especially my three amazing children who patiently shared their parental time with the stem cells and never complained when research related work led to many late evenings in the lab. Being your mom is my greatest achievement in life and I love you so very much.