Developing Rating Curves for Bedrock Step-Pool Rivers using Sparse
Data
Kevin L. Stuart and Steven H. Emerman
1Department of Earth Science, Utah Valley University, Orem, Utah
Abstract. The objective of this study was to investigate the possibility of a generic rating curve
with a small number of adjustable parameters for the restricted class of bedrock step-pool rivers.
The motivation for this study arose from Utah Valley University’s long-term program of
groundwater development in the Trans-Mexican Volcanic Belt, which requires hydrographs for
bedrock step-pool rivers near remote mountain villages. Based upon personal communications
from USGS state hydrologists and Google Earth satellite images and aerial photos, 71 USGS active
or historic gaging sites were identified as bedrock step-pool rivers, involving 403 rating numbers
and 13,409 gage height vs. discharge measurements. For comparison, 71 gaging sites were chosen
randomly, involving 268 rating numbers and 7617 gage height vs. discharge measurements. As the
distributions of gage heights and discharges were a good fit to a lognormal distribution, the data
were normalized by computing the Z-scores of the logarithms of discharge and gage height, in
which the average and standard deviation were computed separately for each rating number. The
linear relationships between Z-scores of gage height (y-axis) and discharge (x-axis) were
surprisingly similar for bedrock step-pool and random rivers. For bedrock step-pool rivers, the
slope was 0.8829 with R
2= 0.78, while for random rivers, the slope was 0.8467 with R
2= 0.72.
Numerical experiments on generating rating curves based on two random measurements for each
rating number showed that 50% of all observed discharges deviated from predicted discharges by
less than 31.0% for bedrock step-pool rivers and 27.3% for random rivers.
1. Introduction
A rating curve is an empirical relationship between stream discharge and gage height
that is used to derive a hydrograph from a record of gage height. The conventional practice
is to develop a rating curve from multiple paired measurements of discharge and gage
height. The objective of this study was to investigate whether, for a sufficiently restricted
class of rivers, the vast database of existing gage height vs. discharge measurements might
be used to generate a generic rating curve with a small number of adjustable parameters so
as to reduce the number of measurements required for development of a rating curve at a
particular site. The chosen restricted class of rivers was that of bedrock step-pool rivers,
which are rivers that flow along a stair-like course that is cut into bedrock (Hayward 1980;
Wohl and Grodek 1994) (see Fig. 1). The motivation for this study arose from Utah Valley
University’s long-term program of groundwater development in the Trans-Mexican
Volcanic Belt, which requires hydrographs for bedrock step-pool rivers near remote
mountain villages.
1 Department of Earth Science
Utah Valley University Orem, Utah 84058 Tel: (801)863-6864 e-mail: StevenE@uvu.edu
Figure 1. The South Fork of Mill Creek is a typical bedrock step-pool river near Moab in southern
Utah.
Most recent work on rating curves has involved the development of rating curves based
on channel geometry without any gage height vs. discharge measurements (Bailey 1966;
Drus 1982; Davidian 1984; Jarrett and Malde 1987; Di Giammarco et al. 1998; Wilson et
al. 2002; Gergov and Karagiozova 2003; Kean and Smith 2005, 2010; Szilagyi et al. 2005;
Perumal et al. 2007, 2010; Smith et al. 2010), the use of parameters in addition to gage
height to predict discharge (Sahoo and Ray 2006; Sha 2007), the methodology and
accuracy of developing rating curves based on gage height vs. discharge measurements
(Dymond and Christian 1982; DeGagne et al. 1996; Clarke 1999; Peterson-Overleir 2004;
Peterson-Overleir and Reitan 2005; Jalbert et al. 2011) and the use of remote discharge
measurements to develop rating curves (Birkhead and James 1998). We are not aware of
any other work on reducing the number of gage height vs. discharge measurements
required to develop a rating curve based on the statistics of the existing gage height vs.
discharge database.
2. Methods
As the USGS has no systematic database of site descriptions or photos of stream
gaging sites, the primary source of information in identifying gaging sites on bedrock
step-pool rivers was the personal knowledge of the USGS state hydrologists in all 50 states.
This personal knowledge was supplemented by Google Earth satellite images and aerial
photos (see Fig. 2), Google Earth location photos, topographic relief and slope, and
surrounding geologic features (e.g., exposed bedrock formations that the river cut through).
The Google Earth satellite images and aerial photos were regarded as the least diagnostic
and in no case was a bedrock step-pool river identified by Google Earth satellite images or
aerial photos alone. A total of 71 active or historic stream gaging sites with records of gage
height vs. discharge measurements were identified as bedrock step-pool rivers (see Table
1). These 71 sites involved 403 rating numbers and 13,409 paired gage height – discharge
measurements (USGS 2012). (A rating number is the set of measurements used to develop
a rating curve. The USGS practice is that, when a measured discharge differs from the
discharge predicted by the rating curve by more than 10%, a new set of measurements is
begun to develop a new rating curve). For comparison, a random number generator was
used to select 71 random stream gaging sites involving 268 rating numbers and 7617
paired measurements.
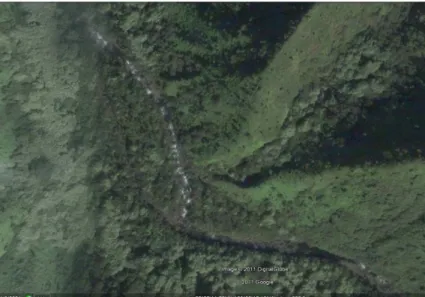
Figure 2. This Google Earth aerial photo is of a section of the Wainiha River of Kauai, Hawaii, just
northwest of gaging station 16108000 (see Table 1). This photo shows a bedrock step-pool section of river (left) and a calm section (right). Bedrock step-pool rivers were not identified by Google Earth satellite images and aerial photos alone, but only in conjunction with location photos and personal communication from USGS state hydrologists.
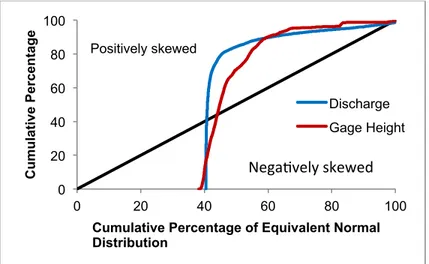
For both bedrock step-pool rivers and random rivers, the cumulative percentages of
both gage heights and discharges were plotted against the cumulative percentages of the
equivalent normal and lognormal distributions, based on the averages and standard
deviations of all gage heights and all discharges, respectively. In no case was the
distribution even remotely close to a normal distribution (see Figs. 3a-b). On the other
hand, the distribution of discharges for bedrock step-pool rivers and the distributions of
both gage heights and discharges for random rivers were nearly indistinguishable from the
equivalent lognormal distribution (see Figs. 4a-b). The distribution of gage heights for
bedrock step-pool rivers was reasonably close to a lognormal distribution (see Fig. 4a). On
that basis, all least-squares regression analysis was carried out on the logarithms of values,
rather than the values themselves.
For each measurement of gage height and discharge, the Z-scores were computed as
𝑍
!" !"=
ln 𝐺𝐻 − ln 𝐺𝐻
𝜎
!" !"(1)
𝑍
!" !=
ln 𝑄 − ln 𝑄
𝜎
!" !(2)
where GH is gage height, Q is discharge, σ is standard deviation and an overbar indicates
the mean. For each measurement, the mean and standard deviation used to compute the
Z-score was the mean and standard deviation of the set of measurements with the same rating
number for a given gaging site, so that, essentially, each rating number was regarded as a
distinct gaging site.
Figure 3a. For bedrock step-pool rivers, the distributions of discharges and gage heights are not
remotely close to a normal distribution.
Figure 3b. For randomly chosen rivers, the distributions of discharges and gage heights are not
remotely close to a normal distribution.
3. Results
The generic relationship between the Z-scores of the logarithms of gage height and
discharge is
𝑍
!" !"= 𝑎𝑍
!" !+ 𝑏
(3)
where a = 0.8828 for bedrock step-pool rivers, a = 0.8467 for rivers chosen randomly and
b = 0 in both cases. The fit is somewhat better for bedrock step-pool rivers (R
2= 0.78) than
for random rivers (R
2= 0.72) (see Figs. 5-6). Note that there is no justification for fitting a
curve any more complex than a straight line. The isolated points at the low and high
discharges are a very small fraction of the total number of points and exert essentially no
influence on the fit of the curve. It is quite surprising, first, that the generic rating curve for
0 20 40 60 80 100 0 20 40 60 80 100 C u m u la ti ve Pe rc en ta g e
Cumulative Percentage of Equivalent Normal Distribution Discharge Gage Height
Posi0vely skewed
Negatively skewed 0 20 40 60 80 100 0 20 40 60 80 100 C u m u la ti ve Pe rc en ta g eCumulative Percentage of Equivalent Normal Distribution
Discharge Gage Height Positively skewed
randomly chosen rivers is so good and, second, that the generic rating curve for
deliberately selected bedrock step-pool rivers is not significantly better.
Figure 4a. For bedrock step-pool rivers, the distribution of discharges is indistinguishable from a
lognormal distribution, while the distribution of gage heights is reasonably close to a lognormal distribution.
Figure 4b. For randomly chosen rivers, the distributions of both discharges and gage heights are
indistinguishable from a lognormal distribution.
4. Discussion
The empirical relationship in Eq. (4) seems to require the four adjustable parameters
ln 𝑄, σ
ln Q,ln 𝐺𝐻
,and σ
ln GH. However, the last two parameters can simply be determined
from the record of gage heights without any simultaneous measurements of discharge. In
fact, Utah Valley University’s program of groundwater development in the Trans-Mexican
Volcanic Belt involves organizing local residents to carry out daily measurements of
stream stage using meter sticks. Given that ln 𝐺𝐻
and σ
ln GHare known parameters, the two
adjustable parameters ln 𝑄 and σ
ln Qcan be determined from any two paired measurements
of gage height and discharge (GH
1, Q
1) and (GH
2,Q
2) by combining Eqs. (1) - (3) to yield
0 20 40 60 80 100 0 20 40 60 80 100 C u m u la ti ve Pe rc en ta g e
Cumulative Percentage of Equivalent Lognormal Distribution Discharge Gage Height Positively skewed Negatively skewed 0 20 40 60 80 100 0 20 40 60 80 100 C u m u la ti ve Pe rc en ta g e
Cumulative Percentage of Equivalent Lognormal Distribution
Discharge Gage Height Positively skewed
𝜎
!" != 𝑎𝜎
!" !"ln(𝑄
!/𝑄
!)
ln(𝐺𝐻
!/𝐺𝐻
!)
(4)
ln 𝑄 = ln 𝑄
!−
ln(𝑄
!/𝑄
!)
ln(𝐺𝐻
!/𝐺𝐻
!)
(ln 𝐺𝐻
!− ln 𝐺𝐻).
(5)
Figure 5. For bedrock step-pool rivers, there is a good linear relationship (R2 = 0.78) between the Z-score of the logarithm of discharge (Zln Q) and the Z-score of the logarithm of gage height (Zln GH).
Figure 6. For randomly chosen rivers, there is a good linear relationship (R2 = 0.72) between the Z-score of the logarithm of discharge (Zln Q) and the Z-score of the logarithm of gage height (Zln GH). The generic rating curves for bedrock step-pool rivers and randomly chosen rivers are
very similar.
Numerical experiments to evaluate the accuracy of the above procedure in predicting
discharge from gage height were carried out by using a random number generator to
choose two paired measurements of gage height and discharge for each rating number,
using Eqs. (4) – (5) to determine the adjustable parameters ln 𝑄
and σ
ln Qfor each rating
number, using Eqs. (1) – (2) to determine Z-scores, and then using Eq. (3) to predict
discharge from each of 13,409 measurements of gage height for bedrock step-pool rivers
y = 0.8828x R² = 0.78 N = 13,409 -6 -5 -4 -3 -2 -1 0 1 2 3 4 5 6 -6 -5 -4 -3 -2 -1 0 1 2 3 4 5 6 Zln GH Zln Q y = 0.8467x R² = 0.72 N = 7617 -6 -5 -4 -3 -2 -1 0 1 2 3 4 5 6 -6 -5 -4 -3 -2 -1 0 1 2 3 4 5 6 Zln GH Zln Q
and 7617 measurements of gage height for random rivers, with the parameter a chosen as a
= 0.8828 for bedrock step-pool rivers and a = 0.8467 for rivers chosen randomly. The
percent deviation was calculated as
Percent Deviation = 100×
𝑄
!"#$− 𝑄
!"#𝑄
!"#$(6)
where Q
predis predicted discharge and Q
obsis observed discharge. Based on the numerical
experiments, 50% of all observed discharges deviated from predicted discharges by less
than 31.0% for bedrock step-pool rivers and 27.3% for random rivers. The percentage of
observed discharges that differed from predicted discharges by less than a factor of two
(percent deviation = 100% when Q
obs= 2Q
pred) was 86.5% for bedrock step-pool rivers and
89.0% for random rivers. The percentage of observed discharges that differed from
predicted discharges by less than an order of magnitude (percent deviation = 900% when
Q
obs= 100Q
pred) was 98.1% for bedrock step-pool rivers and 99.2% for random rivers (see
Fig. 7). The procedure performed slightly better for rivers chosen randomly than for
deliberately chosen bedrock step-pool rivers.
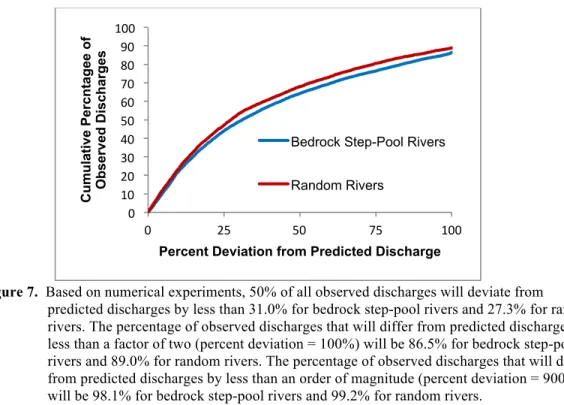
Figure 7. Based on numerical experiments, 50% of all observed discharges will deviate from
predicted discharges by less than 31.0% for bedrock step-pool rivers and 27.3% for random rivers. The percentage of observed discharges that will differ from predicted discharges by less than a factor of two (percent deviation = 100%) will be 86.5% for bedrock step-pool rivers and 89.0% for random rivers. The percentage of observed discharges that will differ from predicted discharges by less than an order of magnitude (percent deviation = 900%) will be 98.1% for bedrock step-pool rivers and 99.2% for random rivers.
5. Conclusions
The first surprising result of this study was that there is a reasonably good generic
rating curve for all rivers, which does not seem to have been previously reported. This
generic rating curve could be used in any situation for which errors in predicted discharge
of less than about 30% are acceptable. The second surprising result was that deliberating
choosing rivers of a given type, in this case, bedrock step-pool rivers, did not produce a
generic rating curve that was significantly different from or more accurate than the generic
rating curve for random rivers. The question as to how to do choose a sufficiently
0 10 20 30 40 50 60 70 80 90 100 0 25 50 75 100 C u m u la ti ve Pe rc n ta g ee o f Observed Discharges
Percent Deviation from Predicted Discharge
Bedrock Step-Pool Rivers Random Rivers
restricted class of rivers such that those rivers will have an accurate generic rating curve
remains open.
Appendix: Catalog of Bedrock Step-Pool Rivers.
Table 1. Catalog of bedrock step-pool rivers with USGS gaging stations.
State Site Number* Site Name
AL 02398950 WEST FORK LITTLE R AT DESOTO PARK NR FORT PAYNE AL
AL 02399200 LITTLE RIVER NEAR BLUE POND AL AZ 09505200 WET BEAVER CREEK NEAR RIMROCK, AZ
CA 11433040* PILOT C BL MUTTON CANYON NR GEORGETOWN CA CA 11201850* NF OF MF TULE R BL DOYLE SP DIV NR
SPRINGVILLE
CA 11202000* NF OF MF TULE R NR SPRINGVILLE(RIVER ONLY) CA CA 11206500* MF KAWEAH R NR POTWISHA CAMP(RIVER ONLY)
CA
CA 11208000* MARBLE F KAWEAH R (R ONLY) A POTWISHA CAMP CA
CA 11208600* KAWEAH R BL CONDUIT NO. 2 NR HAMMOND CA CA 11208730* EF KAWEAH R NR THREE RIVERS CA
CA 11209900* KAWEAH R A THREE RIVERS CA
CA 11274790 TUOLUMNE R A GRAND CYN OF TUOLUMNE AB HETCH HETCHY
CA 11281000* SF TUOLUMNE R NR OAKLAND RECREATION CAMP CA
CA 11283250* CLAVEY R NR LONG BARN CA
CA 11293650* NF STANISLAUS R A CAMP WOLFEBORO NR BIG MEADOWS CA
HI 16108000 Wainiha River nr Hanalei, Kauai, HI HI 16501200 Oheo Gulch at dam near Kipahulu, Maui, HI HI 16552800 Waikamoi Str abv Kula Pl intake nr Olinda, Maui,HI HI 16704000 Wailuku River at Piihonua, HI
HI 16770500 Paauau Gulch at Pahala, HI
ME 01021200 Dennys River at Dennysville, Maine
ME 01030500 Mattawamkeag River near Mattawamkeag, Maine ME 01031450 Kingsbury Stream at Abbot Village, Maine ME 01052500 Diamond River near Wentworth Location, NH ME 01055000 Swift River near Roxbury, Maine
MI 04043150 SILVER RIVER NEAR L'ANSE, MI
MN 04010500 PIGEON RIVER AT MIDDLE FALLS NR GRAND PORTAGE MN
MN 05336700 KETTLE RIVER BELOW SANDSTONE, MN MN 05129115 VERMILION RIVER NR CRANE LAKE, MN
MN 05126210 SOUTH KAWISHIWI R ABV WHITE IRON LAKE NR ELY, MN
NV 10324500 ROCK CK NR BATTLE MOUNTAIN, NV NV 10310400 DAGGETT CK NR GENOA, NV
NH 01064300* ELLIS RIVER NEAR JACKSON, NH
NH 01064400* LUCY BROOK NEAR NORTH CONWAY, NH NH 01075800* STEVENS BROOK NEAR WENTWORTH, NH NJ 01461300 Wickecheoke Creek at Stockton NJ
OH 04197170 Rock Creek at Tiffin OH OH 04197137 Sandusky River at Tiffin OH OH 04196800 Tymochtee Creek at Crawford OH OK 07332390 Blue River near Connerville, OK
OR 14101500* WHITE RIVER BELOW TYGH VALLEY,OREG
PA 04213152 Walnut Creek Upstream Pool, near Erie, PA PA 04213075 Brandy Run near Girard, PA
TX 07311600 N Wichita Rv nr Paducah, TX TX 08049580 Mountain Ck nr Venus, TX TX 08055000 Denton Ck nr Grapevine, TX TX 08084000 Clear Fk Brazos Rv at Nugent, TX TX 08091500 Paluxy Rv at Glen Rose, TX TX 08095000 N Bosque Rv nr Clifton, TX TX 08101000 Cowhouse Ck at Pidcoke, TX TX 08103800 Lampasas Rv nr Kempner, TX TX 08105100* Berry Ck nr Georgetown, TX TX 08143600 Pecan Bayou nr Mullin, TX TX 08144600 San Saba Rv nr Brady, TX
TX 08168797 Dry Comal Ck at Loop 337 nr New Braunfels, TX TX 08181400 Helotes Ck at Helotes, TX
TX 08183500 San Antonio Rv nr Falls City, TX TX 08185000 Cibolo Ck at Selma, TX
TX 08192000 Nueces Rv bl Uvalde, TX
TX 08197500 Frio Rv bl Dry Frio Rv nr Uvalde, TX TX 08200977 Middle Verde Ck at SH 173 nr Bandera, TX TX 08201500 Seco Ck at Miller Rh nr Utopia, TX
TX 08202700 Seco Ck at Rowe Rh nr D'Hanis, TX TX 08206600 Frio Rv at Tilden, TX
TX 08211200 Nueces Rv at Bluntzer, TX
UT 09183000* COURTHOUSE WASH NEAR MOAB, UTAH UT 09184000* MILL CREEK NEAR MOAB, UT
WA 12448000 CHEWUCH RIVER AT WINTHROP, WA WA 12104500 GREEN RIVER NEAR LESTER, WA
WA 12185300 ELLIOTT CR AT GOAT LAKE OUTLET NR MONTE CRISTO, WA
* indicates station is longer active but historical records are available
Acknowledgements. This research was partially supported by a Student Scholarly and Creative
Opportunities Program (SCOP) grant from Utah Valley University. We are very grateful to the many USGS hydrologists who shared personal knowledge, especially Robert Jarrett.
References
Bailey, J. F., 1966: Definition of stage-discharge relation in natural channels by step-backwater analysis. U.S. Geological Survey Water-Supply Paper 1369-A, 24 p.
Birkhead, A. L., and C. S. James, 1998: Synthesis of rating curves from local stage and remote discharge monitoring using nonlinear Muskingum routing. Journal of Hydrology, 205, 52-65.
Clarke, R. T., 1999: Uncertainty in the estimation of mean annual flood due to rating-curve indefinition. Journal of Hydrology, 222, 185-190.
Davidian, J., 1984: Computation of water-surface profiles in open channels. U.S. Geological Survey Techniques of Water-Resources Investigations, Book 3, Chap. A15, 48 p.
DeGagne, M. P. J., C. G. Douglas, H. R. Hudson, and S. P. Simonovic, 1996: A decision support system for the analysis and use of stage-discharge rating curves. Journal of Hydrology, 184, 225-241.
Di Giammarco, P., M. Franchini, and P. Lamberti, 1998: The construction of the rating curve in river cross sections by using level data and a parametrized formulation of the Saint Venant equations. In 23rd
General Assembly of the European Geophysical Society: Hydrology, Oceans & Atmosphere. Gauthier-Villars, p. 497.
Drus, S. A., 1982: Verification of step-backwater computations on ephemeral streams in northeastern Wyoming. U.S. Geological Survey Water-Supply Paper 2199, 12 p.
Dymond, J. R., and R. Christian, 1982: Accuracy of discharge determined from a rating curve. Hydrological Sciences Journal, 27, 493-504.
Gergov, G., and T. Karagiozova, 2003: Unique discharge rating curve based on the morphology parameter Z. In Hydrology of Mediterranean and Semiarid Regions, E. Servat, W. Najem, C. Leduc, and A. Shakeel (eds.). IAHS-AISH Publication, 278, 3-8.
Hayward, J. A., 1980: Hydrology and stream sediments from Torlesse stream catchment. Tussock Grasslands and Mountain Lands Institute Special Publication 17, 236 p.
Jalbert, J., T. Mathevet, and A.-C. Favre, 2011: Temporal uncertainty estimation of discharges from rating curves using a variographic analysis. Journal of Hydrology, 397, 83-92.
Jarrett, R. D., and H. E. Malde, 1987: Paleodischarge of the late Pleistocene Bonneville Flood, Snake River, Idaho, computed from new evidence. Geological Society of America Bulletin, 99, 127-134.
Kean, J. W., 2004: Calculation of stage-discharge relations for gravel bedded channels. Journal of Geophysical Research, 115, doi:10.1029/2009JF001398.
Kean, J. W., and J. D. Smith, 2005: Generation and verification of theoretical rating curves in the Whitewater River basin, Kansas. Journal of Geophysical Research, 110, doi:10.1029/2004JF000250. Perumal, M., T. Moramarco, B. Sahoo, and S. Barbetta, 2007: A methodology for discharge estimation and
rating curve development at ungauged river sites. Water Resources Research, 43, doi:10.1029/2005WR004609.
Perumal, M., T. Moramarco, B. Sahoo, and S. Barbetta, 2010: On the practical applicability of the VPMS routing method for rating curve development at ungauged river sites. Water Resources Research, 46, doi:10.1029/2009WR008103.
Peterson-Overleir, A., 2004: Accounting for heteroscedasticity in rating curve estimates. Journal of Hydrology, 292, 173-181.
Peterson-Overleir, A., 2005: Objective segmentation in compound rating curves. Journal of Hydrology,
311, 188-201.
Sahoo, G. B., and C. Ray, 2006: Flow forecasting for a Hawaii stream using rating curves and neural networks. Journal of Hydrology, 317, 63-80.
Sha, W., 2007: Flow forecasting for a Hawaii stream using rating curves and neural networks; discussion. Journal of Hydrology, 340, 119-121.
Smith, C. F., J. T. Cordova, and S. M. Wiele, 2010: The continuous slope-area method for computing event hydrographs. Scientific Investigations Report, 2010, U. S. Geological Survey, 37 p.
Szilagyi, J., G. Balint, B. Gauzer, and P. Bartha, 2005: Flow routing with unknown rating curves using a state-space reservoir-cascade-type formulation. Journal of Hydrology, 311, 219-229.
USGS, 2012: National Water Information System: Web Interface. Available online at http://waterdata.usgs.gov/nwis.
Wilson, C. A. M. E., P. D. Bates, and J. M. Hervouet, 2002: Comparison of turbulence models for stage-discharge rating curve prediction in reach-scale compound channel flows using two-dimensional finite element methods. Journal of Hydrology, 257, 42-58.
Wohl, E. E., and T. Grodek, 1994: Channel bed-steps along Nahal Yael, Negev desert, Israel. Geomorphology, 6, 99-110.