Desiccation of Porous Media: Intermediate-Scale Flow Cell Experiments
and Numerical Simulations
M. Oostrom1
Hydrology Group, Energy and Environment Directorate, Pacific Northwest National Laboratory, Richland, WA
T.W. Wietsma, M.A. Covert2
Environmental Molecular Sciences Laboratory, Pacific Northwest National Laboratory, Richland, WA
T.E. Queen1
Hydrology Group, Energy and Environment Directorate, Pacific Northwest National Laboratory, Richland, WA
Abstract. Soil desiccation is recognized as a potentially robust remediation process for the deep vadose zone. Before this technique can be deployed, several techniques issues need to addressed. In this paper, two experiments are described addressing the issue of potential energy limitations to re-duce soil moisture. The experiments are conducted in wedge-shaped, intermediate-scale flow cells. The experiment in the homogeneous porous medium showed a maximum evaporative cooling of ~10o C and a rapid decrease in relative humidity when the drying front passed. In the
heterogene-ous experiments, the fine-grained sand dried considerably slower than the medium-grained sand and showed two local minima. The first minimum is associated with cooling due to evaporation in the adjacent medium grained sand and the second minimum with cooling the find-grained sand it-self. The STOMP simulator was able to simulate desiccation and the associated thermal behavior well in both experiments. The good match for both temperature and relative humidity data shows that the STOMP simulator is using appropriate conservation equations and constitutive relations to describe the experimental observations.
1. Introduction
Soil desiccation is recognized as a potentially robust remediation process for the deep vadose zone because it is based on a physical phenomena, i.e., evaporation, that can be in-duced by air injection and extraction. The basic premise of the soil-desiccation technology is to inject dry air, accompanied by the withdrawal of an equal volume of wet air in an ar-ray of wells. In combination with surface flux control, the technique can be used to immo-bilize contamination by reducing the aqueous-phase permeability.
1 Hydrology Group, Energy and Environment Directorate Pacific Northwest National Laboratory
Richland, WA 99352 Tel: (509) 372-6044
e-mail: mart.oostrom@pnl.gov 2
Environmental Molecular Sciences Laboratory Pacific Northwest National Laboratory
Richland, WA 99352 Tel: (509) 371-6200
In 2005, a scientific panel was tasked with assessing the most viable and practical ap-proach for deep vadose zone treatment at the Hanford Site, to supplement engineered bar-riers and to make recommendations for testing. The panel concluded that soil desiccation, in addition to surface infiltration control, could be applied for deep vadose zone conditions (Geomatrix Consultants, Inc. 2005). However, they identified a number of knowledge gaps that would need to be overcome before this technology could be deployed. These in-cluded 1) energy limitations on the volume of water that can be removed, 2) osmotic ef-fects during soil drying, and 3) potential remobilization of contaminants after cessation of desiccation.
The first concern is related to the relatively large amount of energy that is needed to evaporate water (2500 joules/gram). This energy has to be provided by the injected air and/or the subsurface conducting the air. Without considering energy transfer, the amount of water that can potentially be removed per unit volume of air is the difference between the saturated water-vapor density and the water-vapor density of the injected dry air at a certain temperature.
However, since energy has to be provided for water evaporation, it is more likely that water-vapor saturation will take place at the lower wet-bulb temperature, yielding a lower saturated water-vapor density. For example, the saturated water-vapor density of 20oC air is 19 g/m3. However, the density at the wet-bulb temperature of 5.5oC is only 7 g/m3. The considerable difference between these two numbers results in a potential slower water re-moval when energy effects are considered. The panel recommended that the effects should be quantified in laboratory experiments, including experiments with elevated air tempera-tures to minimize energy-balance issues.
The second concern raised by the panel relates to potential osmotic effects since lower vapor pressures will occur in zones of increased salt concentrations. Research by Ward et al. (2001) indicates that the fine-textured, low-permeability interbeds in the Hanford for-mation may act to restrict solute transport relative to the flow of water. The panel’s third concern relates to the remobilization of high-concentration solutes after rewetting. Rewet-ting and remobilization may result in (temporary) increased concentrations and contami-nant mass fluxes.
Soil desiccation has, to our knowledge, not been applied in the laboratory and the field as a method to immobilize contaminants in the unsaturated zone. One of the three knowl-edge gaps identified by the expert panel was a need for focused laboratory experiments to demonstrate the technique and to address technical concerns related to the energy balance and osmotic effects (Geomatrix Consultants Inc., 2005). In response to these needs, a se-ries of intermediate scale flow cell experiments were designed and conducted as a first step in quantifying how the energy balance impacts the ability of desiccation to limit the
downward migration of contaminants as driven by water infiltration. The objectives of this series of experiments were 1) to demonstrate the desiccation process at the intermediate scale, 2) to develop an initial temperature and relative humidity data set, and 3) to test and verify the water-air-energy mode of the STOMP simulator (White and Oostrom, 2006).
2. Methods
2.1. Experiments
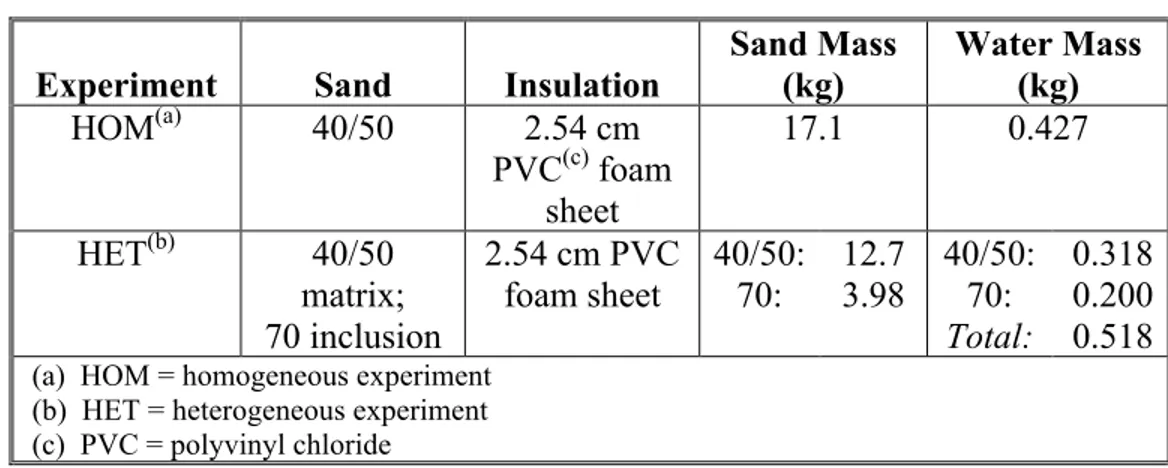
Two experiments, one in homogeneous and one in a heterogeneous porous medium, were conducted in a wedge-shaped intermediate-scale flow cell. Details of the experi-ments are presented in Table 1. Schematics of the flow cell for the homogenous and het-erogeneous experiments are shown in Figure.
Table 1. Overview of flow-cell experiments. In all experiments, 22oC air was injected with a
rate of 2 L/min.
Experiment Sand Insulation
Sand Mass (kg) Water Mass (kg) HOM(a) 40/50 2.54 cm PVC(c) foam sheet 17.1 0.427 HET(b) 40/50 matrix; 70 inclusion 2.54 cm PVC foam sheet 40/50: 70: 12.7 3.98 40/50: 70: Total: 0.318 0.200 0.518 (a) HOM = homogeneous experiment
(b) HET = heterogeneous experiment (c) PVC = polyvinyl chloride
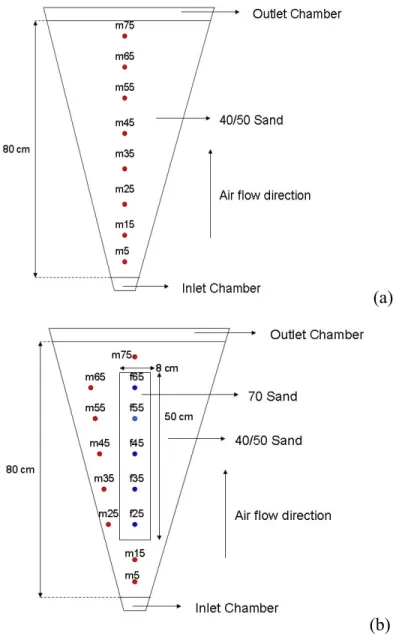
The medium-grained 40/50-mesh and fine-grained 70-mesh Accusands were obtained from the Unimin Corporation (Le Sueur, MN). Properties of the sand are given by Schroth et al. (1996). The flow-cell had a wedge angle of 20 degrees, with an internal thickness of 6.25 cm. The flow cell was packed with 80 cm of moist porous media, occupying a volume of 9.425 L. The 40/50-mesh and 70-mesh sands were mixed with 25 g and 50 g water per kg, respectively. In both experiments, air was injected with a constant rate of 2 L/min at 22oC. The temperature and relative humidity were measured with Precon sensors (Kele Company, Memphis, TN). The probes were calibrated at relative humidity values of 0 and 100%. In experiment HOM, eight probes were installed with an internal distance of 10 cm (m5, m15, m25, m35, m45, m55, m65, and m75). The number in the probe name indicates the distance from the gas inlet chamber. In the heterogeneous experiment, eight probes were located in the medium-grained sand (m5, m15, m25, m35, m45, m55, m65, and m75) and five probes in the fine-grained sand (f25, f35, f45, f55, and f65). The out-flowing air was channeled through a PVC-foam wedge placed on top of the flow cell.
(a)
(b)
Figure 1. Schematic of wedge-shaped flow cell used for the (a) homogenous-porous media ex-periment (HOM) with 40/50 mesh Accusand, and (b) heterogeneous exex-periment (HET). The red dots indicate the locations of the temperature/humidity probes (m5, m15, m25, m35, m45, m55, m65, and m75) in the medium-grained sand. The blue dots indicate the locations of the temperature/humidity probes (f25, f35, f45, f55, and f65) in the fine-grained sand.
2.1. Numerical Simulations
The experiments were simulated with the standard version of the water-air-energy mode of the STOMP simulator (White and Oostrom, 2006). The configuration of the het-erogeneous experiments requires the use of a three-dimensional model. Since the experi-ments are symmetric in the horizontal x- and y-directions, only one quarter of the total ex-perimental domain was modeled. To evaluate the effect of the insulation material, both the polycarbonate flow cell wall and the PVC foam sheet were explicitly included in the model as porous media (Table 2). For this model configuration, boundary conditions for the three
equations were needed at the bottom, top, and the front side of the flow cell. For all other boundaries (back, west, and east sides), zero flux conditions were imposed. For the energy equation, the incoming dry air and the wall temperature were assumed to be at 22oC. An outflow boundary condition was imposed at the top of the porous medium. For the in-jected air, a constant flux (Neumann) boundary condition was used at the bottom by divid-ing the injection rate by the cross-sectional area, and a constant (atmospheric) pressure was maintained at the top and side of the flow cell. No water was allowed to be transported across the boundaries. The porous media, with a modeled thickness of 6.25 / 2 = 3.125 cm, were discretized into cells with dimensions of 0.5 × 1.0416 × 1.0 cm in the x, y, and z direction, respectively. The polycarbonate wall and PVC insulation were discretized into three cells per material. The porous medium and thermal properties of the sands and wall materials are listed in Table 2. The thermal properties of the sands were obtained using a KD2 thermal properties analyzer (Decagon Devices, Inc., Pullman, WA). The thermal properties of the polycarbonate and PVC were obtained from the manufacturer (McMaster-Carr, Los Angeles, CA). A relation from Somerton et al. (1974) was used to compute the thermal conductivity as a function of water saturation. The hydraulic properties of the polycarbonate and PVC foam were chosen to avoid any air or water movement in these materials.
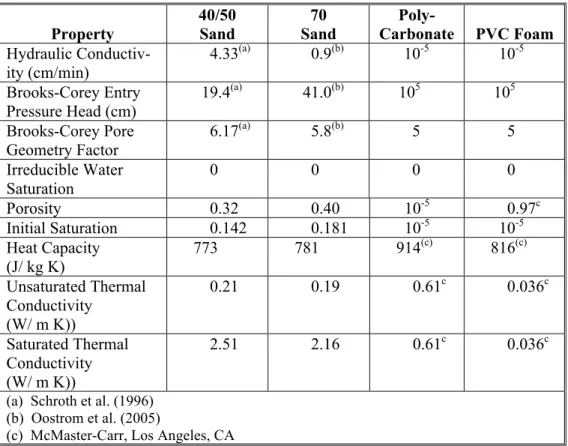
Table 2 Hydraulic and thermal properties of the sand, wall, and insulation material. Property 40/50 Sand 70 Sand Poly-Carbonate PVC Foam Hydraulic Conductiv-ity (cm/min) 4.33(a) 0.9(b) 10-5 10-5 Brooks-Corey Entry Pressure Head (cm) 19.4(a) 41.0(b) 105 105 Brooks-Corey Pore Geometry Factor 6.17(a) 5.8(b) 5 5 Irreducible Water Saturation 0 0 0 0 Porosity 0.32 0.40 10-5 0.97c Initial Saturation 0.142 0.181 10-5 10-5 Heat Capacity (J/ kg K) 773 781 914(c) 816(c) Unsaturated Thermal Conductivity (W/ m K)) 0.21 0.19 0.61c 0.036c Saturated Thermal Conductivity (W/ m K)) 2.51 2.16 0.61c 0.036c
(a) Schroth et al. (1996) (b) Oostrom et al. (2005)
3. Results
3.1. Homogeneous Experiment
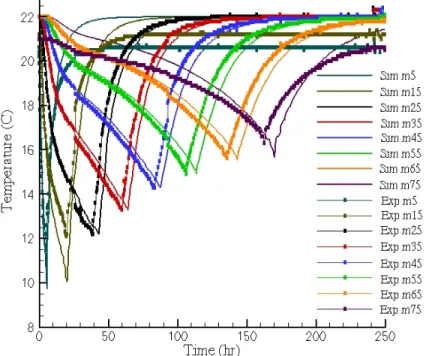
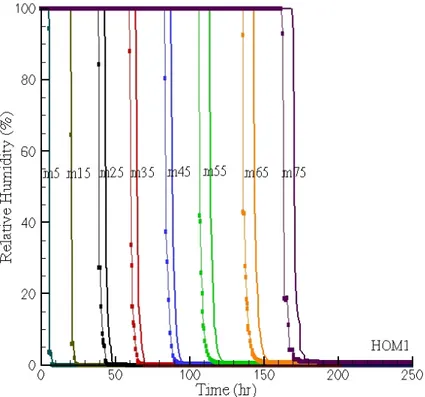
Observed and simulated temperatures and relative humidity as a function of time for all probes are shown in Fig. 2 and Fig. 3, respectively. Fig. 2 shows that the predicted tem-perature values match the experimental results well, although the predicted values closest to the inlet chamber (at locations m5 and m15) show more cooling than the observed tem-peratures. The simulated values indicate a cooling down to ~10oC, while the observed val-ues were not smaller than ~12oC. The cooling decreased with increased distance from the inlet chamber. This result is related to the decreased air velocity and heat transport through the insulation and the wall into the porous medium. Differences between the temperatures at the various locations at the end of the experiment are artifacts of the PreCon temperature probes. Both the experiment and the simulation showed a rapid decrease in relative hu-midity when the drying front passed. For all locations, the experimental drying fronts ar-rived a few hours earlier than the predicted fronts, which is reasonable given the duration of the experiment. The water in the flow cell was completely removed after 10 days of desiccation. Consistent with theory, the timing of the minimum temperatures coincide with the passage of the drying fronts.
Figure 3. Observed (symbols) and Simulated Relative Humidity (solid lines) for Experiment HOM.
3.2. Heterogeneous Experiment
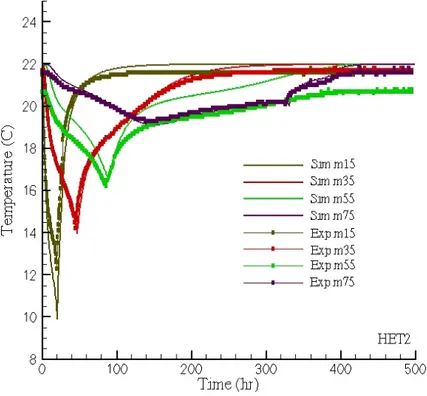
The observed and simulated temperatures for HET2 are shown in Fig. 4 and Fig. 5 for selected locations in the medium-grained and fine-grained sand, respectively. The relative humidity results are shown in Fig. 6 for the locations in the medium-grained sand and in Fig. 7 for all locations in the fine-grained sand. Temperature and relative humidity com-parisons for the probes in the medium- and fine-grained sand at z = 35 cm are depicted in Fig. 8. Similar to experiment HOM, the temperature results for experiment HET show the most pronounced evaporative cooling near the inlet (Fig. 4). In the medium grained sand, the observed cooling resulted in a minimum temperature of approximately 12oC at 5 cm from the inlet, with gradually less cooling for a minimum temperature of ~20oC at 5 cm from the upper boundary.
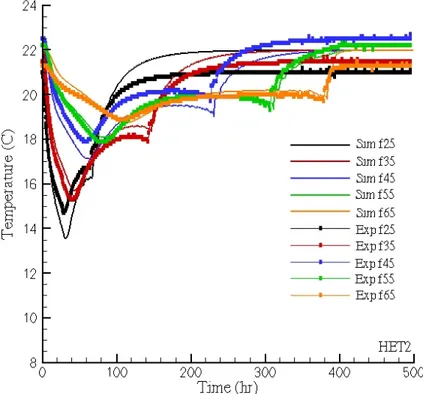
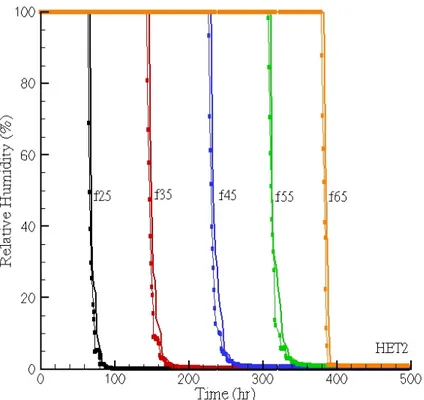
The temperature plots for the fine-grained sand show two local minima (Fig. 5). The first minimum is associated with the cooling due to evaporation in the adjacent medium-grained sand. The second minimum, which occurs later in time, is correlated with the evaporative cooling in the fine-grained sand itself. The cause of these cooling trends can be derived from relative-humidity plots, shown in Fig. 5 and Fig. 6 for the probes in the medium- and fine-grained sands. The first minimum occurred when the relative humidity in the medium-grained sand started to decrease, while the second minimum occurred when the relative humidity in the grained sand decreased. The relative humidity in the fine-grained sand dropped relatively fast from 100 to 0% when the drying front passed by. The relative humidity decrease in the medium-grained sand was fast from 100 to about 30%, but slowed down considerably after that (Fig. 5). The long tailing period of decreasing relative humidity is the result of water vapor moving into the medium-grained sand from
the fine-grained sand, after the medium-grained sand had been desiccated. Although the water in the medium-sand disappeared before the water saturations started to decrease in the fine-grained sand, the relative humidity in the medium-grained sand was affected for a considerable time because of the continued desiccation in the fine-grained sand. In gen-eral, the predicted time for the decrease in relative humidity in the medium-grained sand, when the fine-grained sand is desiccated, is typically longer than was observed in the ex-periments. Fig. 7, showing comparisons in relative humidity and temperature between ad-jacent probes at z = 35 cm, indicates an increasing time lag in desiccation between the me-dium- and fine-grained sand with increasing distance from the inlet.
Figure 4. Observed (symbols) and simulated temperature (solid lines) at locations m15, m35, m55, and m75.
Figure 5. Observed (symbols) and simulated temperature (solid lines) at the locations in the fine-grained sand.
Figure 6 Observed (symbols) and simulated relative humidity (solid lines) at locations m15, m35, m55, and m75.
Figure 7. Observed (symbols) and simulated relative humidity (solid lines) at the locations in the fine-grained sand.
4. Conclusions
The experiment in the homogeneous porous medium showed a maximum evaporative cooling of ~10o C and a rapid decrease in relative humidity when the drying front passed. In the heterogeneous experiments, the fine-grained sand dried considerably slower than the medium-grained sand and showed two local minima. The first minimum is associated with cooling due to evaporation in the adjacent medium grained sand and the second minimum with cooling the find-grained sand itself. Although some minor differences were observed, the presented results clearly demonstrate that the STOMP water-air-energy mode was able to simulate desiccation and the associated thermal behavior well in both homogeneous and relatively simple heterogeneous systems. The numerical results were obtained using inde-pendently determined hydraulic and thermal properties. The good match for both tempera-ture and relative humidity data shows that the STOMP simulator is using appropriate con-servation equations and constitutive relations to describe the experimental obcon-servations.
.
Acknowledgements. This study was performed under support provided by Pacific Northwest Na-tional Laboratory (PNNL) through the Laboratory Directed Research and Development (LDRD) program. PNNL is operated by the Battelle Memorial Institute for the Department of Energy (DOE) under Contract DE-AC06-76RLO 1830. The intermediate-scale experiments were
performed in the Environmental Molecular Sciences Laboratory (EMSL), a national scientific user facility sponsored by the DOE's Office of Biological and Environmental Research and located at PNNL. Scientists interested in conducting experimental work in the EMSL are encouraged to contact M. Oostrom (mart.oostrom@pnl.gov).
References
Geomatrix Consultants, Inc. 2005. Evaluation of Vadose Zone Treatment Technologies to
Immo-bilize Technetium-99 at Department of Energy Hanford Site, Richland, Washington. Denver,
CO.
Schroth, M.H., Ahearn, S.J., Selker, J.S., Istok, J.D., 1996. Characterization of miller-similar silica sands for laboratory hydrologic studies. Soil Sci. Am. J., 60, 1331-1339.
Ward AL, GW Gee, JS Selker, and C Cooper. 2001. Rapid Migration of Radionuclides Leaked
from High-Level Water Tanks: A Study of Salinity Gradients, Wetted Path Geometry, and Wa-ter Vapor Transport. Project 65410, Final Report, Environmental Management Science
Pro-gram, U.S. Department of Energy.
White, M.D., M. Oostrom, M., 2006. STOMP Subsurface Transport Over Multiple Phases, Version 4.0, User’s Guide, PNNL-15782, Pacific Northwest National Laboratory, Richland, Washing-ton.