Engineering design parameters of storms in Venezuela
12
0
0
Full text
(2) Guevara. The storm advancement coefficient is a good tool to represent the design storm distribution pattern to be used in connection with the Intensity Duration Frequency analysis (IDF) to estimate the magnitude of the rainfall design parameter of any hydraulic project. Area reduction factors can be estimated from Area - Depth – Duration curves. This research deals with estimations for Venezuela of advancement coefficient r to be used for establishing storm pluviographs, modeling of Intensity- Duration- Frequency (IDF) curves that allow the estimation of peak rainfall/intensities for any duration and frequency; and estimation of area reduction factors to be used in small basins hydrologic projects.. 2. Theoretical Fundaments The storm advancement coefficient r (SAC) is defines as the ratio of the time before the peak ta to the total storm duration Td (Guevara and Cartaya, 1998; Guevara, 2000; Guevara, 2002 b): r = ta /Td. (1). The recession time tb is defined as the time from the peak to the end of the storm: tb =. Td - ta = (1 - r) Td. (2). Values of r = 0,50 mean that the peak rainfall intensity occurs in the middle of the storm. Values of r < 0.50 and r > 0.50 indicate that the peak happens earlier and later respectively; in the first case the storms are said to be from the advanced type and in the second case, the storms are from the retarded type. Knowing the total precipitation depth, P, in the hyetograph and the duration of the storm, Td (base length of the triangle), the intensity distribution of the storm can be adapted to a triangular shape and following relations can be established: P = Td h/2. (3). h = 2 P/ Td. (4). Where h is the high of the triangle. To get a reliable estimation of design hyetographs two methods are available: Alternative Block Method uses an IDF-Curve, specifying the precipitation depth occurring in n successive time intervals of duration t over a total duration Td = n t. The rainfall intensity is read from the IDF - curve for the selected return interval for each of the durations t, 2 t, 3 t, 4 t... The Hydrology Days 2003. 81.
(3) Engineering Design Parameters of Storms in Venezuela. corresponding precipitation depth is calculated as the product of the intensities and the duration. The amount of precipitation for each additional unit of time t is equal to the difference between successive precipitation values. These increments are called blocks and are register into a time sequence setting the maximum intensity value at the middle of the total duration and the rest of the blocks are arranged in descending order alternately to the right and left of the central block forming in this way the desired design hyetograph. Instantaneous Intensity Method. If the IDF - curve is defined by a mathematical expression, equations can be developed for the time variation of the storm intensity in the design hyetograph. The precipitation depth for a duration period Td around the storm peak is equal to the value given by the ID-curve or the corresponding equation. The precipitation intensity is considered to vary continuously along the storm. Imaging an alternative block rainfall distribution with a symmetrical triangle shape, it could be assumed that the intensity at the left side of the triangle (concentration time) can be represented as I a = f (ta ) and the intensity at the right side (recession time) as Ib = f ( tb ). A given precipitation intensity I will intercept the hyetograph at ta to the left and at tb to the right of the peak Based on that supposition it can be shown that in generally: I = C Tx / ( D + b)n. (5). where I is the average maximum rainfall intensity; T is the period of return, C, x, b and n are parameters of the equation to be fitted. To construct the IDF curves the Gumbel I distribution has been standardized in Venezuela, which simplified by the Chow Frequency Factor Method has following expression: IT = µI + σ I KT. (6). µI and σ I are the mean and standard deviations of I to be modeled, and KT is the Frequency Factor, tabulated in standard hydrology books as a function of return period T, length of records, and the probability distribution function (in this case Gumbel Type I). For large periods of records, the value of KT can be calculated as follows: KT. = - ( 6/ ){0.5772 + Ln [Ln T/(T - 1)]}. (7). On other side, the parameters µI and σ I are related with the Duration D as follows (Guevara and Cartaya, 2001; Guevara, 2002 a; Guevara, 2002 c) : P/D = µI (or σ I ) = 1/ (A + B D). Hydrology Days 2003. 82. (8).
(4) Guevara. where A and B are parameters to be adjusted. Knowing the regression parameters of equations (8), they can be used in connection with equations (5), (6) and (7) to estimate the Intensity of a design storm for a given Duration and Frequency. Regarding Area-Depth-Duration analysis, Court (1961) proposed a gaussian model to compare the results of ADD of different studies. Renard and Brakensiek (1976) reported marked variations between the results different models used to discuses the storm characteristics in the western intermountain region of USA.. Nicks and Igo (1980) found that the area rainfall distribution in the Southern Great Plains, USA, do not meet the adjustment requirements existing models for other areas. Furthermore, many models are not sensitive to the variation of Depth-Area relation with the variation of storm duration; and therefore they developed a mathematical model to relate to mean depth of rainfall over a given area to storm center rainfall depth. The model is based on the observation that the depth of mean rainfall decreased with distance from the storm center and that the rate of reduction of the point amount increased with shorter duration of rainfall at the storm center. Experience from fitting individual storm depth – area curves lead to the following form of the model to calculate the mean rainfall covering a given area for a given duration: PA = PP - [PP A Dm] / [a + b A]. (9). Where PA is the mean rainfall depth in millimeters for area A in square kilometers; PP is the storm center point amount in millimeters; D is the duration of the storm center rainfall in hours; and ; and m, a, and b, are regression parameters (for Souther Great Plains: m = - 0. 1478; a = 337.4767; y b = 1.0935; adjusted from rainfall data of 138 stations). Based on the analysis of 50 storms registered in the pluviometric national network, former Ministry of Public Works found that the duration of design storms in Venezuela varies generally between three and six hours, and that the reduction factor RD due to area influence is given as (Guevara y Cartaya, 1992): RD = 100( PA / PP ) = m e-A/n. (10). Where RD is the reduction factor of the storm of durations D in hours; A is the rainfall cover area in square kilometers; e is the base of natural logarithms; and m and n are adjustment parameters varying with the duration as follows: For D = 1, 3, 6 hours: m = 95.40; 96.70; 97.40; n = 1337,00; 1904,00; 3449,00, respectively. Applying the mathematical concept that the inverse function of the accumulated rainfall amounts with the duration is a linear function, in this paper following alternative model of those given in Equations (9) and (10) is proposed: Hydrology Days 2003. 83.
(5) Engineering Design Parameters of Storms in Venezuela. Y = 1 /PA = 1/[ a + b A]. (11). where a and b are adjustment parameters. By definition, point rainfall PP is the rainfall value corresponding to a cero area; i.e. 1/a in Equation (11). Thus, the reduction factor RD is given by following relation: RD = PA / PP = a / [ a + b A]. (12). The analysis of available data in Venezuela shows that this general model (Equation (12)) can be applied individually for each storm duration, establishing as many lineal relations as durations exist. Furthermore, regression parameters aD and bD are exponential functions of D, as follows: aD , bD = c D- d. (13). where c and d are parameters to be adjusted.. 3. Methodology For the advancement coefficient r, a total of 275 independent storm events of different durations were selected using the rainfall registers of 20 stations operated by the Agency of Environ and Renewable Natural Resources (MARNR) and by the Air Force of Venezuela. The basic storm characteristics for each selected event were determined: time of begin and end of the storm, total rainfall depth and rainfall intensity for intervals of 5, 10, 15 and 30 minutes. The storm hyetographs and the storm mass curves for each selected event were calculated for time intervals of 5, 10, 15, and 30 minutes. On the basis of the hyetographs and the mass curves the triangular rainfall distribution a long the storm were calculated. On the basis of the triangular hyetographs the advancement storm coefficient was calculated applying equation (1) for each selected event. A variance analysis homogeneity test for the fitness of the advancement storm coefficients for the whole country was pursued. For the IDF modeling the storm events of different durations were selected using the rainfall registers of 162 stations. IDF - curves for each station were elaborated. Regression parameters A and B for both, mean intensities and standard deviation, were calculated applying relation (8). On the basis of rainfall data of 47 storms AAD curves were constructed (Table 5). Available storm durations were 1,2,3,4,5,9,and 12 hours, with 38,34,34,4,47,15, and 6 storm events respectively. Applying Equations (11) and (12) correlation and regression coefficients were calculated for the proposed individual and general model. Hydrology Days 2003. 84.
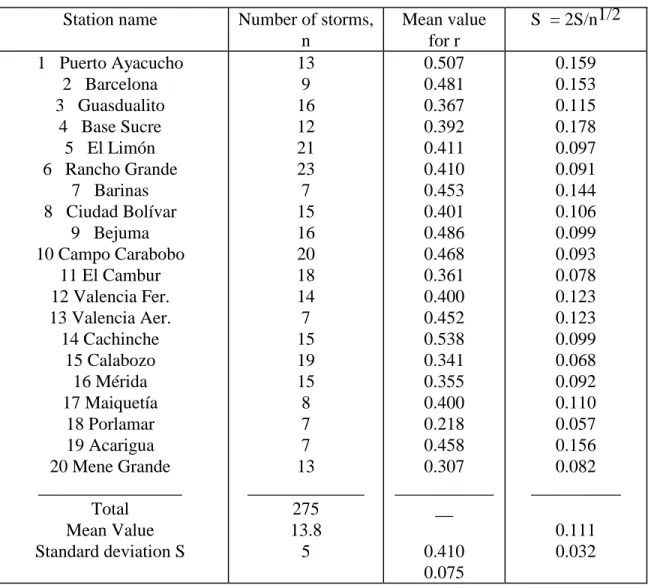
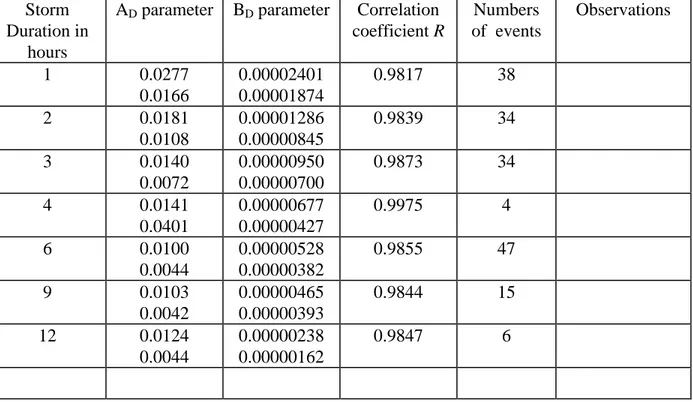
(6) Guevara. 4. Discussion Of Results Statistically speaking, all the analyzed storms can be considered to be from the advanced type with a representative mean value of 0.410 for r in the whole country and a standard deviation of 0.075 (Table 1 and 2).The mean value of r in each station varies between a maximum of 0.535 and a minimum of 0.218. About 61 % of the analyzed storms are from the advanced type (minimum value 0.213); 23 % are from the retarded type (maximum value 1.00); 16 % are from the symmetric type. The high intensity long duration storms do not follow a defined morphologic pattern; they vary from one station to an other, but also for the same station along the time duration. Only a few events of that kind fit to a triangular shape distribution; the majority of them show a bimodal distribution. The short duration storms, on the contrary, show a triangular shape for the rainfall distribution along the storm duration, with small variations due to secondary effects of the storm duration, station location and measurement errors. Regarding IDF Modeling values of A range for the mean intensity from a minimum of 0.0399 to a maximum of 2.3405 with a mean value of 0.3775 and a standard deviation of 0. 2287 (Table 3). The mean value of B is 0.0157, varying from a minimum of 0.0076 to a maximum of 0.0376; the standard deviation is 0.0052. The correlation coefficient is very high, always higher than 0.904. For the standard deviation of intensities, A varies between 0.2205 and 4.0870 with a mean value of 1.3648 and a standard deviation of 0.6180; the value of B ranges from 0.0006 to 0.1631; the mean values is 0.0434 and the standard deviation is 0.0217. The correlation coefficients is almost always bigger than 0.9400; only in a few cases the correlation coefficient is smaller than 0.80. The standard error of estimates is for the mean intensities less than 10 % in 64 % of the stations; less than 20% in 92 % of the cases; and less than 30% in 96 % of the stations; only in 4 % of the cases the error is bigger than 30%; the weighted mean of the error is around 11 %.The estimation errors of standard deviation are a little bigger: only 15 % of the cases show errors less than 30%; the error of estimates is less than 60 % in 61 % of the analyzed cases, and less than 90 % in 80 % of the stations; 20% of the cases show errors bigger than 90%; the weighted mean of the error is about 28 % (Table 4). The results of correlation and regression analysis for ADD curves are given in Table 5. The regression parameters aD , and bD tend to diminish slightly as D increases; but this tendency is only evident until D riches 6 hours; after that the variation is almost imperceptible. Taking into account that duration of design storms in Venezuela are rarely bigger than 6 hours, the developed model constitutes a useful tool for designers, at least for preliminary designs. The values of correlation coefficients are supremely height , even for four and 12 hours durations with only four and six storm events respectively. Using the figures given in Table 5, following relations Hydrology Days 2003. 85.
(7) Engineering Design Parameters of Storms in Venezuela. were obtained for the regression parameters aD and bD, and for the reduction factor: aD = 0.0258 D- 0.471 ; with r = - 0.805. (14). bD = 2 x 10⁻⁵ D- 0.7749 ; with r = - 0.789. (15). RD = 1 /[1 + 7.75 x 10⁻⁴ D- 0.304 A. (16). 6. Conclusions And Recommendations Statistically speaking the storms in Venezuela are from the advanced type with a mean value for the advancement storm coefficient of 0.410 and a standard deviation of 0.075 (Table 2). The short duration storms follow a triangular rainfall distribution pattern. The long duration storms, on the contrary, show a variable behavior with a bimodal distribution pattern. For preliminary studies the mean value of r can be used to estimate the precipitation hyetograph of the storm design in the whole country. According to the importance of the project the designer is free to adopt the most unfavorable value of r. As soon as more information is available the study should be extended to other stations and isolines of r could be drawn in order to search for r the feasibility of regionalization. An IDF Model for Venezuela has been developed, to be used to estimate the parameter of the design storm intensity (mean and standard deviation) to be applied in connection with the Chow General Frequency Equation for a given period of recurrence. For the case of the mean value data fitted to the model have a correlation coefficient of 0.999 and a mean standard error of estimates of 11 %. For the standard deviation the correlation coefficient is 0.990 and the standard error of estimates is 28 % (Table 3 and 4). It is farther recommended to review the results of the analysis as soon as enough and reliable new information is available. The correlation analysis of ADD curves shows that correlation coefficients are height enough to allow the use of obtained relations for preliminary studies in the country. Acknowledgments: The research was supported by “Consejo de Desarrollo Científico y Humanístico (CDCH - UC), Universidad de Carabobo”. References Bilham E. G. (1962): “The classification of heavy Falls of Rain in short periods”. H.M.S.O., London. Republished. Court, A. (1961): Area - Depth Formulas, J. Geophys. Res., 66(6), 1823 – 1831. Guevara E., y Cartaya H. (1991): Hidrología. Una introducción a la hidrologí aplicada. Consejo de desarrollo Científico y Humanístico de la Universidad de Carabobo.. Hydrology Days 2003. 86.
(8) Guevara. Guevara, E and H. Cartaya. (1998): “Storm Advancement Coefficient for the Design Precipitation Hyetographs in Venezuela”. Proceedings of the Eighteenth Annual American Geophysical Union Hydrology Days. Hydrology Days Publications. Colorado State University, Fort Collins, CO. USA. pp 121 - 130. Copy right. 1998 by Morel Seitoux. Guevara, E. (2000): “Patrón de distribución del hietograma de las tormentas en Venezuela”.III Congreso de Investigación en la Universidad de Carabobo. Junio 04 - 09. 2000. Valencia, Venezuela. Guevara, E. y H. Cartaya (2001): “An Intensity -Duration- Frequency Model for Design Storms in Venezuela”. Proceedings of XXI American Geophysical Union Hydrology Days. Hydrology Days Publication. Colorado State University, Fort Collins, CO, USA. pp 85 - 96. Copyright 2001 by Jorge Ramírez. Guevara, E. (2002 a): “Design Parameter Modelling of Tropical Storms in Venezuela”. Proceedings of TIR International Conference on Water Resources and Environmental Engineering. Dresden, Germany. Pp. 420 – 427. Guevara, E. (2002 b): “Distribución del hietograma de las tormentas en la region central de Venezuela”. Memorias en CD del IV Congreso de Investigación y I Congreso de Postgrado en la Universidad de Carabobo. 4 – Nov. 2003. Valencia, Venezuela. Guevara, E. (2002 c):” Modelo regional para la estimación de las lluvias de diseño en la región central de venezuela”. Memorias en CD del IV Congreso de Investigación y I Congreso de Postgrado en la Universidad de Carabobo. 4 – Nov. 2003. Valencia, Venezuela. Nicks, A. D., and F. A. Igo (1980): A Depth - Area - Duration Model for Storm Rainfall in the Southern Great Plains. WRR 16(5), 939 - 945. Renard, K G., and D. L. Brakensiek (1976): Precipitation on intermountain rangeland in the western United States, Paper presented a the Fifth Workshop of USA/Australia Rangeland Panel. Watershed Manege on Range and Forest Lands, Logan, Utah 1976. USDA - SCS (1986): “Urban Hydrology for Small Watersheds”. Tech release No. 55, June 1986. Wenzel, H. G. (1982): “Rainfall for Urban Stormwater Design”. In Urban Storm Water Hydrology. Ed. By David F. Kibler, WRM 7. AGU. Washington DC. Yen, B. C. and V. T. Chow, 1980. “Design Hyetograph for Small Drainage Structures”. J. Hyd. Div. Am. Soc. Civil Eng. Vol 106 No.HY6. Pp 1055 - 1976.. Hydrology Days 2003. 87.
(9) Engineering Design Parameters of Storms in Venezuela. Table 1. Storm advancement coefficient mean values for the design precipitation hyetographs with indication of the number of storms n in each station and the standard error for r. Station name 1 Puerto Ayacucho 2 Barcelona 3 Guasdualito 4 Base Sucre 5 El Limón 6 Rancho Grande 7 Barinas 8 Ciudad Bolívar 9 Bejuma 10 Campo Carabobo 11 El Cambur 12 Valencia Fer. 13 Valencia Aer. 14 Cachinche 15 Calabozo 16 Mérida 17 Maiquetía 18 Porlamar 19 Acarigua 20 Mene Grande ________________ Total Mean Value Standard deviation S. Hydrology Days 2003. Number of storms, n 13 9 16 12 21 23 7 15 16 20 18 14 7 15 19 15 8 7 7 13 _____________ 275 13.8 5. 88. Mean value for r 0.507 0.481 0.367 0.392 0.411 0.410 0.453 0.401 0.486 0.468 0.361 0.400 0.452 0.538 0.341 0.355 0.400 0.218 0.458 0.307 ___________ __ 0.410 0.075. S = 2S/n1/2 0.159 0.153 0.115 0.178 0.097 0.091 0.144 0.106 0.099 0.093 0.078 0.123 0.123 0.099 0.068 0.092 0.110 0.057 0.156 0.082 __________ 0.111 0.032.
(10) Guevara. Table 2. Storm advancement coefficient for the design precipitation hyetographs for each station with indication of the type (advanced ra and retraded rr . Station ra Na 2S/n1/2 rr Nr 2S/n1/2 Nr = 0.50 1 0.295 6 0.118 0.758 6 0.144 1 2 0.233 3 0.169 0.812 2 0.125 4 3 0.243 11 0.080 0.732 3 0.090 2 4 0.213 8 0.098 0.916 3 0.140 1 5 0.254 12 0.067 0.716 5 0.104 4 6 0.284 16 0.044 0.733 6 0.090 1 7 0.354 5 0.075 0.700 2 0.200 0 8 0.240 8 0.039 0.800 2 0.141 5 9 0.279 5 0.153 0.720 4 0.104 7 10 0.295 10 0.058 0.699 7 0.085 3 11 0.273 13 0.045 0.646 3 0.046 2 12 0.245 8 0.081 0.820 2 0.140 4 13 0.350 4 0.125 0.634 2 0.066 1 14 0.350 7 0.028 0.736 6 0.108 2 15 0.266 15 0.046 1.000 1 0 3 16 0.250 10 0.060 0.610 3 0.061 2 17 0.327 6 0.069 0.619 2 0.096 0 18 0.218 6 0.057 1.000 1 0 0 19 0.237 3 0.164 0.665 3 0.089 1 20 0.285 12 0.075 0.571 1 0 0 Number of 168 63 44 cases % 61.1 22.9 16 Mean Value 0.276 8.4 0.744 3.2 2.2 S 0.047 3.8 0.120 1.9 1.9. Hydrology Days 2003. 89.
(11) Engineering Design Parameters of Storms in Venezuela. Table 3. Summary of the correlation and regression analysis of rainfall records in Venezuela. Parameter A. For Mean Intensity Min.: 0.0399 Max.: 2.3405 Mean: 0.3775 St.D. : 0.2287 Min.: 0.0076 Max.: 0.0376 Mean: 0.0157 St.D.: 0.0052 Min.: 0.90371 Max.: 0.99994 Mean: 0.9990 Min.: 0.01201 Max.: 0.78832 Mean: 0.1074. B. R. St. Error of Estimates. For Standard Deviation 0.2205 4.0870 1.3648 0.6180 0.0006 0.1631 0.0434 0.0217 0.02876 0.99960 0.9500 0.07157 5.13000 0.28200. Table 4. Summary of results for the IFD - Analysis of storms in Venezuela Parameter. For Intensity µI in mm/h. A. 0.520. For Standard Deviation I in mm/h 1.809. B. 0.016. 0.044. R. 0.9990. 0.990. St. Error (%). 11. 28. Hydrology Days 2003. 90. Model for µI / I (D in minutes) [60/ (A + B D)].
(12) Guevara. Table 5. Results of correlation and regressiona análisis curves of storms in Venezuela (second number of each 3 is the corresponding standard deviation) Storm AD parameter BD parameter Correlation Duration in coefficient R hours 1 0.0277 0.00002401 0.9817 0.0166 0.00001874 2 0.0181 0.00001286 0.9839 0.0108 0.00000845 3 0.0140 0.00000950 0.9873 0.0072 0.00000700 4 0.0141 0.00000677 0.9975 0.0401 0.00000427 6 0.0100 0.00000528 0.9855 0.0044 0.00000382 9 0.0103 0.00000465 0.9844 0.0042 0.00000393 12 0.0124 0.00000238 0.9847 0.0044 0.00000162. Hydrology Days 2003. 91. applied to ADD block in colum 2 and Numbers of events 38 34 34 4 47 15 6. Observations.
(13)
Figure


Related documents
The EU exports of waste abroad have negative environmental and public health consequences in the countries of destination, while resources for the circular economy.. domestically
This article first details an approach for growing Staphylococcus epi- dermidis biofilms on selected materials, and then a magnetic field exposure system design is described that
46 Konkreta exempel skulle kunna vara främjandeinsatser för affärsänglar/affärsängelnätverk, skapa arenor där aktörer från utbuds- och efterfrågesidan kan mötas eller
Exakt hur dessa verksamheter har uppstått studeras inte i detalj, men nyetableringar kan exempelvis vara ett resultat av avknoppningar från större företag inklusive
The increasing availability of data and attention to services has increased the understanding of the contribution of services to innovation and productivity in
Av tabellen framgår att det behövs utförlig information om de projekt som genomförs vid instituten. Då Tillväxtanalys ska föreslå en metod som kan visa hur institutens verksamhet
Närmare 90 procent av de statliga medlen (intäkter och utgifter) för näringslivets klimatomställning går till generella styrmedel, det vill säga styrmedel som påverkar
Den förbättrade tillgängligheten berör framför allt boende i områden med en mycket hög eller hög tillgänglighet till tätorter, men även antalet personer med längre än
