By
K.Ya. Kondratyev, O.D. Barteneva, L.I. Chapursky, A.P. Chernenko, V.S. Grishechkin, L.S. Ivlev, V.A. Ivanov, V.I. Korzov, V.B. Lipatov, M.A.
Prokofyev, V.K. Tolkatchev, O.B. Vasiliev and V.F. Zhvalev Department of Atmospheric Science
Colorado State University Fort Collins, Colorado
Department of Atmospheric Physics Leningrad State University
and
Department of Radiation Studies Main Geophysical Observatory
7, Karbysheva Street 194018 Leningrad, USSR
This contribution is the fIrst of a series of reports on GATE Radiation Subprogramme results which will be published simultaneously as CSU Atmospheric Science Papers in
English and in the Transactions of the Main Geophysical Observatory in Russian. Transactions of the Main Geophysical Observatory, Leningrad, Issue No. 381.
RADIATIVE PROPERTIES
This contribution is the first of a series of reports on GATE Radiation Subprogramme results which will be published simultaneously as Colorado State University Atmospheric Science Papers in English and in the Transactions of the Main Geophysical Observatory in Russian.
By K. Va. Kondratyev in collaboration with: O. D. Barteneva L.I. Chapursky A. P. Chernenko V. S. Grishechkin L. S. Ivlev V. A. Ivanov V. I. Korzov V. B. L ipatov M. A. Prokofyev V. K. To1katchev O. B. Vasi1iev V. F. Zhvalev
Department of Atmospheric Physics Leningrad State University
and
Department of Radiation Studies Main Geophysical Observatory
7, Karbysheva Street 194018 Leningrad
This research report authored by our Russian colleagues is being distributed jOintly as a CSU Atmospheric Science Report and Leningrad State University, Department of Atmospheric Physics report in order to enhance the international distribution of the scientific information relative to GATE, collected and deduced by Professor Kondratyev and his associates at the University of Leningrad and the Main Geophysical Observatory. It is Professor Kondratyev's and our hope that this timely exchange of scientific results will facilitate research progress in atmospheric radiation studies throughout the world.
We wish to acknowledge the support of the U.S. GATE Project Office for the printing and distribution of the English version of this report.
J?~:t:~
Steplien K. CoxAssociate Professor. of Atmospheric Science.
~-
',,(r>/; /
~
/~
cry.~.¢t" 7J-t/(;~·tr-~
Thomas H. Vonder Haar Associate Professor and Department Head.
Department of Atmospheric Science Colorado State University
Fort Collins Colorado
This report summarizes preliminary results of a research program conducted by Main Geophysical Observatory scientists during the GATE
(GARP
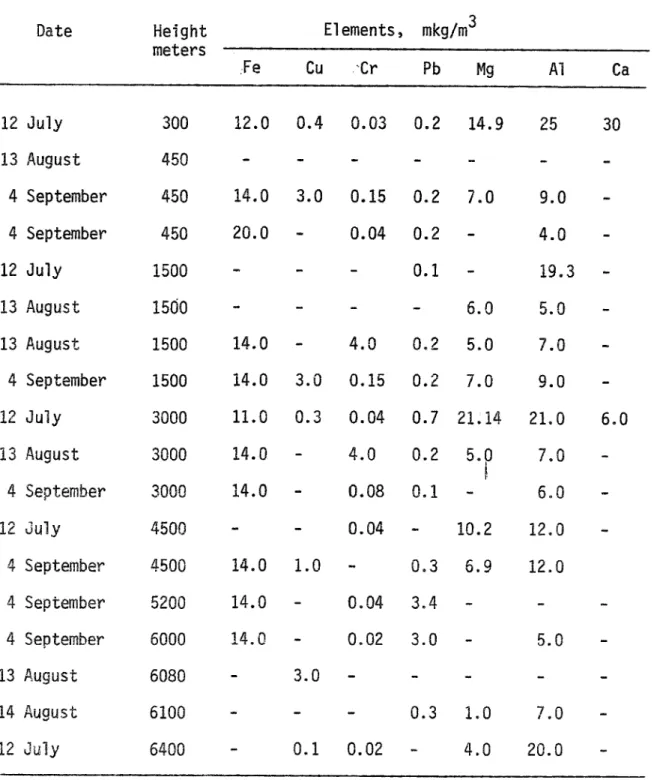
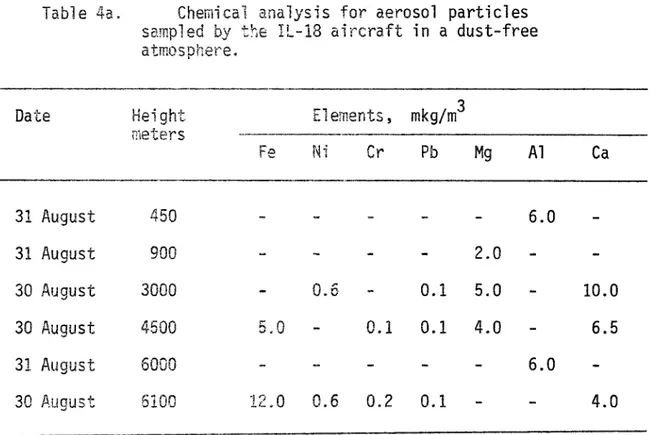
Atlantic Tropical Experiment). The origin and characteristic features of the dust layer are discussed. Inferences of microphysical and optical characteristics of the dust aerosol made from ship data are presented.Chemical analyses of aerosols showed a rather high content of metals. The iron concentration nearly always exceeded 10-5 kg m-3 for aircraft aerosol observations.
Extensive data are presented giving spectral and total short-wave radiative flux divergence values for cloudfree, dust and strato-form cloud cases. These data are interpreted in the context of the meteorological conditions and the optical parameters of the aerosol or cloud layer.
PAGE PREFACE i ABSTRACT ii LIST OF TABLES v LIST OF FIGURES vi 1. I NTRODUCTI ON 1
2. ORIGIN AND AREAL EXTENT OF THE DUST AEROSOL 3
2.1. Characteristic features of the underlying surface 5 of the Western Sahara and its effects on the origin
of the dust outbreaks.
2.2. Characteristic features of the dust outbreaks' images 10
obtained from space.
2.3. Characteristic features of the Western Sahara dust 12 outbreak's spatial extent over the Atlantic.
2.4. Meteorological .conditions in the zone of the dust 18 clouds.
2.4.1. Principal meteorological characteristics of the 18 Saharan Aerosol Layer (SAL).
2.4.2. Synoptic situation during the pow$rful dust 21 outbreak on 30 July, 1974.
2.4.3. Dynamics of the dust flow from Africa on 25
29-30 July 1974.
3. MICROPHYSICAL AND OPTICAL CHARACTERISTICS OF THE DUST 29 AEROSOL AS INFERRED FROM THE SHIP DATA.
4. AIRCRAFT AEROSOL OBSERVATIONS. 47
5. VERTICAL PROFILES OF RADIATION FLUXES AND RADIATIVE HEAT 55 FLUX DIVERGENCES.
6. SPECTRAL DISTRIBUTION OF THE SHORTWAVE RADIATION FLUXES AND RADIATIVE HEAT FLUX DIVERGENCES.
6.1. Visible part of the spectrum.
6.l.I. Spectral fluxes and balances in a cloudless atmosphere and in the presence of a
stratocumulus cloud layer.
6.1.2. The albedo transformation of the system "ocean surface - atmospherell
•
6.1.3. The spectral radiative heat flux divergences in the cloudless and cloudy atmosphere.
6.2. The near-IR spectrum r.egion.
7.
ANGULAR AND SPECTRAL CHARACTERISTICS OF SHORTWAVE RADIATION REFLECTANCE. 7.1. Spectral albedo. 7.2. Reflectance functions. 8. CONCLUS ION. REFERENCES. iv PAGE 67 67 67 70 74 79 96 96 98 106 107TABLE PAGE
1 Optical characteristics of the atmosphere in the 37
Kara-Kum desert in the tropical zone of the Atlantic.
2 Atmospheric transparency in the zone of the dust 39
outbreak.
3 Values of the atmospheric optical characteristics 41
observed under maximum turbidity.
4 Chemical analysis data for the aerosol particles 51
sampled by the IL-18 aircraft in the dust cloud.
4a As above for a dust-free atmosphere. 52
5 IIBlue-red" ratios for albedo. 73
6 Total, molecular and aerosol relative influxes of 91
radiative energy_
FIGURE
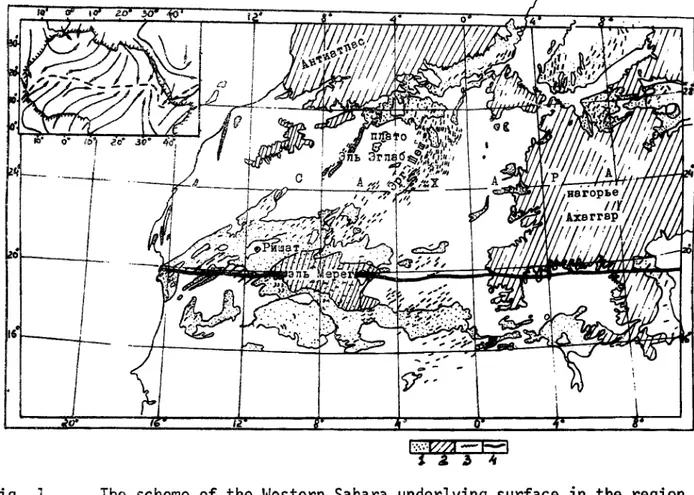
1 The scheme of the Western Sahara underlying.surface in 6 the region of dust storms development fro"m the nWorld
Atlasll (Moscow, GUGK, 1967).
2a The photo of the dust outbreak over the Atlantic taken 8 from SMS-l on July 4, 1974.
2b As above for July 30, 1974. 9
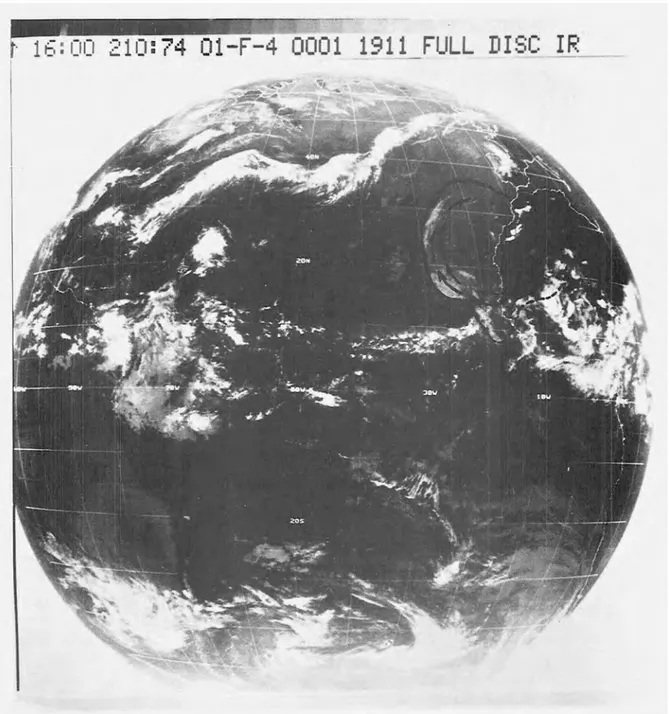
3a Dynamics of the dust cloud inferred from IR SMS-l images 13 at 1600 GMT, on 29 July, 1974
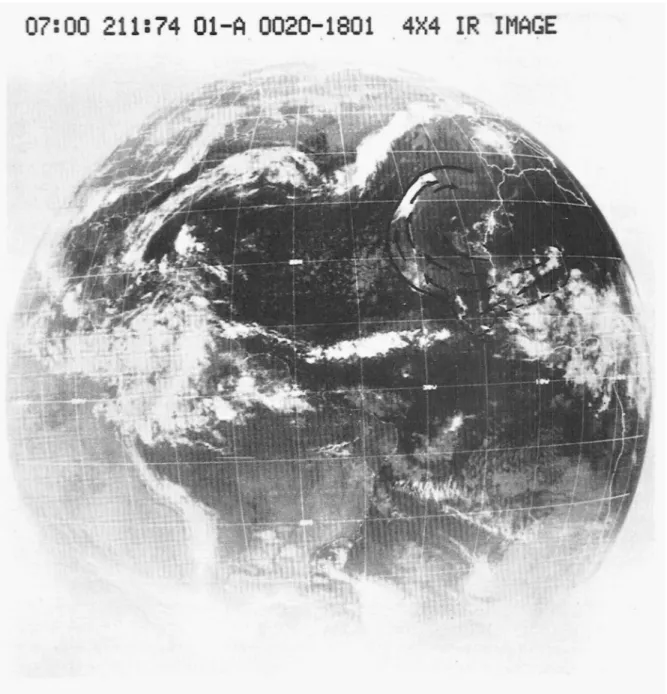
3b As above at 2100 GMT, on 29 July, 1974. 14 3c As above at 0700 GMT, on 30 July, 1974. 15 4 Typical meteorological conditions in the dust cloud zone. 20
5 The surface synoptic map of the dust outbreak area of 30 23 July, 1974, "0000 GMT.
6 The baric topography map AT-700, 30 July, 1974, at 0000 GMT.24
7 The surface synoptic map of the dust outbreak of 29 July, 26 1974, 1200 GMT.
8 Regions of the dust fall-out in the Atlantic from the data 30 in Ref. 8.
9 Meridional profiles of aerosol characteristics from TROPEX~ 32 72 data.
10 Spectra of particles' size from the TROPEX-72 data. 33 11 Comparison of the air temperature meridional curves at 35
altitudes of 27 m (1), 1000 m (2), 2000 m (3), 3000 m (4), and variation of the value of direct solar radiation
attenuation due to aerosol
(5).
12 Light-scattering indicatrices in the near-water atmospheric 43 layer.
13 The scheme of the ships' location in the GATE test area. 44 14 Vertical profile of aerosol concentration of 4 July, 1974. 48 15 The Complete Radiation Experiment.
16 Vertical profiles of the total radiation: 1 - 4 July, 1974, 1330 GMT. 2 - 13 August, 1974,'1350, GMT. 3 - 14 August, 1974, 1420, GMT. 4 - 4 September, 1974, 1300, GMT. vi 49 58
FIGURE 17 18 19 20 21 22 23 24 25 26 27 28 29
Vertical profiles of the shortwave upwelling radiation f1 uxes. Notations, dates and measurement times are the same as in Fig. 16.
Vertical profiles of albedo A. Notations, dates and measurement times are the same as in Fig. 16.
Vertical profiles of the longwave downwelling, L+, and upwelling, Lt, radiation fluxes. Notations, dates and measurement times as in Fig. 16.
Vertical profiles of radiative heat flux divergence. Notations, dates and measurement times as in Fig. 16. Spectral downwelling, KA+, and upwelling, KAt,
radiation fluxes at different atmospheric levels. Spectral net radiation, BA, at different atmospheric 1evels.
Spectral albedo of the "ocean surface-atmosphere" system.
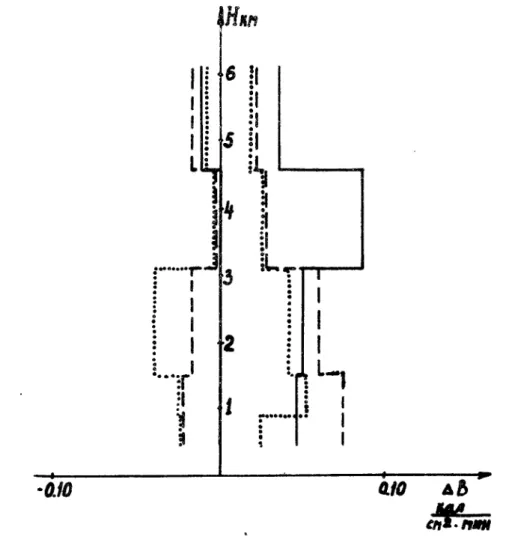
Spectral absolute~ I;; A' and relative BA radictive heat
flux divergence in atmospheric layers of various thicknesses.
Absolute aerosol radiative heat flux divergence (double dashing) and Molecular radiative heat flux divergence
(single dashing) for the whole of the sounded atmosphere. Spectral radiative heat flux divergence in the atmo-sphere with a continuous Sc layer.
Spectral relative radiative heat flux divergences, B)~
transmission coefficients, T~{a)~ and albedo A\(b) ,
as inferred from the measurements made on 4 September, 1974, at 1200 with he
=
71° by the SPI-74 (2-10) and K-2 (1,11) spectrometers.Spectral relative radiative heat flux divergences~
si A9 transmission coefficients, TA(a) and albedo A\(b}
as inferred from the measurements made on 4 September,
1974~ at 1450 with he
=
76° by the SPI-74 (2-7, 9-12)and K-2 (1, 8) spectrometers.
Spectral transmission coefficients, TA, and relative radiative heat flux divergences, SiX, as inferred from the measurements made on 31 August, 1974, at 1251 with he
=
79° (a) and at 1500 with he=
63° (b) by the SPI-74 spectrometer. vii 59 61 62 64 68 71 72 76 78 80 84 85 8830 31 32 33 34 35
Vertical profiles of the spectral albedo as inferred from measurements made on 31 August, 1974 (a) and 22 September, 1974 (b).
Spectral relative radiative heat flux divergences S' transmission coefficients, TA(a) and albedo A~(b) A as inferred from the measurements made on 12 July, 1974 at 1330 with h@
=
81° by the SPI-74 and K-2spectrometers.
The spectral albedo vertical profiles measured by the albedometer.
The angular dependence of brightness coefficient with the sun vertical for A
=
0.99 ~m and different flight altitudes.Vertical profiles of the reflection asymmetry coeffi-cient with the sun vertical for different days and wavelengths.
Vertical profiles of the reflectivity anisotropy coefficient for different days and wavelengths.
viii 89 93 97 100 102 104
One of the characteristic features of the tropical atmosphere's
general circulation is the significant effect upon it of radiation factors [1, 41J, which explains the important role of the GATE Radiation Subprogram and the need for adequate incorporation of the radiative flux divergence
in solving the main problems of GATE.
The conditions of the radiation transfer in the tropical atmosphere of the equatorial Atlantic are rather specific: high temperature and high air humidity, frequent African dust-sandy outbreaks of large areal extent, specific (and drastically variable depending on latitude) conditions of cloudiness - all these cause the necessity for elaborating specific
techniques for parameterizing the radiation processes and the checking of such techniques by the GATE RSP data.
The incorporation of the aerosol effects on the shortwave and long-wave radiation transfer is an important aspect of parameterization. There-fore, the present paper discusses mainly this aspect. The ship and aircraft observations carried out within the framework of the GATE RSP [30J have made it possible to obtain the extensive material allowing the complete analysis of both the characteristic features of the time-spatial variation of the aerosol concentration field and its properties (size distribution, chemical composition, optical parameters), and the effect of aerosol on atmospheric transparency and radiation transfer.
In connection with this, special attention is paid to the problem of the Saharan Aerosol Layer (SAL) effect on radiation transfer and meteoro-logical regime, when gigantic dust clouds flow from the Sahara, (which sometimes cross the Atlantic Ocean and reach the American coast). It is beyond doubt that the study of the SAL and other analogous aerosol form-ations is of great interest from the point of view of the 'climate and aerosol I problem.
It would be quite natural to begin with a discussion of the GATE RSP data already processed: i.e. characteristics of the meteorological
conditions, analysis of the origin and areal extent of the Saharan dust-sandy flows from the geostationary satellite photographs (Section 2). Then the data on size distribution and chemical composition of the dust aerosol are considered (Section 3). The characteristic features of the radiative climatology in the GATE area are described in Section 4, and the data on the atmospheric transparency are given. The characteristic features of the vertical profiles of radiation fluxes and radiative heat flux divergences vs. the vertical structure of the aerosol concentration field, as inferred from the aircraft data, are given in Section 5. Section 6 deals with the spectral measurements of the shortwave radiation fluxes. The paper ends with Section 7 dedicated to studies of angular and spectral characteristics of shortwave radiation reflectance.
The powerful dust outbreaks from the Sahara over the Atlantic ocean are t'ather frequent. The zone of the main dust fall-out (the so-called "Sea of Darkness")
was
determined from the data of numerous ship observations.Aside from this zone of reddish-brown dust fall-out brought by the north-east trade winds, the area of the dust fall-out was found in the zone affected by the "harmatanll effect (the east wind developed in the southern Sahara). The satellites contributed much to the detailed study of these phenomena: the dust clouds were studied from space photographs [2, 3, 29,40]. With the help of the images obtained from the ATS-l geostationary satellite one could observe the development of an enormous dust cloud [28]; and the Saharan dust was sampled near the Barbados Island [39].
From the satellite and ground-truth data, the variation of dust composition was studied versus geographical location of the dust outbreak
[37] .
In April, 1972, on board the ship "Akademik Shirshov", the aerosol measurements in the region of a large dust cloud registered from the meteorological satellite TV images, were carried out. They made it
possible to assess the dust mass in the cloud to be about 5 million tons
[5] .
During the Soviet expedition TROPEX-72, interesting results were
obtained which indicated that the drastic deterioration of transparency, and the highest aerosol concentrations coincided with the powerful dust flows from p.fr-i ca 14].
However. all the above-mentioned data are rather scarce and fragmen-tary_ These data were analyzed without regard for conditions of the dust
flow!s origin and development over land, which are connected with
meteorological conditions and characteristic features of the underlying surface; also the dust flow dynamics were not considered, and the
chemical composition of the dust was studied insufficiently. The GATE made it possible to carty out the complete complex
investigations of the powerful dust pollution of the atmosphere. Apart from the ship measurements, aircraft soundings were performed, during which the aerosol was sampled, and spectral measurements of radiation
fluxes were made.
At the same time, a large sea area was investigated, which made it possible to obtain the data on aerosol spatial variations. The GATE alrea images obtained from the Soviet meteorological satellites "Meteor-16, 'l7,
181i
, the A'llerican geostationary satellites ATS-6, SMS-l, and quasipolar
satellites NOfl..,i\-2, NOAA-3 are an important source of information.
The most powerful dust pollution of the atmosphere detected from the TV and IR images during GATE was observed on the 4th and 30th of July.
In both cases during the dust cloud passage, complex measurements were carried out by the ship scientists, including actinometric, spectral and aerosol observations. The MGO flying laboratory (IL-18M) sounded the atmosphere to measure meteorological, aerosol and radiation parameters. Since the most intensive dust pollution of the atmosphere was observed on 29-30 July (all the ships, including "Passatll
, being located near the equator, registered the sharp deterioration of atmospheric transparency and the increase of aerosol concentration), it was decided to concentrate on the analysis of this case.
2.1 Characteristic Features of the Underlying Surface of the Western Sahara and its Effect on the Origin of the Dust Outbreaks
As the analysis of the space TV and IR images shows, the dust flows over the Atlantic originate from the desert zone of the Western Sahara, the dry savannas and partly the savannas within the gigantic "amphitheatre" surrounded on the north, east and south by mountains (Atlas Mountains, Ahhagar Mountains, Mountains of the Guinea Coast) and their foothills
(Fig. 1). The altitudes in this region are 200-500 m above sea level. The maximum heights of the surrounding hills are 1000 m in the south, 2000 m in the east, and 3500 m in the north. Even though the "wall" of these hills is broken, its elevation shows variations, and, in the south it recedes beyond the Sahara, nevertheless the infrastructure of the relief affects, to a certain extent, the atmospheric circulation in the lower troposphere over this part of the continent, and provides for northeast to southwest and east to west air fluxes out of this natural amphitheatre and into the Atlantic.
The dust fluxes are formed within a triangle defined by the coordinates 16°W, 5°E a.nd 28°N, 16°N. The southern boundary of this tria.ngle is
located far from the south "wall!! of the hills and follows closely the
border of the desert and the dry savannas. The relief of the amphitheatre's floor is formed by two main types of the underlying surfaces, namely
stony plains and sandy massives.
It is interesting to note that some of these large sandy massives, Erg-Shelly (1000 km long and 200 km wide), and Erg-Igudy (700 km long and 70 km wide) are oriented from northeast to southwest, with a corresponding bend in the direction of the dominating winds.
I
"-t-I
16r--_I--_
iil.
Fig. The scheme of the Western Sahara underlying surface in the region of dust storms development from the "World Atlas" (Moscow, GUGK,
1967) .
Notations!
l} Sands with dunes and barchanes.
2} Relief with altitudes from 500 m and higher. 3) Ledges.
4) Boundary separating the tropical belt from the sub-equatorial one (the desert and semi-desert zone from that of savannah and thin forests). - Inserted: the scheme of the direction of the dominant air flow in the surface atmospheric layer over the Northern Africa from "Climates of Africall (Gidrometeoizdat,
The dominating eolian relief forms occurring in the zone of the sandy massives are longitudinal (relative to the wind direction) with sandy
ridges up to several kilometers long stretching from north-northeast to south-southwest, and from northeast to southwest. The fields of these dunes stand out clearly in the photos from the manned aircraft. In the images from ERTS-l, they are observed, in some cases, not only within the sandy massives - ergs, but also on the surface of the stony plains.
The specific relief features of the stony plains, plateaux and separate hills in this particular region appear as a vast development of deflated furrows and hollows (associated with the extracting effect of the dust-sandy fluxes). The deflated forms of the relief in this region have been known before [7]. However, only with the help of the space survey did it become possible to establish the vast areal extent of such formations: they are observed even in small-scale TV images, especially in the region of Adrar plateau and in the regions located south of the residual hills (Fig. 2a). The deflated furrows cause the striped patterns of the image (associated with alternation of ridges formed of the dark-colored rocks, and depressions between them). The deflated furrows of the relief in this region are oriented from northeast to southwest. The
surface deposits here vary greatly: one can observe gravel, usually rather poor deposits seated upon the native bedrock of different composi-tion, on the stony plains, plateaux and residual hills. In some places, pebble deposits are found; but the eol sands, which are devoid of
vegetation are a practically inexhaustible source of dust fluxes and are the most wide-spread particles among the loose deposits.
The sands of the Saharan ergs are mainly fine-grained quartz particles whose size is mainly 0.25-1.1 ~m. They are a reddish color caused by the
t 12:00 185:74 01-A-1 0475 2725 B1 DAKAR
Fig. 2a Photo of the dust outbreak over the Atlantic taken from SMS-1 on 4 July, 1974.
t
13:00 211:74 01-A-2 0325 2500 C1 DAKAR
Fig. 2b Photo of the dust outbreak over the Atlantic taken from SMS-l on 30 July, 1974~
grains' ferruginous coating - the desert crust consists of Fe203 [6, 31J. The large areal extent of such deposits observed also on the stony plains caused the reddish-pinkish tint in the color images of the region taken from aboard the manned spacecraft. This fact also causes the reddish coloration of the atmospheric dust formations flowing out from this region, which was often recorded by ships and aircraft.
Some light-colored (white, yellowish) sands are locally observed in the considered region, these being younger than the reddish sands.
Finally, the alluvial sandy deposits and those containing silt are observed in the southern part of the region investigated, within the alluvial lowland of the Niger River; they are light-colored and silicon enriched due to a high content of fresh-water diatoms. Such light
orange deposits are the feeding source for the dust flows to the Atlantic associated with the development of harmatan.
2.2 Characteristic Features of the Dust Outbreaks' Images Obtained From Space
The photographs from the SMS-l geostationary satellite were used for analysis. Images of different spacial resolution and survey obtained in the visible and IR were considered, namely, the global IR images (the portion of the hemisphere seen from the satellite) with a 4 km resolution in the center, and the TV images covering the area of 6000 x 6000 km and having the resolution of 1.5 km.
The authors analyzed the images obtained during the experiment, and also used the images of the dust-flows obtained at a different time before the experiment.
In the visible, the dust flows are more distinctly seen over the aquatic area (Figs. 2a, 2b). This is caused by the larger brightness
contrast of the dust clouds over water as compared to that of the dust
clouds over land. The identification of dust-flows over land in the visible is particularly complicated for this region, due to the large areal extent of the light-colored sandy deposits, which form the background surface. Besides, when passing over land, the dust flows mask the residual hills, ridges and plateaux of dark-colored rocks, which are easily singled out in the images taken in the absence of the dust-flows.
The comparison of the images of the same region taken at different times, together with characteristic features of such hills serving as marking points, makes it possible to evaluate the development of the dust-flow. This is, in particular, clearly seen in the image obtained on 30 July (Fig. 2b). The powerful dust cloud masks the details of the relief to the north and south of the Adrar plateau~ that are distinctly seen in the images taken in the absence of the dust over the same region
(Fig. 2a). In the images, the dust-flows often, though not always, stand out as a pronounced striped formation caused by the inhomogeneity of the dust turbidity spatial development and by the streamed structure of the dust cloud.
The presence of dust-flows is accentuated by the cloud orientation. especially in the cases when both dust-flows and clouds are drawn
into the same ~ystem of the atmospheric circulation. Most often such phenomena are observed in the imaqes over the Atlantic far from the center of the dust-flow qeneration (Fiqs. 2a, 2b). The dust-flows over the aquatic area ate recoqnized in the TV imaqes by the decreasinq briqhtness of the cloud masses located below the dust cloud, i.e. the dust albedo is lower than cloud albedo. The cloud masses below the dust cloud ilgrolfJ greyll, and their boundaries become dim. In the IR images, the dust turbidity of the atmosphere is depicted by the light
grey tint, i.e. they are cold formations when compared to the land surface, but darker (warm) when compared to the cloud upper boundary (Figs. 3a, 3b, and 3c). In the IR day-time images, the dust formations are more distinctly seen over land, which is explained by the higher temperature contrasts of the 1I1and-dustl! system. The IR images allow one to trace the development of dust clouds not only in the day-time (as in the TV images), but also at night, By night, when the land surface is strongly cooled, the temperature contrast of the !!land-dust cloud!! system decreases.
The joint usage of the IR and TV images is most informative for the analysis of the dust outbreak.
2.3 Characteristic Features of the Western Sahara Dust Outbreak's
~atial Extent Over the Atlantic
Photographing from satellites has made it possible to obtain unique information about the size, configuration and areal extent of the dust outbreaks. The size of dust clouds varied during GATE within wide limits which ;s quite natural, and is determined by the duration of the dust outflow from the feeding center, as well as by peculiarities of the synoptic situation and atmospheric circulation.
In the images, dust clouds of quite different configuration were traced, e.g. comparatively small, almost linear, or slightly curved, like the clouds seen in the IR image obtained on 29 July (Fig. 3a). This dust cloud was 1300 km long and 200-500 km wide.
Sometimes the dust flowing from the continent to the Atlantic formed a large cloud, corresponding to the zone of "Sea of Darkness", like the situation registered at 1500 Z, 9 July. In other cases, the dust flowing to the Atlantic was drawn into the gigantic circulation of the Azores anticyclone, and as a result, the dust cloud drifted along an
Fig. 3a Dynamics of the dust cloud of 29 July, 1974, at 1600 GMT, as inferred from the IR SMS-1 images.
21: 00 210: 74 01-A 0020-1801 4X4 IR BiAGE
Fig. 3b Dynamics of the dust cloud of 29 July, 1974, at 2100 GMT, as inferred from the IR SMS-1 images.
07:00 211:74 01-A 0020-1801 4X4 IR IMAGE
Fig. 3c Dynamics of the dust cloud of 30,July, 1974, at 0700 GMT, as inferred from the IR SMS-1 images.
enormous arc reaching the Northwestern African coast and southern Europe. This case was traced, in particular, in the IR image obtained on 30 July
(Fig. 3c). The cloud was 4500 km long and 500-700 km wide. In some cases, during the western drift, the dust cloud moved to the American coast.
Such an outbreak was registered, for example, on 8 July 1974, in the image obtained from SMS-l [32J. On 5 August, the dust cloud was detected (also from the SMS-l images) near the eastern coast of Florida [33J. The area of the dust clouds varies depending on the power of the dust source, and the character of the atmospheric circulation; and averages several thousand square kilometers. Sometimes, dust zones of great length are observed. For example, the dust turbidity of the atmosphere over Western Africa and the Atlantic registered at 0700 Z, 30 July, covered about 6800,000 km2. The area of the dust cloud was 1,500,000 km2 over land and approximately 5,300,000 km2 over the sea. Of even greater size was a gigantic dust cloud registered in the image on 3 July 1969, which moved toward the South American coast over the Atlantic. Its area was about 6,000,000 km2, i.e. this cloud covered about 0.1% of the globe [28J.
The area of the contrasting "small" independent dust cloud was much smaller (approx. 160.000 km). As the analysis of the IR images showed, such a cloud was comparatively "young", and had not combined with the dust cloud drawn out to the ocean previously (Fig. 3).
The dust-flows registered in the photographs taken from space, come from different parts of the Western Sahara. With the help of the space images it was possible to locate several centers that produce the dust outbreaks. Some of them are located northwest of the Ahhagar foothills
with the maximum heating of the dark-colored stony surfaces of this
region and subsequent formation of the powerful vertical convective fluxes which then drift towards Erg-Shelly and further over that sandy massif" which feeds them with dust.
The second center generating the dust outbreaks is less distinctly outlined in the IR image. It is located southwest of the Ahhagar foothills on the plateau Tassilin-Ahhagar (23-24°N, 3-4°E), and as in the first case,
is associated with the intensive heating of the stony surfaces and, probably, penetration of the cooler monsoon. In the area where the
monsoon meets the heated surface, the convection significantly increases. The local dust-flows can be associated with strong deflection of small sand massives. Two such massives are located in the coastal region of the Western Sahara (Agerger region), and judging by the TV images, serve as
the center of the local dust outbreaks over the Atlantic. The prinicpal
directions of the dust drift are also depicted from the space images. One of the main trajectories of the dust movement goes from center No. lover the gigantic sand massif Erg-Shelly southwest of the Adrar plateau and further on to the coast. The sand deposits of Erg-Shelly serve as a feeding source for this dust-flow. The fact that the moving dust-flow masks the hills' tops of up to 600 m elevation south of Adrar plateau
(this is seen when the images of 4 and 30 July are compared - Fig, 2a, 2b), enables one to infer that the flow moved aloft up to 0.6 km, i.e. it rose from the ground for at least several hundred meters.
From the region of the second center, the dust cloud moves southwest, judging by the IR images (Fig. 3a), and passing over the lowland of the Niger River, catches the light-colored particles associated with the silt deposits of Niger floods.
2.4 Meteorological Conditions in the Zone of Dust Clouds
As a rule, cloud-free weather or few clouds were observed in the zone of dust outbreak. It was noted also that intensive development of
convective cloud.iness together with accompanying phenomena takes place at the boundary of the Saharan aerosol layer, or in its absence, over the whole intertropical convergence zone. These observations enable one to assume the aerosol cloud to have certain properties stopping the
development of cloud convection and some self-stabilizing mechanism that maintains the dust cloud's spatial structure.
2.4.1 Principal Meteorological Characteristics of the Saharan Aerosol Layer (SAL)
In summer months9 the anticyclonic formations over Western Africa favor the heated air and dust outflow over the Atalntic between 10° and 25°N. The aerosol cloud with its base at 0.5-1 km and its top at 4-6 km moves together with the western air flow going as far as 3-4 thousand km from the African continent and reaches the coasts of the North and South America in 6-8 days at an average speed of 15-20 km/hr. The lower
boundary of the aerosol layer usually coincides with the upper boundary of the trade wind inversion. Beneath the inversion, a heavily moistened air layer is located, where the trade-wind inversion cloudiness is formed, amounting to 5-8 eights cloud cover. Though the surface air layer con-tains a great amount of water vapor, the trade wind inversion inhibits the development of convective cloudiness.
The lower boundary of the aerosol layer is usually distinctly pro-nounced and can be determined by the moment of the horizon disappearance (the mean height of the base is 0.38 km). The lower part of the aerosol cloud is 5-6°C wa,rmer as compared to the normal dust-free tropical air.
Higher, up to the altitude of 4-5 km (the mean value of 4.8 km), a distinctly pronounced colored aerosol layer is located, characterized by a sharp deterioration of visibility down to 500 m, high potential temperature (higher than 40°C) and a sharp decrease of the water vapor content.
The stepped structure of the vertical profile of the absolute air humidity (q) through the aerosol layer is rather typical (Fig. 4). The anomalous overheating remains through the aerosol layer up to the 650 mb . level (3.5 km), above which the dusty air turns out to be cooler as
compared to the clear atmosphere. At the external boundaries of the aerosol cloud, sharp horizontal gradients of meteoelements are observed up to I-2°C change in the air temperature and 5-6°C change in the dew-point temperature. On the whole, the aerosol cloud presents a large-scale temperature inhomogeneity somewhat lifted over the ocean level and characterized by high self-stabilizing properties.
The analysis of the data from 20 flights in the cloudless tropical troposphere with a strongly pronounced aerosol layer, makes it possible to draw the mean vertical profiles of the meteoelements and to reveal their most characteristic properties. Figure 4 presents an idealized picture of the air temperature, absolute humidity and wind speed profiles.
The trade wind inversion is smoothed down in the averaged profile of the air temperature, but the general background of the thermal anomaly in the zone of the aerosol layer is pronounced distinctly. Inhomogeneities of the averaged profile of wind speed correlate with the zones of temper-ature anomalies: the first maximum at the altitude of 2.5-3km coincides with the mean level of minimum visibility in the aerosol layer and with a maximum of aerosol concentration. The second maximum of the wind speed
...
,
!"
,.
t.•
0 Fig. 4/
/ / / ? / /I
/--1 \
", IInll,m8
r
",.JfJ""
.
\ ~MI! ,
t
\ 1.
\
1---·2
'l..-.._.L.
---3 II
I . II
I •f
I IL ..
_.,,-,
"r • _,.,..", ••
, ,
,
c •••v-'1.
Te. ,,.,
Typical meteorological conditions in the dust cloud zone. 1 - air temperature
2 - absolute humidity 3 - wind speed
coincides with the top of the aerosol cloud. The distribution of absolute humidity is characterized first of all by the stepped structure, which indicates the stratified character of the aerosol cloud.
Let us discuss a specific synoptic situation during one of the most powerful dust flows on 29-30 July 1974.
2.4.2 Synoptic Situation During the Powerful Dust Outbreak on 30 July, 1974. In July, the second (after January) largest dust storm is observed in the Western Sahara. At this time the outbreaks originate not because of strong winds, but due to powerful overheating of the Tower air layers, intensive convection and formation of baric depressions. When the dust rises to a certain altitude, it is carried away by the northeastern trade wind, and being drawn into the Azores anticyclone circulation is transported over the Atlantic Ocean first eastward, and then to the north and northwest along the periphery of the anticyclone. Gradually, the dust covers all the area occupied by the anticyclone. As a result, an enormolls dust cloud
is formed which sometimes reaches South America while drifting westward. For such a distant dust transfer, strong stationary northeastern winds in the lower troposphere are necessary. They occur when the center of the Azores anticyclone drifts to the southeast towards the African coast. At the altitudes over the southern part of the Western Sahara, high baric gradients are formed,"which lead to the strengthening of the northeastern trade wind and harmatan.
A similar situation was observed on 29 July, 1974. The center of the Azores anticyclone was located in the extreme south (300N, 25°W - near surface. and 30oN, lOoW - at the 700 mb level). This caused the increase
of the baric gradients, which in turn led to the strengthening of the northeastern trade wind. The anticyclone in the southern hemisphere
drifted northward too. The pressure crest stretched towards the equator, along 20oW; as if an arch was created between the Azores anticyclone and the southern hemisphere. The intertropical convergence zone was divided into two branches (Fig. 5). The possibility now occurs for air exchange between the northern and southern hemispheres.
Using extensive statistica'l data from the ATS-III geosta,tionary satellite, TV im~ges, together with simultaneous synoptic data and dust concentration measurements, the American researchers have put forward a circulation model of the powerful dust outbreaks into the Atlantic [29]. According to this model, an atmospheric front is born in the lower
atmospheric layers when hot African air meets with the cool and humid Atlantic air mass. This front is clearly traced in TV images as a cloud field generated during an overflow of clean (dust-free) hot African air. Afterwards, this disturbance drifts westward together with dust clouds. In the IR image dated 29 July, 1600 GMT, a cloud ridge stretching from southwest to northeast (along 20oW) and contacting the ITCZ in the south stands out particularly clearly. Obviously, it is associated with such a front in the clear air zone. Over the,West African coast a cyclonically bent dust cloud connected with the northern extreme of this surface front
o
in the area of the dusty air outbreak can be traced from the shore to 12 W and from 18-20DN. The surface front is expressed as a p~essure!gr~dtent.
In the surface pressure chart (Fig. 6), a low pressure ~one with two centers is present: one in the dust cloud area, the other coincides with the cloud front. The positioning of this surface front corresponds to the beginning of a new hot Saharan air outbreak into the ocean.
Fig. 5
.
..
.
. .
'...
-....
.
-.
•• - '0. • • 101 : •.
.......
.."
e.' e. ."=1
.
,.
.
.
: .' :'-g .•••,.-.
.
.
..
o • • : -- . 0 •• e..
.
.,G •• -.
.
,,'...
' 00 .'...
.M f::J(JoooO(}()i- Areal extent of the dust cloud.
The surface synoptic map of the dust outbreak area of 30 July,
20"ll.
·
·
·
... ...11.-.
.
0"..
. _ • • • • • 0 . ..
: ..I :
• f£ e • 0 - • • - - . . :.-:i
:.e'll' ... . G._...
. . .
.:
:
",-'0' eM L---+---~---_+~---r_----~~~ • 1020 Fi g, 6.
". o • 1D2D 1020I~ I~
11f ..
~"-1
f 2 !JThe baric topography map AT-700 of 30 July, 1974, 0000 GMT. Notations:
1) The areal extent of the dust cloud.
2) The dust cloud boundaries obtained from the TV images, 3) Direction of the dust-wind fluxes,
In the Western Sahara, the dust storm centers originated near the
surface, and they reached their maxima in the afternoon of July 29 (Fig. 6). One center with the coordinates of l8°N, BOW was formed as a result of
cool western monsoon air colliding with dry and hot eastern flows. The
second center arose in the western region of the central Sahara (31°N, a-5°W) due to the formation of the powerful convective fluxes when the surface was strongly heated. For the same reason, the third center of dust storms was produced in the region of 5°W - 0° and 200N - 25°N. The first two centers can be spotted in the synoptic map and IR images, the third center only in the image. As is seen from the 29 July IR images (Fig. 3a), the enormous dust cloud was caused by the lifting of the dust from the first center of the storm, with its subsequent transfer over the Atlantic along the Azores anticyclonic circulation. The analysis of the baric topographic maps has shown that this dust transfer over the Atlantic occurred at the altitude of about 3 km (Fig. 7). On 30 July, a further formation of the gigantic dust flow over the Atlantic was observed, as a result of dust transfer from the other dust storm centers into the high-altitude atmospheric circulation.
2.4.3 Dynamics of the Dust Flow From Africa on 29-30 July, 1974. The joint analysis of the IR and TV images obtained from a
geostationary satellite on 29-30 July, 1974, makes it possible to trace the dynamics of development of the dust cloud under consideration. The first IR image in which a dust flow was spotted, was seen at 1600 on 29 JUlY. At this time two storm centers were easily seen in the form of dust clouds (one in the region of 18°N, 8°W, the other in the region of 31°N, COW). Judging by the image, the first center was the source of the
".
,.
.
'.
. -
.
.
• • .. • tI ••• • • • • eo. eo .... : ~20 ••••• e. •••• eo.
e..
.
.
o • '. ~---+----~~+---__
~______
~~____
==~~____
IO· Fi g. 7 / I I II' '" ... .cI'''...
o· '.W4J.e~1ZJ
•
I
f .2 5 ¥The surface synoptic map of the dust outbreak of 29 July, 1974,
1200 GMT. Notations:
1) The intertropical convergence zone. 2) The dust storms front location.
3) An approximate location of the dust storms front.
dust cloud registered at this time oyer the Atlantic. The second center was identified by a stretched broadening cloud consisting of individual streams .
. From the analysis of the subsequent images obtained on 29 and 30 July, one can see the way the dust transfer from the second center over Africa to the Atlantic happened (Fig. 3a, 3b). Comparing the IR images obtained at 1600 and 2100 on 29 July~ we see that the front edge of the cloud drifted a distance of about 5°in five hours, latitudinally, i.e. this transfer went on with the speed of about 30 m/sec. Since the network of aerological stations in the region considered is rather sparse, this fact
is an important additional source of information about the northeastern trade wind speed at the altitudes of 1-3 km.
The simultaneous analysis of TV images (1800) and the surface relief showed that the base of the cloud was higher than 600 m. Later on, the dust cloud drawn into the Azores anticyclonic circulation, drifted over the ocean filling the Azores anticyclone (Fig. 3). In 10 hours (0700, 30 July), the frontal part of this outbreak was near the meridian of 25°W. The
transfer speed appeared again to be 30 m/sec.
Now, let us trace the changes of the dust cloud boundaries oyer the aquatic area. At 1600 on 29 July, the front(western) cloud edge reached 30oW, the northern one - 35°N, and the southern one was at about looN. It
is interesting to single out a small spur of the dust cloud which, as if breaking the ITCZ~ edges itself between its two branches, reaching looN
and possibly moving even further to the south. In the image obtained at 1600 or. 29 July (Fig. 3a) the cloudiness located along the western
boundary of this dust spur is traced up to 9°N. The westward reach of the spur went as far as 21°W. In five hours (2100), the western edge of
The cloud spur drifted southward to 7°N (further southward movement of dust is difficuit to discern). At 0700 on 30 July, the western boundary of the main cloud reached 35°W, and the southern spur - 25°N. The cloud wesbfard drift went at a speed of about 10 m/sec.
On 29-30 July, 1974, some of the GATE ships happened to be in the region of the cloud's southern spur. While only IlPoryv" was in the cloud at 1600, 29 July, at 0700 on 30 July, IIVize" and IIKorolovu were embraced
by the dust zone as well. The ship data made it possible to obtain infor'mation on the optical and microphysical charactersitics o.f the dust cloud.
Let us turn now to a discussion of these observational data aiming at the subsequent consideration of the aircraft aerosol measurements results (Chapter 4) both in the dust zone and beyond it.
DUST AEROSOL AS INFERRED FROM THE SHIP DATA.
As was already noted, the region of the Atlantic from 22°N to 10"N and down to 400W (the so-called "Sea of Darkness") [18] is characterized by systematic dust outbreaks over the ocean from the African deserts due to the northeastern trade wind. This feature is superimposed on all the specific aerosol optical characteristics of the atmosphere in this palrt of the global ocean.
Figure 8 depicts the dust fallout regions into the Atlantic on three different occasions [8]. The first maximum fallout is observed in
.
February and reaches 21.6%, the second one in August (10.4%) and the minimum of 1.6% in November [9]. Up to the present time, the atmospheric aerosol reasearch in the "Sea of Darkness" has been qualitative. The first quantitative data were obtained in March-July 1970 by the scientific
research ship IIAkademik Shirshov" [5] and in 1972 - during the USSR TROPEX-·72 national experiment by weather ships "Musson" [10] and IIAkademik Kurchatovll
[4, 11, 12].
The specific nature of the atmospheric aerosol and its radiative characteristics in the region of IISea of Darkness" is distinctly
presented through the data obtained during TROPEX-72 by the ship "Musson" whi1e it performed a meridional cross-section along the 19 W longitude from 30 N to 15 S. These data are represented in Fig. 9 [10].
In the region under consideration, the aerosol and optical propelrties of the atmosphere deperd significantly on the air masses' trajectory, especially in the lower 2 km layer. In the beginning of the meridional cross-section from 300
N to 25°N, the mean wind in the 2 km layer gradually turned from west to north. At these points, the pure oceanic air masses
Fi g. 8
IfiW
1, ,:,,-,.,
~
I,
10~ ",
10 10
Regions of the dust fall-out in the Atlantic from the data of Ref. 8:
1 - rarely observed 2 - more often 3 - very often
entered the investigated region; these air masses were characterized by low aer'osol particle concentration and s1 ight aerosol attenuation of the solar radiation. The northeastern trade wind dominated over the band of 22-100N. This area clearly stands out in Fig. 9 due to its aerosol-radiative characteristics. Radiation attenuation due to aerosol, concentrations of all the measured particle fractions, and the weight concentrati'on reach their maxima in this region.
The filter exposed from 15 to looN turned out to be covered by a layer of yellow sandy dust. The spectra of particle siz'e registered
along the axis of the IISea of Darkness" (l4°N, 19°W) are given in Fig. 10. For comparison, the mean spectra of the surface air layer aerosol size observed in the countryside over the Central part of the USSR
European territory under the conditions of high atmospheric transparency (meteorological visibility SM
=
30 km) and dense haze (SM=
2 km) are shown in the same Figure [13J.The gigantic particle concentration over the "Sea of Darknessli greatly exceeds the mean concentrations registered over the USSR central European area in dense haze. Minimum concentrations measured over the ocean (Fig. 10, curve 3) are tenfold lower than those found in the surface air layer over the USSR central European area.
The second meridional cross-section during the TROPEX-72 made also by ship "Musson" along 26°W, from the equator to 22.5°N (27 August - 1 September) showed that the maximum aerosol concentrations were observed in the
zone of maximum dust fallout over the II Sea of Darkness ". As a
rule, the particle concentration along 26°W turned out to be lower than the corresponding values along 19°W. Apparently, this is associated with the ship moving away from the African continent, over which the
Fi g. 9 10 1 JItr ... ~
,
,..~ "~..,,..-... :'lc.
1... JO·Jl..-_ _ _ _ _ _ _ _ _ _ _ _ _ _ <. _ _ _ ~ CfVI-3 /0" 1(/10"
-'I 10 d. .i 3O<!>e.w.o
Meridional profiles of aerosol characteristics from the TROPEX-72 data:
a - direct solar radiation attentuation due to aerosol b - condensation kerns· concentration
c - large particles· concentration d - gigantic particles· concentration 1 - meridional profile along 19°W 2 - meridional profile along 26°W
Fi g. 10 Spectra of particles· size from the TROPEX-72 data:
1, 2, 3 - oceanic, registered in the region of maximum (19°W,
14°N) and minimum (19°W, 14°S) particles· concentrations 4, 5 - middle spectra of the continent aerosol at meteorological
visibility of 30 and 2 km [23].
6 - spectrum of particles· size from the 30 July, 1974 data (equator, 100W).
trade winds are constantly blowing. For the 12 to 24°N region, the shortest distance from Africa to the 19°W meridian constitutes 300 km, while for 26°W, it ;s about 900-1000 km.
The decrease of large and gigantic particle concentration observed when moving away from Africa, testify to the continental origin of the main bulk of aerosol particles for this region of the Atlantic. The
atmospheric particle concentration registered at 19° and 26°W, practically coincide, which is associated with their slow fallout and washout from the atmosphere.
Comparison of the radiation attenuation values due to aerosol, with the aerosol particle concentration in the near-water atmospheric layer has shown that a maximum of aerosol attenuation (transparency coefficient Paer.
=
0.52, P2=
O.43) is observed in the areas of the highest aerosol concentrations.As is known, the radiation absorbed by water vapor and aerosol
particles heats the lower troposphere. According to the data of Ref. 14, the value of radiative heating in the lower troposphere in middle
latitudes is near 0.06 - O.lo/hr for clear summer days, reaching in some layers 0.2°/hr. The particle content in the atmosphere over the "Sea of Darkness" is high, and the total atmospheric water vapor content reaching 4-5 cm is much higher than the middle latitudes [15J.
Therefore, one can expect a more intensive air heating due to absorption of solar radiation by aerosol particles and water vapor.
Measurements and calculations of aerosol absorption carried out in [14, 16] have shown that radiative heating can lead to the formation of an inversion in the lower tropospheric layers. In Fig. 11, the meridional trend of the
i'e
30[
25
15
10
Fi g. 11 Comparison of the air temperature meridional curves at the altitudes of 27 m (1), 1000 rn (2), 2000 m (3), 3000 m (4), and
the variation of the value of direct solar radiation attenuation due to aerosol (5).
altitudes of 27, 1000, 2000 and 3000 m, plotted according to the data of four times-a-day soundings from aboard the "Musson" is compared with the simultaneously measured intensity of the aerosol attenuation of solar radiation [10].
As follows from Fig. 11, the maximum temperature of +28°C was registered in the sub-equatorial zone at 5°N in the near-the-water air layer. The maxima of air temperatures at the altitude of 1-3 km are
shifted further north (13-200N). The region of the maximum air temperatures
1n the lower 3 km layer is located in the area of the "Sea of Darkness" and correlates with the zone of the maximum direct solar radiation absorption by the aerosol. The maximum air temperature at the 1 km altitude correlates well with the area of maximum aerosol absorption through the meridional cross-section over 26°W.
However, at the altitudes of 2 and 3 km such a correlation was not observed. It should be mentioned that though the causes of the trade wind inversions ' generation are well known, namely: the downward movement of air in the anticyclone, the intrusion of air masses into the tropical zone; the intensive solar radiation absorption by aerosol particles and water vapor, will playa certain role in the inversions' deepening over the "Sea of Darkness".
The constant presence of dust alters the optical properties of the atmosphere over the region of the "Sea of Darkness". As the results of the expedition TROPEX-72 [4] have shown, the principle feature of radiation attenuation in the 0.35 - 1 ~m region of the spectrum over this oceanic area is similar to the peculiarities of radiation attenuation over desert areas, including the increase of attenuation near. A = 0.38 ].lm, which is to all appearances caused by absorption by haematite particles
(F e
Table 1 presents examples of comparing the optical characteristics of the atmosphere and the total water vapor content (
w )
for the Kara-Kum sandy desert and the sub-equatorial Atlantic subjected to the Saharan dust outbreaks. Here P2 is the integral atmospheric transparency coefficient reduced to the mass m
=
2 through S. I. Sivkov's technique [18J; T*:\ is the aerosol optical thickness of the atmosphere; n is the index of power to which the wavelength is raised in the Angstrom formula T*:\=
B:\-nthat characterizes the degree of the aerosol attenuation selectivity. Aerosol optical thickness at A
=
1 ~m corresponds to the Angstrom index of the atmospheric turbiditys.
Let us point out that according to data measured during TROPEX-72 and GATE, the aerosol attenuation followed the usual dependence of T* = SA-no
A
Table 1. Optical characteristics of the atmosphere in the Kara-Kum Desert in the tropical zone of the Atlantic.
Place of I Date P 2 T* n t,! Observation I :\ 1..=0.33 ~m :\=1 ~rn cm 1 The Atlantic 24.06 0.59 0.345 0.271 0.2 3.2 Ocean I Kara-Kum 10.09
I
0.58 0.345 0.254I
O. 1 2.7 DesertI
I The Atlantic 24.06 0.55 0.421 0.322 0.2 3. 1 Ocean Kara-Kum 16.09 0.67 0.450 0.115 0.2 0.7 DesertThe At'J anti c 20.07 0.73 I 0.198 0.097 0.7 4.9
Ocean I I Kara-Kum
I
19.09 I 0.77 0.184 0.078 0.8 0.6 Desert I I--_._-
IAs is seen from Table 1, the values of aerosol optical thickness can be close to each other for the two global regions under consideratio~
in spite of the great difference in water content. In those rare cases when the values of W were of the same order, not only spectral but also the integral characteristics of transparency coincided as well. In other cases) a heightened water content over the equatorial Atlantic caused the decrease of integral transparency.
The powerful dust flows from the continent - the result of dust storms over the African deserts, change the optical and aerosol characteristics of the atmosphere even more.
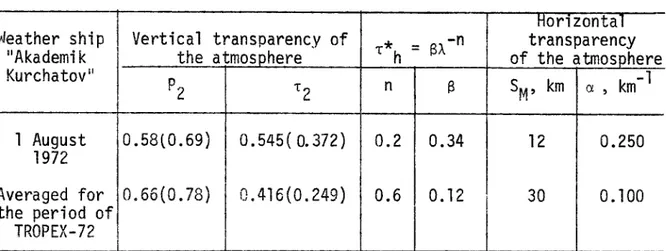
Table 2 and Fig. 10 show the effect of a dust cloud outbreak on
optical and aerosol characteristics of the atmosphere in the sub-equatorial zone of the Atlantic as "inferred from the data obtained during TROPEX-72 by the weather-ships IIAkademik Kurchatov" and IIMussonll
• The ships were in the bunkering area near the Mauritanian coast under coordinates of ~
=
l8°8IN, A
=
16°51W [4, 10, 12J. In the given season, the boundary between the Azores oceanic anticyclone and the summer baric depression existing over the Sahara passes through that area. The high-altitude northeastern winds were carrying great amounts of dry dust through which the higher clouds could hardly be observed (the stable northwestern winds enveloped only the lower layers). The effect of the dust flow was so powerful that the
mean transparency coefficient for the whole atmosphere reduced to mass 2 constituted 0.58 (the integral optical thickness L2
=
0.372), reaching in some cases 0.43 (L2=
0.845). Meteorological visibility dropped down to 8.7 - 12 km, the values of nand Breached 0.2 and 0.34, respectively. The last line of Table 2 gives the mean values of the enumeratedduring this period. The values of the integral aerosol atmospheric transparency coefficient and the integral aerosol optical thickness calculated according to [18] are given in brackets. Note, that the
obtained values of atmospheric transparency for the near-water layer agree with the values in [34J, according to which the "Sea of Darknessll
is
characterized by meteorological visibility of about 15 km, and 25 to 30 km for the equatorial Atlantic. The spectrum of aerosol particles registered on board the IIMusson" ship [10] at the same time is presented in Fig. 10. Curve 2 corresponds to the particle size distribution obtained on 1 August, 1972. Curve 3, as was stated above, was obtained in a practically dust-free region of the Atlantic at 14°5, 19°W. As follows from Fig. 10, particle concentrations differ by the order of three for all the sizes, the particles with radius r> 10 ~m being practically absent in the pure oceanic aerosol. Weather ship
I
IIAkademik I Kurchatovil 1 August 1972 Averaged for the period of TROPEX-72 ITable 2. Atmospheric transparency in the zone of the dust outbreak.
Vertical transparency of T* = SA -n the atmosphere h P2 1"2 n S 0.58tO.69)
o .
545 ( O. 372 ) 0.2 0.34 0.66(0.78) O.416{0.249) 0.6 0.12I
Han zonta 1 transparency of the atmosphere 5M, km (J., , km -1 12 0.250 30 0.100Three dust outbreaks from the African continent were ~ecord~d
A
=
lOoW. In this region, the increase of the atmospheric dust content was mainly associated with the dust transfer from the central and south-western regions of Africa by the so-called harmatan wind.Table j q;ves the value of the atmospheric ootical characteristics
observed under maximum turbidity on the given days and the values averaged over the fi rst and second phases of GATE. As fo 11 m\fS from Table 3, the
most powerful dust outbreak in this region was observed on 11 August (this outbreak has lasted for several days). In this period, both the vertical transparency of the whole atmosphere, and the horizontal trans-parency of the near-water air layer have dropped. Concentration of large aerosol particles Nd > 0.63 ~m, reached 30 cm-3.
As was stated above, the dust flow to the ocean observed on 30 July covered practically the whole area of the ship's location. During that period, a quick strengthening of atmospheric turbidity was recorded, the change being determined by the remoteness of each given point from the African continent.
As follows from Table 3, the optical characteristics of the atmosphere observed on 30 July 1974 at the point with ~
=
0, A=
10oW, are very close to those observed on 1 August 1972 over the "Sea of Darkness" (Table 2).
It must be pointed out that the dust outbreak registered by "Passat" on 15 July was not observed over the "Sea of Darkness" and was thus
obviously generated by the local wind (liharmatan"). The rise of the "n" value with the appearance of African dust should be noticed. The
separate measurements of pure oceanic aerosol showed that aerosol
attenuation in the spectral region of 0.35-1 microns is close to neutral [4, 26], while the intrusion of continental aerosol could increase the
1~:ather-ShiP
IIPassatll cj>=
0, A = lOoW 15 July, 1974 Phase I Average 30 July, 1974 11 August, 1974 J.3 August, 1974 14- August, 1974 Phase II Average-observed under maximum turbidity.
Vertical transparency Horizontal T*
=
BA-ntransparency A f -P2 T2 Sm a. n B --T
*
A= l]lm 0.61(0.72) 0.495(0.328) 17 0.180 0.9 0.29 0.71(0.84 ) 0.342(0.174) 45 0.067 0.2 0.14 0<58(0.69) 0.545(0.372) 16 0.187 0.6 0.30 0.50(0.59) 0.694(0.528) 8.0 0.372-
-0.59(0.70) 0.528(0.356)-
-
0.9 0.22 0.59(0.70) 0.528(0.356)-
-
0.9 0.22 0.68(0.81) 0.386(0.211) 40 0.075 0.8 0.16 --a aerosol attenuation coefficient.
Nd > 0.63 lJm (cm3)-1 15 8.1 23 30 16 14 8.5 I -t::> --'