http://www.diva-portal.org
This is the published version of a paper presented at World Conference on Transport
Research – WCTR 2019, Mumbai.
Citation for the original published paper:
Abdeljaber, O., Younis, A., Alhajyaseen, W. (2020)
Analysis of the Trajectories of Left-turning Vehicles at Signalized Intersections
In: Fusun ULENGİN, Gopal R. PATIL, Ozay OZAYDIN, Lóránt TAVASSZY, Ashish
VERMA (ed.), Recent Advances and Emerging Issues in Transport Research (pp.
1288-1295). Elsevier
Transportation Research Procedia
https://doi.org/10.1016/j.trpro.2020.08.152
N.B. When citing this work, cite the original published paper.
Permanent link to this version:
ScienceDirect
Available online at www.sciencedirect.com
Transportation Research Procedia 48 (2020) 1288–1295
2352-1465 © 2020 The Authors. Published by Elsevier B.V.
This is an open access article under the CC BY-NC-ND license (http://creativecommons.org/licenses/by-nc-nd/4.0/)
Peer-review under responsibility of the scientific committee of the World Conference on Transport Research – WCTR 2019 10.1016/j.trpro.2020.08.152
10.1016/j.trpro.2020.08.152 2352-1465
© 2020 The Authors. Published by Elsevier B.V.
This is an open access article under the CC BY-NC-ND license (http://creativecommons.org/licenses/by-nc-nd/4.0/) Peer-review under responsibility of the scientific committee of the World Conference on Transport Research – WCTR 2019
Available online at www.sciencedirect.com
ScienceDirect
Transportation Research Procedia 00 (2019) 000–000
www.elsevier.com/locate/procedia
2352-1465 © 2020 The Authors. Published by Elsevier B.V.
This is an open access article under the CC BY-NC-ND license (http://creativecommons.org/licenses/by-nc-nd/4.0/) Peer-review under responsibility of the scientific committee of the World Conference on Transport Research – WCTR 2019
World Conference on Transport Research – WCTR 2019, Mumbai, 26-30 May 2019
Analysis of the Trajectories of Left-turning Vehicles
at Signalized Intersections
Osama Abdeljaber
a, Adel Younis
a, Wael Alhajyaseen
b*
a Research Assistant, Deprtment of Civil and Architectural Engineering, College of Engineering, Qatar University, P.O. Box 2713, Doha, Qatar b Faculty, Qatar Transportation and Traffic Safety Center, College of Engineering, Qatar University, P.O. Box 2713, Doha, Qatar
Abstract
Internationally, an annual number of more than a million fatalities are caused by road traffic crashes, with particularly signalized intersections being crash prone locations within the highway system. An accumulation of conflicts between drivers is caused by the different movements (through and turning) from different directions at the intersection; hence, studying the trajectories of turning vehicles is an important step towards improving traffic safety performance of these facilities. In view of that, the current paper aims at providing further insight into the behaviour of left-turning vehicles (right-hand traffic rule) at signalized intersections in the State of Qatar. At first, a total of 44 trajectories of free-flowing vehicles were manually extracted from a recorded video for a single approach of Lekhwair signalized intersection in Doha City, State of Qatar. After that, the extracted trajectories were statistically analysed in an attempt to explore the factors affecting the path of left-turning vehicles at signalized intersections. The results suggest that the characteristics of the extracted paths are significantly related to the vehicle’s entry speed, minimum speed throughout its turning manoeuvre, and the lateral distance between the exit point and the curb (i.e., targeted exit lane). Provided that the speed parameters can be fairly an indication to the driving behaviour, it can be concluded that the driver’s attitude plays an important role in drawing the manoeuvre of a turning vehicle as does the pre-selection of the exit lane. Finally, the effort presented in this paper can be regarded as a way forward towards understanding the behaviour of turning vehicles at signalised intersection in the State of Qatar.
© 2020 The Authors. Published by Elsevier B.V.
This is an open access article under the CC BY-NC-ND license (http://creativecommons.org/licenses/by-nc-nd/4.0/) Peer-review under responsibility of the scientific committee of the World Conference on Transport Research – WCTR 2019
Keywords: Signalized intersections; Vehicle trajectories; Left turning vehicles, Traffic safety; Conflict analysis.
* Corresponding author. Tel.: +974 4403-6679; fax: +974 4403-4302. E-mail address: wyaseen@qu.edu.qa
2 Abdeljaber et al./ Transportation Research Procedia 00 (2019) 000–000
1. Introduction
With a global estimate of 1.4 million fatalities and 73.25 million disabilities due to Road Traffic Crashes (RTCs) on an annual basis, traffic safety is a major issue worldwide (Gao et al., 2016). Up to 1.5% of the gross national product for middle income countries, which equals to approximately 518 billion dollars, is lost to finance the costs of deaths, injuries and disabilities caused by RTCs on an annual basis (Gao et al., 2016). Within the highway system intersections are found to be crash prone locations; for example, 50% of the total RTCs within the urban areas and 30% within the rural areas are crashes occurring at intersections (Zhang et al., 2016). The complexity of intersections is generated by a variety of traffic streams moving in different directions, leading to multiple points of conflict and thereby increasing the risk for traffic crashes (Zhang et al., 2016; Alhajyaseen, 2015). Turning traffic in specific plays a significant role in traffic safety reduction at intersections (Tan et al., 2012). Depending on the geometry of the intersection, the drivers’ instinctive judgment and their targeted exit lane, turning traffic often have major variations in path and speed (Ma & Yang, 2008; Alhajyaseen et al., 2012). For instance, Lui et al. (2013) found that left-turning traffic (right-hand traffic rule) often change their driving routes randomly after they pass the stop line at intersections, that can lead to serious conflicts between drivers which has a negative impact on traffic safety. For that reason, it is required to examine the trajectories of left-turning vehicles in order to identify suitable countermeasures that improve the safety performance at signalized intersections. Several studies have been conducted in the past few decades to grasp, as possible, the turning behavior of vehicles at signalized intersections. In general, significant characteristics concerning the intersection layout and the turning vehicle were highlighted (Reed, 2008; Sando et al., 2009; Stover and Koepke, 2002; Stover, 2008). As an example, Alhajyaseen et al. (2013) underlined that the trajectory of the turning vehicle is strongly related to the intersection’s geometric layout (e.g., intersection angle), the vehicle’s type, and speed. However, it is well-agreed that the turning maneuver of vehicles is a further complex phenomenon whose variability extends to be related to highly-dynamic factors (Gu et al., 2017; Kaysi and Abbany, 2007). For instance, the turning behavior was observed to depend on the inter- and intra-subject factors concerning drivers such as perception of traffic environment, information processing, and the ability to react correctly and to cooperate with others (Moussa et al., 2012; Sun, 2005). Moreover, the driver behavior in built up areas is largely a function of the geometry and layout of the roads, their usage, their location - in other words, urban morphology (Alexander et al., 2002). Other factors such as the waiting time of the turning vehicles (Alexander et al., 2002), relative speed of the vehicles in conflict (Liu et al., 2014), and gaps (Pollatschek et al., 2002) were observed to impact on the decision behavior of turning vehicles.
In this paper, the trajectories of 44 left-turning free-flowing vehicles were extracted from a recorded video of a signalized intersection in the State of Qatar. Spline fitting was used to extract the parameters governing the shape of the turning trajectories. After that, the extracted
parameters were statistically analyzed to understand and model the factors affecting the trajectories of left-turning vehicles.
This document is organized as follows: Section 2 discusses the data collection and trajectory extraction process. Section 3 explains the parameters extracted from the resulting trajectories. The statistical modeling of the extracted parameters is described in Section 4. Finally, Section 5 concludes the paper.
2. Data collection
The south approach of Lekhwair signalized intersection in Doha City, State of Qatar was video-monitored for a duration of two and hours. The video was recorded at a frame rate of 30 fps and a resolution of 3840×2160 pixel. A total of 44 trajectories of left-turning vehicles were extracted from the recorded video. These trajectories are
Osama Abdeljaber et al. / Transportation Research Procedia 48 (2020) 1288–1295 1289 Available online at www.sciencedirect.com
ScienceDirect
Transportation Research Procedia 00 (2019) 000–000
www.elsevier.com/locate/procedia
2352-1465 © 2020 The Authors. Published by Elsevier B.V.
This is an open access article under the CC BY-NC-ND license (http://creativecommons.org/licenses/by-nc-nd/4.0/) Peer-review under responsibility of the scientific committee of the World Conference on Transport Research – WCTR 2019
World Conference on Transport Research – WCTR 2019, Mumbai, 26-30 May 2019
Analysis of the Trajectories of Left-turning Vehicles
at Signalized Intersections
Osama Abdeljaber
a, Adel Younis
a, Wael Alhajyaseen
b*
a Research Assistant, Deprtment of Civil and Architectural Engineering, College of Engineering, Qatar University, P.O. Box 2713, Doha, Qatar b Faculty, Qatar Transportation and Traffic Safety Center, College of Engineering, Qatar University, P.O. Box 2713, Doha, Qatar
Abstract
Internationally, an annual number of more than a million fatalities are caused by road traffic crashes, with particularly signalized intersections being crash prone locations within the highway system. An accumulation of conflicts between drivers is caused by the different movements (through and turning) from different directions at the intersection; hence, studying the trajectories of turning vehicles is an important step towards improving traffic safety performance of these facilities. In view of that, the current paper aims at providing further insight into the behaviour of left-turning vehicles (right-hand traffic rule) at signalized intersections in the State of Qatar. At first, a total of 44 trajectories of free-flowing vehicles were manually extracted from a recorded video for a single approach of Lekhwair signalized intersection in Doha City, State of Qatar. After that, the extracted trajectories were statistically analysed in an attempt to explore the factors affecting the path of left-turning vehicles at signalized intersections. The results suggest that the characteristics of the extracted paths are significantly related to the vehicle’s entry speed, minimum speed throughout its turning manoeuvre, and the lateral distance between the exit point and the curb (i.e., targeted exit lane). Provided that the speed parameters can be fairly an indication to the driving behaviour, it can be concluded that the driver’s attitude plays an important role in drawing the manoeuvre of a turning vehicle as does the pre-selection of the exit lane. Finally, the effort presented in this paper can be regarded as a way forward towards understanding the behaviour of turning vehicles at signalised intersection in the State of Qatar.
© 2020 The Authors. Published by Elsevier B.V.
This is an open access article under the CC BY-NC-ND license (http://creativecommons.org/licenses/by-nc-nd/4.0/) Peer-review under responsibility of the scientific committee of the World Conference on Transport Research – WCTR 2019
Keywords: Signalized intersections; Vehicle trajectories; Left turning vehicles, Traffic safety; Conflict analysis.
* Corresponding author. Tel.: +974 4403-6679; fax: +974 4403-4302. E-mail address: wyaseen@qu.edu.qa
Available online at www.sciencedirect.com
ScienceDirect
Transportation Research Procedia 00 (2019) 000–000
www.elsevier.com/locate/procedia
2352-1465 © 2020 The Authors. Published by Elsevier B.V.
This is an open access article under the CC BY-NC-ND license (http://creativecommons.org/licenses/by-nc-nd/4.0/) Peer-review under responsibility of the scientific committee of the World Conference on Transport Research – WCTR 2019
World Conference on Transport Research – WCTR 2019, Mumbai, 26-30 May 2019
Analysis of the Trajectories of Left-turning Vehicles
at Signalized Intersections
Osama Abdeljaber
a, Adel Younis
a, Wael Alhajyaseen
b*
a Research Assistant, Deprtment of Civil and Architectural Engineering, College of Engineering, Qatar University, P.O. Box 2713, Doha, Qatar b Faculty, Qatar Transportation and Traffic Safety Center, College of Engineering, Qatar University, P.O. Box 2713, Doha, Qatar
Abstract
Internationally, an annual number of more than a million fatalities are caused by road traffic crashes, with particularly signalized intersections being crash prone locations within the highway system. An accumulation of conflicts between drivers is caused by the different movements (through and turning) from different directions at the intersection; hence, studying the trajectories of turning vehicles is an important step towards improving traffic safety performance of these facilities. In view of that, the current paper aims at providing further insight into the behaviour of left-turning vehicles (right-hand traffic rule) at signalized intersections in the State of Qatar. At first, a total of 44 trajectories of free-flowing vehicles were manually extracted from a recorded video for a single approach of Lekhwair signalized intersection in Doha City, State of Qatar. After that, the extracted trajectories were statistically analysed in an attempt to explore the factors affecting the path of left-turning vehicles at signalized intersections. The results suggest that the characteristics of the extracted paths are significantly related to the vehicle’s entry speed, minimum speed throughout its turning manoeuvre, and the lateral distance between the exit point and the curb (i.e., targeted exit lane). Provided that the speed parameters can be fairly an indication to the driving behaviour, it can be concluded that the driver’s attitude plays an important role in drawing the manoeuvre of a turning vehicle as does the pre-selection of the exit lane. Finally, the effort presented in this paper can be regarded as a way forward towards understanding the behaviour of turning vehicles at signalised intersection in the State of Qatar.
© 2020 The Authors. Published by Elsevier B.V.
This is an open access article under the CC BY-NC-ND license (http://creativecommons.org/licenses/by-nc-nd/4.0/) Peer-review under responsibility of the scientific committee of the World Conference on Transport Research – WCTR 2019
Keywords: Signalized intersections; Vehicle trajectories; Left turning vehicles, Traffic safety; Conflict analysis.
* Corresponding author. Tel.: +974 4403-6679; fax: +974 4403-4302. E-mail address: wyaseen@qu.edu.qa
2 Abdeljaber et al./ Transportation Research Procedia 00 (2019) 000–000
1. Introduction
With a global estimate of 1.4 million fatalities and 73.25 million disabilities due to Road Traffic Crashes (RTCs) on an annual basis, traffic safety is a major issue worldwide (Gao et al., 2016). Up to 1.5% of the gross national product for middle income countries, which equals to approximately 518 billion dollars, is lost to finance the costs of deaths, injuries and disabilities caused by RTCs on an annual basis (Gao et al., 2016). Within the highway system intersections are found to be crash prone locations; for example, 50% of the total RTCs within the urban areas and 30% within the rural areas are crashes occurring at intersections (Zhang et al., 2016). The complexity of intersections is generated by a variety of traffic streams moving in different directions, leading to multiple points of conflict and thereby increasing the risk for traffic crashes (Zhang et al., 2016; Alhajyaseen, 2015). Turning traffic in specific plays a significant role in traffic safety reduction at intersections (Tan et al., 2012). Depending on the geometry of the intersection, the drivers’ instinctive judgment and their targeted exit lane, turning traffic often have major variations in path and speed (Ma & Yang, 2008; Alhajyaseen et al., 2012). For instance, Lui et al. (2013) found that left-turning traffic (right-hand traffic rule) often change their driving routes randomly after they pass the stop line at intersections, that can lead to serious conflicts between drivers which has a negative impact on traffic safety. For that reason, it is required to examine the trajectories of left-turning vehicles in order to identify suitable countermeasures that improve the safety performance at signalized intersections. Several studies have been conducted in the past few decades to grasp, as possible, the turning behavior of vehicles at signalized intersections. In general, significant characteristics concerning the intersection layout and the turning vehicle were highlighted (Reed, 2008; Sando et al., 2009; Stover and Koepke, 2002; Stover, 2008). As an example, Alhajyaseen et al. (2013) underlined that the trajectory of the turning vehicle is strongly related to the intersection’s geometric layout (e.g., intersection angle), the vehicle’s type, and speed. However, it is well-agreed that the turning maneuver of vehicles is a further complex phenomenon whose variability extends to be related to highly-dynamic factors (Gu et al., 2017; Kaysi and Abbany, 2007). For instance, the turning behavior was observed to depend on the inter- and intra-subject factors concerning drivers such as perception of traffic environment, information processing, and the ability to react correctly and to cooperate with others (Moussa et al., 2012; Sun, 2005). Moreover, the driver behavior in built up areas is largely a function of the geometry and layout of the roads, their usage, their location - in other words, urban morphology (Alexander et al., 2002). Other factors such as the waiting time of the turning vehicles (Alexander et al., 2002), relative speed of the vehicles in conflict (Liu et al., 2014), and gaps (Pollatschek et al., 2002) were observed to impact on the decision behavior of turning vehicles.
In this paper, the trajectories of 44 left-turning free-flowing vehicles were extracted from a recorded video of a signalized intersection in the State of Qatar. Spline fitting was used to extract the parameters governing the shape of the turning trajectories. After that, the extracted
parameters were statistically analyzed to understand and model the factors affecting the trajectories of left-turning vehicles.
This document is organized as follows: Section 2 discusses the data collection and trajectory extraction process. Section 3 explains the parameters extracted from the resulting trajectories. The statistical modeling of the extracted parameters is described in Section 4. Finally, Section 5 concludes the paper.
2. Data collection
The south approach of Lekhwair signalized intersection in Doha City, State of Qatar was video-monitored for a duration of two and hours. The video was recorded at a frame rate of 30 fps and a resolution of 3840×2160 pixel. A total of 44 trajectories of left-turning vehicles were extracted from the recorded video. These trajectories are
1290 Osama Abdeljaber et al. / Transportation Research Procedia 48 (2020) 1288–1295Abdeljaber et al./ Transportation Research Procedia 00 (2019) 000–000 3
shown in image coordinates in Fig. 1 and in real coordinates in Fig. 2. It is worth mentioning that, here, all extracted trajectories correspond to free-flowing vehicles unimpeded by traffic or pedestrians. In the following sections, these trajectories are analyzed to obtain the key parameters governing the trajectory characteristics. A stochastic model is then created to develop relationships among the extracted parameters.
3. Extraction of trajectory parameters
According to (Alhajyaseen et al., 2013), the trajectory of a left-turning vehicle at a signalized intersection can be represented by a spline consisting of five segments. The spline starts with a straight line followed by an Euler spiral having a curvature profile that varies almost linearly with a gradient of 1/𝐴𝐴𝐴𝐴12. This spiral is followed by a circular segment with a curvature of 1/𝑅𝑅𝑅𝑅min. The end of the spline consists of another Euler spiral having a nearly linear curvature profile with a gradient of −1/𝐴𝐴𝐴𝐴22 followed by a straight line. As shown in Fig. 3, there are four main locations that define the beginning and end of each Euler spiral and circular segments. These locations are basically the points of discontinuity along the curvature profile of the vehicle’s path. Another important parameter can be identified, which is the lateral distance 𝐷𝐷𝐷𝐷𝑒𝑒𝑒𝑒 between the exit point of the second Euler spiral and the left-hand side curb (Fig. 3). This distance reflects the exit lane of a left-turning vehicle.
A Matlab code was written to fit the aforementioned spline to each of the extracted paths in order to identify their governing parameters (𝑅𝑅𝑅𝑅𝑚𝑚𝑚𝑚𝑚𝑚𝑚𝑚𝑚𝑚𝑚𝑚, 𝐴𝐴𝐴𝐴1, 𝐴𝐴𝐴𝐴2, 𝐷𝐷𝐷𝐷𝑒𝑒𝑒𝑒). The code applies the nonlinear programming solver “fmincon” available in Matlab Optimization Toolbox to compute the optimal location of the four key points described in Fig. 3 so that the error between the tracked path and the fitted spline is minimized. Four constraints were imposed to enforce continuity of the fitted spline at the four points. Also, another four constraints were applied to ensure that no sudden jump exists at the key points of the curvature profile. The fitting of the two Euler spirals was conducted according to the approach proposed in Bertolazzi and Frego (2011).
Fig. 4 displays examples of four splines fitted to their actual extracted paths. Moreover, the figure shows the curvature profile of the fitted splines along with the speed profiles of the corresponding trajectories (obtained by applying finite central difference on the extracted trajectories). In addition to 𝑅𝑅𝑅𝑅min, 𝐴𝐴𝐴𝐴1, 𝐴𝐴𝐴𝐴2, and 𝐷𝐷𝐷𝐷𝑒𝑒𝑒𝑒, another two important parameters were extracted from the speed profiles, which are the entry speed 𝑉𝑉𝑉𝑉ent (measured at the beginning of the first Euler spiral) and the minimum speed along the trajectory 𝑉𝑉𝑉𝑉min.
Fig. 2. The extracted trajectories in real-world coordinates.
Osama Abdeljaber et al. / Transportation Research Procedia 48 (2020) 1288–1295 1291
Abdeljaber et al./ Transportation Research Procedia 00 (2019) 000–000 3
shown in image coordinates in Fig. 1 and in real coordinates in Fig. 2. It is worth mentioning that, here, all extracted trajectories correspond to free-flowing vehicles unimpeded by traffic or pedestrians. In the following sections, these trajectories are analyzed to obtain the key parameters governing the trajectory characteristics. A stochastic model is then created to develop relationships among the extracted parameters.
3. Extraction of trajectory parameters
According to (Alhajyaseen et al., 2013), the trajectory of a left-turning vehicle at a signalized intersection can be represented by a spline consisting of five segments. The spline starts with a straight line followed by an Euler spiral having a curvature profile that varies almost linearly with a gradient of 1/𝐴𝐴𝐴𝐴12. This spiral is followed by a circular segment with a curvature of 1/𝑅𝑅𝑅𝑅min. The end of the spline consists of another Euler spiral having a nearly linear curvature profile with a gradient of −1/𝐴𝐴𝐴𝐴22 followed by a straight line. As shown in Fig. 3, there are four main locations that define the beginning and end of each Euler spiral and circular segments. These locations are basically the points of discontinuity along the curvature profile of the vehicle’s path. Another important parameter can be identified, which is the lateral distance 𝐷𝐷𝐷𝐷𝑒𝑒𝑒𝑒 between the exit point of the second Euler spiral and the left-hand side curb (Fig. 3). This distance reflects the exit lane of a left-turning vehicle.
A Matlab code was written to fit the aforementioned spline to each of the extracted paths in order to identify their governing parameters (𝑅𝑅𝑅𝑅𝑚𝑚𝑚𝑚𝑚𝑚𝑚𝑚𝑚𝑚𝑚𝑚, 𝐴𝐴𝐴𝐴1, 𝐴𝐴𝐴𝐴2, 𝐷𝐷𝐷𝐷𝑒𝑒𝑒𝑒). The code applies the nonlinear programming solver “fmincon” available in Matlab Optimization Toolbox to compute the optimal location of the four key points described in Fig. 3 so that the error between the tracked path and the fitted spline is minimized. Four constraints were imposed to enforce continuity of the fitted spline at the four points. Also, another four constraints were applied to ensure that no sudden jump exists at the key points of the curvature profile. The fitting of the two Euler spirals was conducted according to the approach proposed in Bertolazzi and Frego (2011).
Fig. 4 displays examples of four splines fitted to their actual extracted paths. Moreover, the figure shows the curvature profile of the fitted splines along with the speed profiles of the corresponding trajectories (obtained by applying finite central difference on the extracted trajectories). In addition to 𝑅𝑅𝑅𝑅min, 𝐴𝐴𝐴𝐴1, 𝐴𝐴𝐴𝐴2, and 𝐷𝐷𝐷𝐷𝑒𝑒𝑒𝑒, another two important parameters were extracted from the speed profiles, which are the entry speed 𝑉𝑉𝑉𝑉ent (measured at the beginning of the first Euler spiral) and the minimum speed along the trajectory 𝑉𝑉𝑉𝑉min.
Fig. 2. The extracted trajectories in real-world coordinates.
Turning Direction
4 Abdeljaber et al./ Transportation Research Procedia 00 (2019) 000–000
Fig. 3. Components of the spline used for trajectory curve fitting.
Fig. 4. Examples of the curve fitting process showing the fitted splines and their curvature profiles along with the speed profiles.
-50 -25 0 25 50 X (m) -80 -60 -40 -20 Y (m)
Extracted Trajectory Fitted Spline Key Points
-50 -25 0 25 50 X (m) 0 0.02 0.04 Curvature (1/m) -50 -25 0 25 50 X (m) 30 40 50 Speed (km/hr) -50 -25 0 25 50 X (m) -80 -60 -40 -20 Y (m) -50 -25 0 25 50 X (m) 0 0.02 0.04 Curvature (1/m) -50 -25 0 25 50 X (m) 30 40 50 Speed (km/hr) -50 -25 0 25 50 X (m) -80 -60 -40 -20 Y (m) -50 -25 0 25 50 X (m) 0 0.02 0.04 Curvature (1/m) -50 -25 0 25 50 X (m) 35 40 45 50 55 Speed (km/hr) -50 -25 0 25 50 X (m) -80 -60 -40 -20 Y (m) -50 -25 0 25 50 X (m) 0 0.02 0.04 Curvature (1/m) -50 -25 0 25 50 X (m) 35 40 45 50 55 Speed (km/hr)
1292 Abdeljaber et al./ Transportation Research Procedia 00 (2019) 000–000 Osama Abdeljaber et al. / Transportation Research Procedia 48 (2020) 1288–1295 5
4. Statistical analysis
The Matlab code explained in Section 3 was used to estimate the six parameters of the extracted trajectories. The probability distributions of these parameters are displayed in Fig. 5. As shown in the figure, a normal distribution was fitted for each parameter. One-sample Kolmogorov-Smirnov test (95% confidence level) showed that each of the six parameters follows a normal distribution, of which the mean and standard deviation are presented in Table 1.
The results given in Table 1 demonstrate the geometric variations of the extracted paths. As shown in Fig. 2, the monitored approach of the intersection has a single-entry lane and three exit lanes. Therefore, a considerable variation can be observed in the distribution of the exit points 𝐷𝐷𝐷𝐷𝑒𝑒𝑒𝑒 since the drivers are allowed to exit the intersection from any of these three lanes. However, the distribution of 𝐷𝐷𝐷𝐷𝑒𝑒𝑒𝑒 shows that around 70% of the drivers preferred the middle lane. Also, it can be noticed that the coefficient of variation increases along the trajectory from 8.82% at the first Euler spiral to 11.02% at the circular segment to 26.9% at the exit Euler spiral. In other words, the variation of the spline segments close to the exit point are much higher than that of segments near the entry point. This significant variation can be attributed to the large size of the intersection and the fact that the exit approach has three lanes, as opposed to the single left-turning lane at the entry approach.
Fig. 5. Probability distribution of the six extracted parameters across the 44 trajectories. Table 1. Mean, standard deviation, and coefficient of variation of the parameters’ distribution.
Statistic 𝑅𝑅𝑅𝑅min (m) 𝐴𝐴𝐴𝐴1 (m) 𝐴𝐴𝐴𝐴2 (m) 𝐷𝐷𝐷𝐷𝑒𝑒𝑒𝑒 (m) 𝑉𝑉𝑉𝑉ent (km/hr) 𝑉𝑉𝑉𝑉min (km/hr)
𝜇𝜇𝜇𝜇 28.14 36.28 21.08 5.13 46.75 31.92
𝜎𝜎𝜎𝜎 3.10 3.20 5.67 1.30 5.03 3.29
CoV (%) 11.02 8.82 26.9 25.34 10.76 10.31
6 Abdeljaber et al./ Transportation Research Procedia 00 (2019) 000–000
4.1. Modelling of the variations in paths
Based on the parameters computed from the extracted trajectories, three multiple regression models were created to identify the factors affecting the paths of left-turning vehicles at the monitored approach. The output variables of the model were the distributions of 𝑅𝑅𝑅𝑅min, 𝐴𝐴𝐴𝐴1, and 𝐴𝐴𝐴𝐴2, while the explanatory variables were the entry speed 𝑉𝑉𝑉𝑉ent, the minimum speed 𝑉𝑉𝑉𝑉min, and the distance from the exit point to the curb 𝐷𝐷𝐷𝐷𝑒𝑒𝑒𝑒. Assuming a normal distribution, the mean of the 𝑖𝑖𝑖𝑖𝑡𝑡𝑡𝑡ℎ output variable 𝑃𝑃𝑃𝑃𝑚𝑚𝑚𝑚 can be written as:
𝜇𝜇𝜇𝜇(𝑃𝑃𝑃𝑃𝑚𝑚𝑚𝑚) = 𝛽𝛽𝛽𝛽0,𝑚𝑚𝑚𝑚+ 𝛽𝛽𝛽𝛽1,𝑚𝑚𝑚𝑚𝐷𝐷𝐷𝐷𝑒𝑒𝑒𝑒+ 𝛽𝛽𝛽𝛽2,𝑚𝑚𝑚𝑚𝑉𝑉𝑉𝑉ent+ 𝛽𝛽𝛽𝛽3,𝑚𝑚𝑚𝑚𝑉𝑉𝑉𝑉min (1) where 𝜇𝜇𝜇𝜇 is the mean of the normal distribution and 𝛽𝛽𝛽𝛽0,𝑚𝑚𝑚𝑚, … , 𝛽𝛽𝛽𝛽3,𝑚𝑚𝑚𝑚 are the model coefficients obtained by the maximum likelihood method. IBM SPSS Statistics package (2008) was used to compute the parameters of the three models. The results are shown in Table 2.
Table 2. Coefficients of the three multiple regression models. Explanatory
variables
𝑅𝑅𝑅𝑅min (m) 𝐴𝐴𝐴𝐴1 (m) 𝐴𝐴𝐴𝐴2 (m)
𝛽𝛽𝛽𝛽 Std. error t-value Sig. 𝛽𝛽𝛽𝛽 Std. error t-value Sig. 𝛽𝛽𝛽𝛽 Std. error t-value Sig.
Constant 15.111 3.494 4.325 0.000 32.445 5.336 6.080 0.000 -4.269 7.178 -0.595 0.555 𝐷𝐷𝐷𝐷𝑒𝑒𝑒𝑒 1.128 0.258 4.366 0.000 0.680 0.395 1.723 0.093 2.571 0.531 4.842 0.000 𝑉𝑉𝑉𝑉ent -0.212 0.073 -2.911 0.006 0.089 0.111 0.796 0.431 0.022 0.150 0.147 0.884 𝑉𝑉𝑉𝑉min 0.537 0.116 4.644 0.000 -0.119 0.177 -0.673 0.505 0.349 0.238 1.468 0.150 Sample size 44 44 44 Adjusted 𝑅𝑅𝑅𝑅2 0.552 0.293 0.473
The resulting models show that the geometric variations of the extracted paths, represented by the fitted spline parameters 𝑅𝑅𝑅𝑅min, 𝐴𝐴𝐴𝐴1, and 𝐴𝐴𝐴𝐴2, are significantly dependent on the variables 𝐷𝐷𝐷𝐷𝑒𝑒𝑒𝑒, 𝑉𝑉𝑉𝑉ent, and 𝑉𝑉𝑉𝑉min. The computed t-values show that there is a significant correlation between the radius of the circular curve 𝑅𝑅𝑅𝑅min and all three output variables. Furthermore, it can be observed the variable 𝐴𝐴𝐴𝐴2, associated with the second Euler curve, depends mostly on the variable 𝐷𝐷𝐷𝐷𝑒𝑒𝑒𝑒 which reflects the exit lane. However, the output 𝐴𝐴𝐴𝐴1 (i.e. the parameter of the entry Euler spiral) relatively exhibited a lower correlation with the three explanatory variables. Provided a free-flowing trajectory, the speed parameters can somehow indicate the aggressiveness of the drivers and therefore, it can be said that the driver’s behaviour and the selected exit lane influence on the trajectory of the turning vehicle.
4.2. Comparison between simulated and observed tracks
Monte-Carlo simulation with 500 trials was conducted using the models explained in Table 2. In each trial, the three models were used to compute 𝑅𝑅𝑅𝑅min, 𝐴𝐴𝐴𝐴1, and 𝐴𝐴𝐴𝐴2 based on random values of 𝐷𝐷𝐷𝐷𝑒𝑒𝑒𝑒, 𝑉𝑉𝑉𝑉ent, and 𝑉𝑉𝑉𝑉min which were generated according to the normal distributions described in Fig. 5 and Table 1. The resulting spline parameters were then used to obtain the simulated trajectories shown in Fig. 6. As shown in the figure, three cross-sections were considered along the path of left-turning vehicle. The distribution of the simulated paths was computed along each cross-section. Similarly, the distribution of the observed trajectories was analysed along the same cross-sections. Both observed and simulated distributions are displayed in Fig. 7. After that, Kolmogorov–Smirnov test (with 95% confidence level) was conducted to compare between the observed and simulated distributions. It was found that the simulated distributions at the three cross-sections are not significantly different from the observed counterparts.
Osama Abdeljaber et al. / Transportation Research Procedia 48 (2020) 1288–1295 1293
Abdeljaber et al./ Transportation Research Procedia 00 (2019) 000–000 5
4. Statistical analysis
The Matlab code explained in Section 3 was used to estimate the six parameters of the extracted trajectories. The probability distributions of these parameters are displayed in Fig. 5. As shown in the figure, a normal distribution was fitted for each parameter. One-sample Kolmogorov-Smirnov test (95% confidence level) showed that each of the six parameters follows a normal distribution, of which the mean and standard deviation are presented in Table 1.
The results given in Table 1 demonstrate the geometric variations of the extracted paths. As shown in Fig. 2, the monitored approach of the intersection has a single-entry lane and three exit lanes. Therefore, a considerable variation can be observed in the distribution of the exit points 𝐷𝐷𝐷𝐷𝑒𝑒𝑒𝑒 since the drivers are allowed to exit the intersection from any of these three lanes. However, the distribution of 𝐷𝐷𝐷𝐷𝑒𝑒𝑒𝑒 shows that around 70% of the drivers preferred the middle lane. Also, it can be noticed that the coefficient of variation increases along the trajectory from 8.82% at the first Euler spiral to 11.02% at the circular segment to 26.9% at the exit Euler spiral. In other words, the variation of the spline segments close to the exit point are much higher than that of segments near the entry point. This significant variation can be attributed to the large size of the intersection and the fact that the exit approach has three lanes, as opposed to the single left-turning lane at the entry approach.
Fig. 5. Probability distribution of the six extracted parameters across the 44 trajectories. Table 1. Mean, standard deviation, and coefficient of variation of the parameters’ distribution.
Statistic 𝑅𝑅𝑅𝑅min (m) 𝐴𝐴𝐴𝐴1 (m) 𝐴𝐴𝐴𝐴2 (m) 𝐷𝐷𝐷𝐷𝑒𝑒𝑒𝑒 (m) 𝑉𝑉𝑉𝑉ent (km/hr) 𝑉𝑉𝑉𝑉min (km/hr)
𝜇𝜇𝜇𝜇 28.14 36.28 21.08 5.13 46.75 31.92
𝜎𝜎𝜎𝜎 3.10 3.20 5.67 1.30 5.03 3.29
CoV (%) 11.02 8.82 26.9 25.34 10.76 10.31
6 Abdeljaber et al./ Transportation Research Procedia 00 (2019) 000–000
4.1. Modelling of the variations in paths
Based on the parameters computed from the extracted trajectories, three multiple regression models were created to identify the factors affecting the paths of left-turning vehicles at the monitored approach. The output variables of the model were the distributions of 𝑅𝑅𝑅𝑅min, 𝐴𝐴𝐴𝐴1, and 𝐴𝐴𝐴𝐴2, while the explanatory variables were the entry speed 𝑉𝑉𝑉𝑉ent, the minimum speed 𝑉𝑉𝑉𝑉min, and the distance from the exit point to the curb 𝐷𝐷𝐷𝐷𝑒𝑒𝑒𝑒. Assuming a normal distribution, the mean of the 𝑖𝑖𝑖𝑖𝑡𝑡𝑡𝑡ℎ output variable 𝑃𝑃𝑃𝑃
𝑚𝑚𝑚𝑚 can be written as:
𝜇𝜇𝜇𝜇(𝑃𝑃𝑃𝑃𝑚𝑚𝑚𝑚) = 𝛽𝛽𝛽𝛽0,𝑚𝑚𝑚𝑚+ 𝛽𝛽𝛽𝛽1,𝑚𝑚𝑚𝑚𝐷𝐷𝐷𝐷𝑒𝑒𝑒𝑒+ 𝛽𝛽𝛽𝛽2,𝑚𝑚𝑚𝑚𝑉𝑉𝑉𝑉ent+ 𝛽𝛽𝛽𝛽3,𝑚𝑚𝑚𝑚𝑉𝑉𝑉𝑉min (1) where 𝜇𝜇𝜇𝜇 is the mean of the normal distribution and 𝛽𝛽𝛽𝛽0,𝑚𝑚𝑚𝑚, … , 𝛽𝛽𝛽𝛽3,𝑚𝑚𝑚𝑚 are the model coefficients obtained by the maximum likelihood method. IBM SPSS Statistics package (2008) was used to compute the parameters of the three models. The results are shown in Table 2.
Table 2. Coefficients of the three multiple regression models. Explanatory
variables
𝑅𝑅𝑅𝑅min (m) 𝐴𝐴𝐴𝐴1 (m) 𝐴𝐴𝐴𝐴2 (m)
𝛽𝛽𝛽𝛽 Std. error t-value Sig. 𝛽𝛽𝛽𝛽 Std. error t-value Sig. 𝛽𝛽𝛽𝛽 Std. error t-value Sig.
Constant 15.111 3.494 4.325 0.000 32.445 5.336 6.080 0.000 -4.269 7.178 -0.595 0.555 𝐷𝐷𝐷𝐷𝑒𝑒𝑒𝑒 1.128 0.258 4.366 0.000 0.680 0.395 1.723 0.093 2.571 0.531 4.842 0.000 𝑉𝑉𝑉𝑉ent -0.212 0.073 -2.911 0.006 0.089 0.111 0.796 0.431 0.022 0.150 0.147 0.884 𝑉𝑉𝑉𝑉min 0.537 0.116 4.644 0.000 -0.119 0.177 -0.673 0.505 0.349 0.238 1.468 0.150 Sample size 44 44 44 Adjusted 𝑅𝑅𝑅𝑅2 0.552 0.293 0.473
The resulting models show that the geometric variations of the extracted paths, represented by the fitted spline parameters 𝑅𝑅𝑅𝑅min, 𝐴𝐴𝐴𝐴1, and 𝐴𝐴𝐴𝐴2, are significantly dependent on the variables 𝐷𝐷𝐷𝐷𝑒𝑒𝑒𝑒, 𝑉𝑉𝑉𝑉ent, and 𝑉𝑉𝑉𝑉min. The computed t-values show that there is a significant correlation between the radius of the circular curve 𝑅𝑅𝑅𝑅min and all three output variables. Furthermore, it can be observed the variable 𝐴𝐴𝐴𝐴2, associated with the second Euler curve, depends mostly on the variable 𝐷𝐷𝐷𝐷𝑒𝑒𝑒𝑒 which reflects the exit lane. However, the output 𝐴𝐴𝐴𝐴1 (i.e. the parameter of the entry Euler spiral) relatively exhibited a lower correlation with the three explanatory variables. Provided a free-flowing trajectory, the speed parameters can somehow indicate the aggressiveness of the drivers and therefore, it can be said that the driver’s behaviour and the selected exit lane influence on the trajectory of the turning vehicle.
4.2. Comparison between simulated and observed tracks
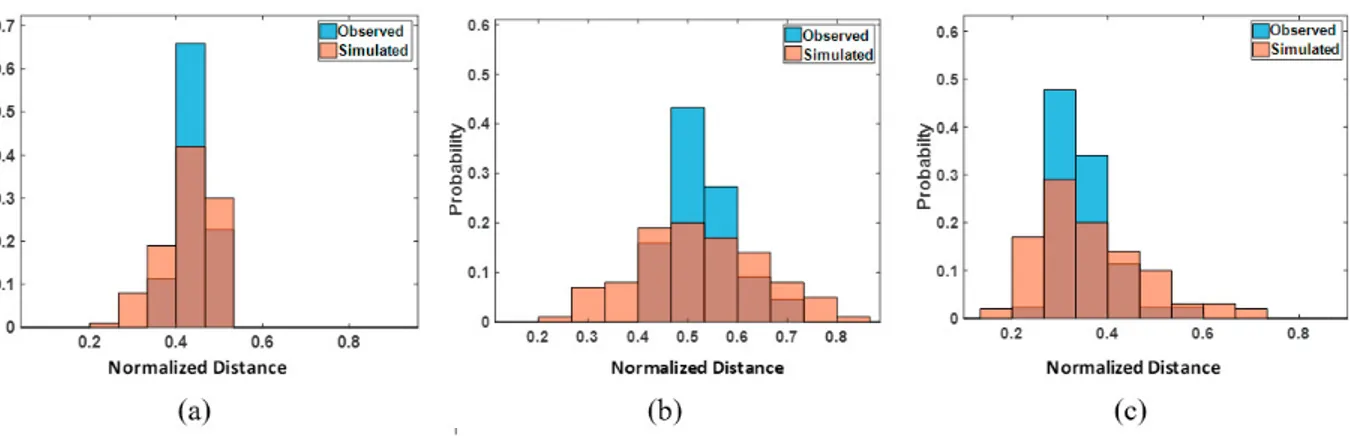
Monte-Carlo simulation with 500 trials was conducted using the models explained in Table 2. In each trial, the three models were used to compute 𝑅𝑅𝑅𝑅min, 𝐴𝐴𝐴𝐴1, and 𝐴𝐴𝐴𝐴2 based on random values of 𝐷𝐷𝐷𝐷𝑒𝑒𝑒𝑒, 𝑉𝑉𝑉𝑉ent, and 𝑉𝑉𝑉𝑉min which were generated according to the normal distributions described in Fig. 5 and Table 1. The resulting spline parameters were then used to obtain the simulated trajectories shown in Fig. 6. As shown in the figure, three cross-sections were considered along the path of left-turning vehicle. The distribution of the simulated paths was computed along each cross-section. Similarly, the distribution of the observed trajectories was analysed along the same cross-sections. Both observed and simulated distributions are displayed in Fig. 7. After that, Kolmogorov–Smirnov test (with 95% confidence level) was conducted to compare between the observed and simulated distributions. It was found that the simulated distributions at the three cross-sections are not significantly different from the observed counterparts.
1294 Osama Abdeljaber et al. / Transportation Research Procedia 48 (2020) 1288–1295
Abdeljaber et al./ Transportation Research Procedia 00 (2019) 000–000 7
Fig. 6. Simulated paths of left-turning vehicles.
Fig. 7. Comparison between observed and simulated distributions at: (a) cross-section 1, (b) cross-section 2, and (c) cross-section 3.
5. Conclusion
In this paper, a total of 44 trajectories of left-turning vehicles were extracted from a recorded video of a signalized intersection located in Doha City, State of Qatar. The trajectories were then statistically analysed in order to identify the factors that impose the variation in paths of the left-turning vehicles at the monitored intersection. Wide variations in the paths of turning vehicles lead to larger conflict areas and thus more safety risks. The results showed that the geometry of the vehicle’s path depends significantly on the entry speed, minimum speed throughout the manoeuvre, and the lateral distance between the exit point and the curb (i.e., choice of exit lane). The demonstration of the significance of the speed parameters suggests the likely effect of the driving attitude on the turning vehicle’s path. Nonetheless, in order to provide deeper insight into the turning behaviour at signalized intersections in the state of Qatar, it is highly recommended to analyse a larger number of trajectories extracted from several intersections.
Acknowledgements
Special thanks are due to Dr. Deepti Muley for providing the recorded video used in the current paper.
2
3
1
8 Abdeljaber et al./ Transportation Research Procedia 00 (2019) 000–000
References
Alexander, J., Barham, P., Black, I., 2002. Factors influencing the probability of an incident at a junction: Results from an interactive driving simulator. Accid. Anal. Prev. 34, 779–792. https://doi.org/10.1016/S0001-4575(01)00078-1
Alhajyaseen, W. K., 2015. The integration of conflict probability and severity for the safety assessment of intersections. Arabian Journal for Science and Engineering, 40(2), 421-430. https://doi.org/10.1007/s13369-014-1553-1
Alhajyaseen, W.K.M., Asano, M., Nakamura, H., Tan, D.M., 2013. Stochastic approach for modeling the effects of intersection geometry on turning vehicle paths. Transp. Res. Part C Emerg. Technol. 32, 179–192. https://doi.org/10.1016/j.trc.2012.09.006
Alhajyaseen, W. K., Asano, M., & Nakamura, H. (2012). Estimation of left-turning vehicle maneuvers for the assessment of pedestrian safety at intersections. IATSS research, 36(1), 66-74. https://doi.org/10.1016/j.iatssr.2012.03.002
Bertolazzi, E., Frego, M., 2011. Fast and accurate clothoid fitting. Proc. 14th Int. Conf. Artif. Intell. Stat. 15, 434–442. https://doi.org/10.1145/0000000.0000000
Gao, J., Chen, X., Woodward, A., Liu, X., Wu, H., Lu, Y., Li, L., Liu, Q., 2016. The association between meteorological factors and road traffic injuries: A case analysis from Shantou city, China. Sci. Rep. 6, 37300. https://doi.org/10.1038/srep37300
Gu, Y., Hashimoto, Y., Hsu, L.T., Iryo-Asano, M., Kamijo, S., 2017. Human-like motion planning model for driving in signalized intersections. IATSS Res. 41, 129–139. https://doi.org/10.1016/j.iatssr.2016.11.002
IBM, 2008. SPSS: Statistical Package for the Social Sciences. Data Anal. Softw. Packag.
Kaysi, I.A., Abbany, A.S., 2007. Modeling aggressive driver behavior at unsignalized intersections. Accid. Anal. Prev. 39, 671–678. https://doi.org/10.1016/j.aap.2006.10.013
Liu, M., Lu, G., Wang, Y., Wang, Y., Zhang, Z., 2014. Preempt or yield? An analysis of driver’s dynamic decision making at unsignalized intersections by classification tree. Saf. Sci. 65, 36–44. https://doi.org/10.1016/j.ssci.2013.12.009
Liu, P., Xu, C., Wang, W., Wan, J., 2013. Identifying factors affecting drivers’ selection of unconventional outside left-turn lanes at signallised intersections. Iet Intell. Transp. Syst. 7, 396–403. https://doi.org/10.1049/iet-its.2011.0229
Ma, W., Yang, X., 2008. Coordination design of left movements of signalized intersections group. Tongji Daxue Xuebao/Journal Tongji Univ. 36, 1507–1511.
Moussa, G., Radwan, E., Hussain, K., 2012. Augmented Reality Vehicle system: Left-turn maneuver study. Transp. Res. Part C Emerg. Technol. 21, 1–16. https://doi.org/10.1016/j.trc.2011.08.005
Pollatschek, M.A., Polus, A., Livneh, M., 2002. A decision model for gap acceptance and capacity at intersections. Transp. Res. Part B Methodol. 36, 649–663. https://doi.org/10.1016/S0191-2615(01)00024-8
Reed, M., 2008. Intersection Kinematics: A Pilot Study of Driver Turning Behavior Obscuration By A-Pillars, Report No. UMTRI-2008-54. https://doi.org/UMTRI-2008-54
Sando, T., Ph, D., Moses, R., 2009. Influence of Intersection Geometrics on the Operation of Triple Left-Turn Lanes. J. Transp. Eng. 135, 253– 259. https://doi.org/10.1061/(ASCE)TE.1943-5436.0000005
Stover, V.G.., Koepke, F.J., 2002. Transportation and Land Development.
Stover, V.G., 2008. Issues Relating to the Geometric Design of Intersections. Proc. 8th Int. Conf. ACCESS Manag.
Sun, R., 2005. Cognition and multi-agent interaction: From cognitive modeling to social simulation, Cognition and Multi-Agent Interaction: From Cognitive Modeling to Social Simulation. Cambridge University Press. https://doi.org/10.1017/CBO9780511610721
Tan, D. M., Alhajyaseen, W. K., Asano, M., Nakamura, H., 2012. Development of microscopic traffic simulation model for safety assessment at signalized intersections. Transportation Research Record, 2316(1), 122-131. https://doi.org/10.3141/2316-14
Zhang, G., Qi, Y., Chen, J., 2016. Exploring Factors Impacting Paths of Left-Turning Vehicles from Minor Road Approach at Unsignalized Intersections. Math. Probl. Eng. 2016, 1305890. https://doi.org/10.1155/2016/1305890
Osama Abdeljaber et al. / Transportation Research Procedia 48 (2020) 1288–1295 1295
Abdeljaber et al./ Transportation Research Procedia 00 (2019) 000–000 7
Fig. 6. Simulated paths of left-turning vehicles.
Fig. 7. Comparison between observed and simulated distributions at: (a) cross-section 1, (b) cross-section 2, and (c) cross-section 3.
5. Conclusion
In this paper, a total of 44 trajectories of left-turning vehicles were extracted from a recorded video of a signalized intersection located in Doha City, State of Qatar. The trajectories were then statistically analysed in order to identify the factors that impose the variation in paths of the left-turning vehicles at the monitored intersection. Wide variations in the paths of turning vehicles lead to larger conflict areas and thus more safety risks. The results showed that the geometry of the vehicle’s path depends significantly on the entry speed, minimum speed throughout the manoeuvre, and the lateral distance between the exit point and the curb (i.e., choice of exit lane). The demonstration of the significance of the speed parameters suggests the likely effect of the driving attitude on the turning vehicle’s path. Nonetheless, in order to provide deeper insight into the turning behaviour at signalized intersections in the state of Qatar, it is highly recommended to analyse a larger number of trajectories extracted from several intersections.
Acknowledgements
Special thanks are due to Dr. Deepti Muley for providing the recorded video used in the current paper.
2
3
1
8 Abdeljaber et al./ Transportation Research Procedia 00 (2019) 000–000
References
Alexander, J., Barham, P., Black, I., 2002. Factors influencing the probability of an incident at a junction: Results from an interactive driving simulator. Accid. Anal. Prev. 34, 779–792. https://doi.org/10.1016/S0001-4575(01)00078-1
Alhajyaseen, W. K., 2015. The integration of conflict probability and severity for the safety assessment of intersections. Arabian Journal for Science and Engineering, 40(2), 421-430. https://doi.org/10.1007/s13369-014-1553-1
Alhajyaseen, W.K.M., Asano, M., Nakamura, H., Tan, D.M., 2013. Stochastic approach for modeling the effects of intersection geometry on turning vehicle paths. Transp. Res. Part C Emerg. Technol. 32, 179–192. https://doi.org/10.1016/j.trc.2012.09.006
Alhajyaseen, W. K., Asano, M., & Nakamura, H. (2012). Estimation of left-turning vehicle maneuvers for the assessment of pedestrian safety at intersections. IATSS research, 36(1), 66-74. https://doi.org/10.1016/j.iatssr.2012.03.002
Bertolazzi, E., Frego, M., 2011. Fast and accurate clothoid fitting. Proc. 14th Int. Conf. Artif. Intell. Stat. 15, 434–442. https://doi.org/10.1145/0000000.0000000
Gao, J., Chen, X., Woodward, A., Liu, X., Wu, H., Lu, Y., Li, L., Liu, Q., 2016. The association between meteorological factors and road traffic injuries: A case analysis from Shantou city, China. Sci. Rep. 6, 37300. https://doi.org/10.1038/srep37300
Gu, Y., Hashimoto, Y., Hsu, L.T., Iryo-Asano, M., Kamijo, S., 2017. Human-like motion planning model for driving in signalized intersections. IATSS Res. 41, 129–139. https://doi.org/10.1016/j.iatssr.2016.11.002
IBM, 2008. SPSS: Statistical Package for the Social Sciences. Data Anal. Softw. Packag.
Kaysi, I.A., Abbany, A.S., 2007. Modeling aggressive driver behavior at unsignalized intersections. Accid. Anal. Prev. 39, 671–678. https://doi.org/10.1016/j.aap.2006.10.013
Liu, M., Lu, G., Wang, Y., Wang, Y., Zhang, Z., 2014. Preempt or yield? An analysis of driver’s dynamic decision making at unsignalized intersections by classification tree. Saf. Sci. 65, 36–44. https://doi.org/10.1016/j.ssci.2013.12.009
Liu, P., Xu, C., Wang, W., Wan, J., 2013. Identifying factors affecting drivers’ selection of unconventional outside left-turn lanes at signallised intersections. Iet Intell. Transp. Syst. 7, 396–403. https://doi.org/10.1049/iet-its.2011.0229
Ma, W., Yang, X., 2008. Coordination design of left movements of signalized intersections group. Tongji Daxue Xuebao/Journal Tongji Univ. 36, 1507–1511.
Moussa, G., Radwan, E., Hussain, K., 2012. Augmented Reality Vehicle system: Left-turn maneuver study. Transp. Res. Part C Emerg. Technol. 21, 1–16. https://doi.org/10.1016/j.trc.2011.08.005
Pollatschek, M.A., Polus, A., Livneh, M., 2002. A decision model for gap acceptance and capacity at intersections. Transp. Res. Part B Methodol. 36, 649–663. https://doi.org/10.1016/S0191-2615(01)00024-8
Reed, M., 2008. Intersection Kinematics: A Pilot Study of Driver Turning Behavior Obscuration By A-Pillars, Report No. UMTRI-2008-54. https://doi.org/UMTRI-2008-54
Sando, T., Ph, D., Moses, R., 2009. Influence of Intersection Geometrics on the Operation of Triple Left-Turn Lanes. J. Transp. Eng. 135, 253– 259. https://doi.org/10.1061/(ASCE)TE.1943-5436.0000005
Stover, V.G.., Koepke, F.J., 2002. Transportation and Land Development.
Stover, V.G., 2008. Issues Relating to the Geometric Design of Intersections. Proc. 8th Int. Conf. ACCESS Manag.
Sun, R., 2005. Cognition and multi-agent interaction: From cognitive modeling to social simulation, Cognition and Multi-Agent Interaction: From Cognitive Modeling to Social Simulation. Cambridge University Press. https://doi.org/10.1017/CBO9780511610721
Tan, D. M., Alhajyaseen, W. K., Asano, M., Nakamura, H., 2012. Development of microscopic traffic simulation model for safety assessment at signalized intersections. Transportation Research Record, 2316(1), 122-131. https://doi.org/10.3141/2316-14
Zhang, G., Qi, Y., Chen, J., 2016. Exploring Factors Impacting Paths of Left-Turning Vehicles from Minor Road Approach at Unsignalized Intersections. Math. Probl. Eng. 2016, 1305890. https://doi.org/10.1155/2016/1305890