Attitudes towards participation
in business development
programmes
An ethnic comparison in Sweden
Saeid Abbasian
Department of Tourism Studies and Geography, Mid Sweden University, Östersund, Sweden, and
Darush Yazdanfar
Department of Business, Economics and Law, Mid Sweden University, Östersund, Sweden
Abstract
Purpose – The aim of the study is to investigate whether there are any differences between the attitudes towards participation in development programmes of entrepreneurs who are immigrants and those who are native-born.
Design/methodology/approach – Several statistical methods, including a binary logistic regression model, were used to analyse a unique, firm-level dataset collected by the Swedish Small Business Forum in October and November 2012. The dataset was based on a questionnaire composed of 60 closed questions that was completed by 531 participants representing 395 companies.
Findings – Based on the analysis of 15 different attitude variables, the empirical findings are that immigrant managers/owners are more likely to show a positive attitude to participation in development programmes, in terms of nine of those attitude variables, than their native counterparts. Because there are no data about second generation of immigrants in the sample, thus, this category may have had an impact on the results. However, there is no possibility to identify any impact on the results.
Originality/value – There is no prior research focusing specifically on this question, and to the authors’ knowledge, this study is the first that has attempted to deal with the issue. This study is based on a recent and unique database, and provides new evidence on the relationship between ethnicity and attitude towards participation in development programmes among entrepreneurs. Its context is different from that of prior research.
Keywords Business training and development programmes, Ethnic businesses Paper type Research paper
1. Introduction
Immigrant businesses are widespread in European countries, and there is a good attitude towards immigrant entrepreneurship from both governments and host societies (European Commission, 2008;Rezania and Önal, 2009).
Twenty per cent of the Swedish population are of immigrant origin, i.e. immigrants of first and second generation (Statistics Sweden Population, 2012). Some of these people are unemployed, while those who are employed either have a job in the ordinary labour market or have created their own jobs by starting a business. According to the the International Business Association of Sweden (IFS), 20 per cent of all newly started
The current issue and full text archive of this journal is available on Emerald Insight at: www.emeraldinsight.com/2046-9012.htm
Business
development
programmes
59
Received 6 February 2014 Revised 24 July 2014 Accepted 27 July 2014European Journal of Training and Development Vol. 39 No. 1, 2015 pp. 59-75 © Emerald Group Publishing Limited 2046-9012
businesses in Sweden have been started by immigrants (IFS, 2013). Tillväxtverket (the Swedish Agency for Economic and Regional Growth) reports that people of immigrant origin are keener than native-born Swedes to start businesses and become entrepreneurs (Tillväxtverket, 2013). The same tendency is also found in other Organisation for Economic Co-operation and Development countries (OECD, 2010). The main reason for the Swedish finding is that people of immigrant origin have got less attractive job opportunities in the labour market than native-born Swedes, so that running their own businesses is a good substitute (Tillväxtverket, 2013). They are, in other words, “necessity entrepreneurs” (Chrysostome, 2010). The question for us as researchers, however, is how to help these unprivileged potential business owners to become entrepreneurs or, if they are already entrepreneurs, how to help them to become better. Regardless of the reasons behind the lack of attractive employment for immigrants in Sweden, one risk factor for bankruptcy for all entrepreneurs in Sweden has been a lack of business knowledge (Westholm et al., 2003). As a result, we can suppose that if these immigrant individuals had more knowledge of business, they might increase their chances of survival, and would have better performance and, we would hope, more growth and employees in the long term. On the other hand, failure in entrepreneurship can be considered as a part of the learning process of entrepreneurship, regardless of ethnicity (Murray and White, 1986).
Normally, small business owners in Sweden, including those of immigrant origin, have access to sporadic or regular training and development programmes offered by various governmental authorities like ALMI företagspartner, Nyföretagarcentrum and the IFS. These organisations offer either specially tailored programmes for specific needs, or just general courses. The question is how these courses, programmes and educational schemes are perceived by immigrant entrepreneurs, and what attitude these groups have towards them. In the UK, there have also been government-supported programmes tailored for and directed at immigrant owners (Ram and Jones, 1998;DTI, 2003).
During recent decade, several Swedish studies have been conducted on support programmes directed to business owners, particularly to women and immigrant owners (Behrenz et al., 2012; Riksrevisionen, 2007). Nevertheless, no studies have been conducted on the attitudes of the immigrant participants towards these programmes.
The purpose of this study is to investigate whether there are any differences between the attitudes of immigrant and native-born entrepreneurs towards participation in development programmes. The remainder of the study is organised as follows. Section 2 reviews the previous empirical studies and presents the study hypothesis. Section 3 describes the sample, the independent and dependent variables and the model specification. Section 4 presents the empirical results of the study. The paper ends with some concluding remarks and discusses practical implications and limitations. Before continuing to next sections, some definitions are necessary to be mentioned. With ethnicity, we mean a country of birth other than Sweden. Despite the distinction between the terms Immigrant entrepreneurs and Ethnic entrepreneurs (Waldinger et al., 1990;
Collins, 2003), we use them as synonymous and mean business owners born outside Sweden, particularly from non-Western countries. In accordance with research (Rusinovic, 2006) and Statistics Sweden (SCB, 2012), we define first-generation immigrant entrepreneurs as those who immigrated to the host country, while the second-generation are their children were born here. The latter group shows more
EJTD
39,1
similarity in entrepreneurship with native-born entrepreneurs than the first generation (Rusinovic, 2006).
2. Previous research
To the authors’ best knowledge, despite there being a remarkable number of studies on immigrant businesses, and also a number of studies on business development programmes, there are few, if any, studies that concretely and specifically deal with business owners’ attitudes towards such development programmes. We hope that our article contributes to a better understanding of this issue.
An immediate question one might ask is whether entrepreneurship can be taught (Garavan and O’Cinneid, 1994;Dana, 2001;Henry et al., 2005).Dana’s (2001)answer is “Yes”, relying on the historical fact that, in previous, centuries people learned entrepreneurship from older generations in master–subordinate or trainer–trainee relationships. There have been some differences in the terms used for business development programmes in the literature from English-speaking countries. In the USA and Canada, researchers have generally used the term “entrepreneurship education”, whilst in Ireland and the UK, the term “enterprise education” has been more commonly used (Gibb, 1993). We followGibb (1987,1993), as we find the latter term more relevant to our purpose because it refers to teaching the enterprise culture to business owners, and to improving their personal attributes in this context, and this term covers both small and large businesses.
One might wonder why entrepreneurs apply to participate in such programmes or why such programmes are important for society.Garavan and O’Cinneid (1994), with support from some earlier studies (Bannock, 1981;Sexton and Kasarda, 1991), argue roughly that the purpose and goal of such education and training programmes is to enable people to develop better entrepreneurial behavioural skills, allowing them to achieve a better career and increasing their capacity to learn even more. Much the same discussions are presented byHills (1988),Cox (1996)andHisrich and Peters (1998).
Henry et al. (2005)argue briefly, using the support ofGibb and Cotton (1998), that such education and training programmes are important because the extremely quick changes of the world in which we live demand that entrepreneurs quickly adjust their knowledge to new circumstances through these programmes. In their evaluation of enterprise education programmes that have been conducted in five European countries,Garavan and O’Cinneid (1994)find that the most important aims of those attending have been to acquire knowledge germane to entrepreneurship, to acquire skills in the use of techniques, in the analysis of business situations and in the synthesis of action plans to identify and stimulate entrepreneurial drive, talent and skills, to undo the risk-adverse bias of many analytical techniques, to develop empathy and support for all the unique aspects of entrepreneurship, to devise attitudes towards change and to encourage new start-ups and other entrepreneurial ventures.Hisrich and Peters (1998, p. 20) emphasise that such programmes offer technical skills, business management skills and personal entrepreneurial skills. In addition, Le Roux and Nieuwenhuizen (1996)indicated that participants in these programmes wished to gain knowledge about marketing, management, financial management, entrepreneurship and business planning.
There is a great deal of literature and previous empirical and theoretical studies on the motives and driving forces behind immigrants starting businesses, on their financing issues, on their networking, etc. When it comes to the point of participation in
61
Business
development
programmes
training programmes, the reasons for such participation could be connected to immigrants’ general need for more business knowledge (Chavan, 2003) or their need for support because they suffer under a number of unfavourable conditions that are typical for small minority-owned businesses (Ram and Smallbone, 2003). This is quite reasonable because without any business knowledge it is difficult to start a business with a great risk of failure (Cressy, 2006). Another reason might be that the business owner wishes to start a career by moving from an ethnically segregated market niche or enclave to a more mainstream activity; immigrants with higher education and greater skills find it easier to do this (Toussaint-Comeau, 2008, p. 30). Another possible reason is that many immigrants find it difficult to get funding from mainstream banks, and probably attend such courses in the hope of learning more about funding. In fact, it is very common for immigrant entrepreneurs to rely on funding and loans from families, friends and other ethnic networks because their applications are rejected by the banks. Studies byBasu (1998)andDunstan et al. (2004), for example, confirm that financing for immigrants’ start-ups depends more on access to advice from informal sources than advice from formal/mainstream sources.
Nevertheless, training and education in entrepreneurship do not necessarily need to come from public/governmental agencies, but may also come from entrepreneurs’ own networks (Dubini and Aldrich, 1991). Earlier research (Werbner, 1990;Ward, 1991) has indicated that some minority groups rely mostly on advice from informal sources – mainly family and friends, and research byDana (1993)found that Italian entrepreneurs in Canada received assistance from their own ethnic networks, which contributed mentorship, training and access to business ideas, market information on technical issues and many other things. Other studies (Iyer and Shapiro, 1999) found that it was important for immigrant businesses to receive such assistance from their own networks. These are possible reasons why these groups neither apply for nor participate in such programmes. In addition, one more reason for low interest among some minority groups is that these programmes are considered not to be specially tailored for these target groups (Bank of England, 2002).Ram and Smallbone (2003)also emphasised that the British Government’s Small Business Service (SBS), in their service to Black- and ethnic minority-owned businesses, lacked effectiveness and an awareness of the particular needs of such businesses. An evaluation of a government-supported business services agency directed at Asian businesses in the UK pointed out both strengths and weaknesses. In general, the results were positive, but they indicated that the programmes should be more specifically tailored towards such groups and their specific needs, which differ from those of mainstream businesses in various aspects (Fallon and Berman Brown, 2004). Other studies (Fadahunsi et al., 2000;Dhaliwal, 2008) mention a lack of awareness among entrepreneurs as the reason. Also immigrant entrepreneurs with earlier negative experiences of these programmes or those with a lack of time would not participate (Dhaliwal, 2008).
Another question a reader might ask is whether the business owner’s attendance at such programmes has any positive impact on the business and the owner’s business culture. Earlier studies emphasise that attending these programmes has an overall positive impact on the later results of the business (Chrisman, 1989;Chrisman et al., 1990). Studies by, among others,Basu (1998)andRobb and Fairlie (2009)have shown that immigrant entrepreneurs’ human capital and, in particular, their education generally have a positive impact on their businesses. One immediate and spontaneous
EJTD
39,1
assumption that can be made here is that the positive impact of such training programmes on a business will be greater when the knowledge obtained in these programmes increases the owner’s already high accumulated human capital. As a result, immigrant owners with lower human capital resources have a chance to strengthen their knowledge through attendance at such programmes.
A previous study performed byFayolle et al. (2006)showed a strong relationship between entrepreneurship education programmes and entrepreneurial intentions among students, and a fairly positive impact on their perceived behavioural control. Another study conducted byOosterbeek et al. (2010)showed an almost opposite result for students who received the education. There are different ways to measure or evaluate the impact of such programmes in general (Block and Stumpf, 1992;Vesper and Gartner, 1997).
After considering some issues in the previous paragraphs, still a question is what business owners think about participation in such programmes, and what their attitude is towards such efforts. Earlier studies in the UK byJones and McEvoy (1986)andRam and Deakins (1995)showed that African/Caribbean owners were more likely to use the services offered by public enterprise agencies than either White owners or South Asians. A relatively recent investigation of the attitudes towards so-called business support provision in the UK (Dhaliwal, 2008) confirms these results. African/Caribbean owners had the most positive attitudes towards such programmes, while owners from Asia had a moderately positive attitude. The other ethnic groups relied more on informal support networks. One possible reason, which is supported by this study, is that this established African/Caribbean group is less successful at getting bank loans and suffers from a lack of informal networks (Dhaliwal, 2008).
Hussain and Matlay (2008)investigated the provision of vocational education and training in small ethnic minority businesses in the UK. They interviewed 66 owners/ managers of small ethnic minority businesses who were of both genders and also had different levels of education. The respondents were, in general, receptive to this training provision. Further, the authors showed that owners operating in manufacturing industries were more positive about such provision than those operating in the services sector. In addition, those in charge of larger firms were more positive than those running small firms.
Ram (1998)studied the delivery of such programmes from a new perspective, that of the providers, in four major British cities. Twenty-two respondents who gave publicly supported service programmes to immigrant owners indicated in their answers that there were some significant constraints on the effective delivery of such programmes to immigrant clients. Among others, the rationale for interventions was unclear, and the majority of the respondents believed that their service, compared to that offered by the mainstream providers (i.e. providers directed to non-immigrants), had a marginal effect.
In a relatively recent study by Schlosser (2012), both mentors and mentees (immigrant entrepreneurs) were asked about their perceptions of certain workshops that were offered. They were generally positive about the programme and its different workshops and sessions, which gave combined business and legal information to their businesses, providing networking and promotional opportunities. The sessions on networking were particularly appreciated and were considered to be a success factor for the programme.
63
Business
development
programmes
Inspired by these previous studies, the following hypothesis has been formulated: H1. Immigrant managers/owners of companies are more likely to show a positive
attitude towards participation in business development programmes than their native counterparts. In many micro- and medium-size firms, an entrepreneur can also be chief executive officer (CEO), owner and manager at the same time as clear by the reviewed literature. These three terms have been used in our paper not as totally synonymous but as the firm’s leadership in these programmes.
3. The sample, the independent and dependent variables and the model specification
3.1 The sample
The study sample is based on a unique and firm-level panel database (secondary data) collected by the Swedish Small Business Forum in a survey in October and November 2012. A questionnaire containing 60 closed questions was completed by 531 participants representing 395 companies. The response rate was 44 per cent at company level, which can be considered quite high (Baruch and Holtom, 2008). The responses with missing ethnicity variables were removed from the sample, leaving a final sample of 511 answers. The respondents were the owners/manager of businesses, CEOs or, in some cases, both, and they had all attended a business training programme organised by Företagsakademin (which means The Business Academy) in Stockholm. Some of the respondents had attended more than one course. 3.2 Presentation of the independent and dependent variables
In the light of the relevant literature, 15 relevant variables (see the list of variables in
Table II) were selected as the preliminary dependent variables. Before starting the multivariate analysis, ANOVA and correlation analyses were conducted to examine which variables were statistically significantly associated with the independent variable “ethnicity”. With ethnicity means “native-born” and “born in other countries⫽ immigrants”. The respondents’ attitude towards competence development was measured using a scale of 1 for agree and 0 for disagree. Based on the results of ANOVA, statistically significant differences between immigrants and native Swedes were found for nine dependent variables: Q1, Q2, Q5, Q7, Q8, Q9, Q11, Q13 and Q14. Subsequently, these variables were used in the correlation analysis and binary logistic model. 3.3 Model specification
The nine relevant dependent attitude variables were used in a binary logistic regression model to investigate the link between ethnicity and those attitude variables classified by ANOVA and correlation analysis as the relevant dependent variables. A logistic regression is the appropriate statistical technique when the dependent variable is a binary variable (e.g. Yes/No), and the independent variables are metric. In addition, logistic regression has the primary advantage that it does not make any assumptions of normality, linearity and homogeneity of variance for the independent variables.
Attitude variable Y ⫽ ␣0⫹1(X1) ⫹ where:
Y ⫽ Attitude variable (0 ⫽ No, 1 ⫽ Yes); ␣0⫽ constant;
EJTD
39,1
X1⫽ ethnicity (1 ⫽ native, 2 ⫽ immigrant, the second-generation immigrants are not included in the category of immigrant); and
⫽ error term.
The variables, firm age and size in term of number of employees, owner age and education level were tested and had not displayed statistically significant predictive power. Thus, they were removed from the models.
4. Empirical results
4.1 Descriptive statistics of sample
The descriptive statistics of the main characteristics of the firms and owners in the dataset are displayed in Table I. Around 62 per cent of the business owners were female, and roughly 88 per cent were born in Sweden. Nearly, 70 per cent of the respondents reported some college education, either a bachelor’s degree or more advanced training in an undergraduate or graduate setting, while 27.7 per cent of respondents had finished secondary school. The age of the respondents was, on average, around 38 years, and the respondents were categorised by age into four
Table I. Summary of descriptive statistics for characteristics of respondents Variables Frequency (%) Valid (%) Cumulative (%) Gender Female 317 62.04 62.28 62.28 Male 192 37.57 37.72 100.00 Total 509 99.61 100.00 Missing 2 0.39 Total 511 100.00 Ethnicity Native 449 87.87 87.87 87.87 Immigrant 62 12.13 12.13 100.00 Total 511 100.00 100.00 Education
Elementary school or equivalent 14 2.74 2.75 2.75
Secondary school 127 24.85 24.95 27.70
University education less than 3 years 115 22.50 22.59 50.29 University education more than 3 years 253 49.51 49.71 100.00
Total 509 99.61 100.00 Missing 2 0.39 Total 511 100.00 Age (years) Less than 30 44 8.61 8.73 8.73 31-50 287 56.16 56.94 65.67 51-60 129 25.24 25.60 91.27 More than 61 44 8.61 8.73 100.00 Total 504 98.63 100.00 Missing 7 1.37 Total 511 100.00
65
Business
development
programmes
groups. The highest concentration of respondents (56 per cent) was found in the 31-50-year-age category.
Concerning industrial affiliation, around 80.5 per cent of all firms were active in the services sector and 5.5 per cent in the manufacturing sector; the remaining 11.3 per cent were retail firms. The firms were, in general, young micro-firms with an average age of 2.6 years, and they had, on average, three employees.
4.2 Descriptive statistics of dependent variables
To examine the relationship between ethnicity and the attitude of participants towards attending business development programmes, the respondents were asked to express their opinions about participation in these programmes. Fifteen different items were used to measure attitude, with each being scored as 1 for agree and 0 for disagree. The score is therefore 1 if the respondent has a very strong positive attitude towards competence development; otherwise, it assumes the value 0.
Table IIsummarises the descriptive statistics for the dependent variables, including mean, standard deviation and number of observations. As can be observed from the results of the descriptive analysis, the mean values of the attitude variables for the immigrant group are generally higher than the corresponding values for the native group. In addition, the values for the standard deviations of the attitude variables for the immigrant group are generally lower than the corresponding values for the native group. This means that the responses of the immigrant group tend to be more homogeneous than those of their native counterparts. A significance test was conducted to analyse which variables are statistically significant in explaining the differences between the native and immigrant groups. The null hypothesis is stated as follows:
H0. There is no significant difference between the native and immigrant groups in their attitudes towards the competence development programme.
As shown by the results of the ANOVA, presented inTable III, statistically significant differences are found between the two groups for 9 of the 15 attitude variables at the 5 per cent significance level. However, there are no significant differences between the two groups with regards to the six remaining attitude variables.
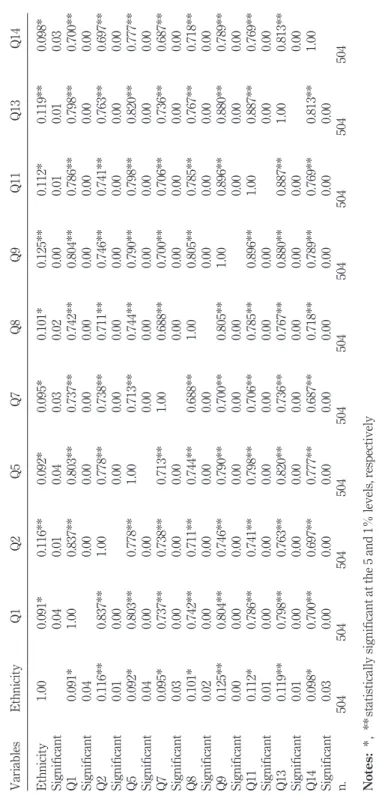
4.3 Correlation analysis of link between ethnicity and attitude towards participation in the development programme
Table III exhibits the results of the correlation analysis between the independent variable (ethnicity) and the nine attitude variables. From the table, it can be observed that there is a positive and significant correlation between the independent variable and the nine dependent variables at the 5 and 10 per cent significance levels. This means that ethnicity has a positive association with the attitude variables. Furthermore, there is also a positive and significant correlation between the attitude variables at the 5 per cent level.
4.4 Impact of ethnicity on various proxies for attitude variables
The results of the binary logistic regression models for the relationships between the independent variable, ethnicity and the nine relevant dependent variables are
EJTD
39,1
Table II. Mean, standard deviation, and number of dependent variables, classified by ethnicity Categories/ Measurements Q1 Q2 Q3 Q4 Q5 Q6 Q7 Q8 Q9 Q10 Q11 Q12 Q13 Q14 Q15 Native Mean 0.817 0.777 0.759 0.791 0.793 0.806 0.742 0.755 0.813 0.759 0.808 0.788 0.797 0.759 0.690 SD 0.387 0.417 0.428 0.407 0.406 0.396 0.438 0.431 0.390 0.428 0.394 0.409 0.402 0.428 0.463 N 449 449 449 449 449 449 449 449 449 449 449 449 449 449 449 Immigrant Mean 0.927 0.927 0.818 0.873 0.909 0.909 0.873 0.891 0.964 0.873 0.945 0.891 0.945 0.891 0.782 SD 0.262 0.262 0.389 0.336 0.290 0.290 0.336 0.315 0.189 0.336 0.229 0.315 0.229 0.315 0.417 N 55 55 55 55 55 55 55 55 55 55 55 55 55 55 55 Total Mean 0.829 0.794 0.766 0.800 0.806 0.817 0.756 0.770 0.829 0.772 0.823 0.800 0.813 0.774 0.700 SD 0.377 0.405 0.424 0.401 0.396 0.387 0.430 0.421 0.377 0.420 0.382 0.401 0.390 0.419 0.459 N 504 504 504 504 504 504 504 504 504 504 504 504 504 504 504 Levene Significant 0.000 0.000 0.035 0.001 0.000 0.000 0.000 0.000 0.000 0.000 0.000 0.000 0.000 0.000 0.001 Welch Significant 0.007 0.000 0.300 0.100 0.009 0.020 0.010 0.005 0.000 0.025 0.000 0.031 0.000 0.006 0.134 ANOVA: F 4.200 6.795 0.940 2.060 4.244 3.484 4.587 5.139 7.958 3.580 6.379 3.220 7.158 4.864 1.950 ANOVA: Significant 0.041* 0.009** 0.333 0.152 0.040* 0.063 0.033* 0.024* 0.005** 0.059 0.012* 0.073 0.008** 0.028* 0.163 Notes: Q1: the overall quality of education was very high; Q2: the training satisfied my educational needs very well; Q3: very little went wrong during the busi ness development programmes; Q4: the cost of attending the training is very low given the quality of the training; Q5: overall, participation in the training was valuab le for my company; Q6: given my experience of the Enterprise Academy, overall, I a m very satisfied; Q7: the programme has exceeded my expectations; Q8: when I think of ways to develop the skills of management and employees in a micro-enterprise, participation in this training has been an ideal way; Q9: I a m very happy with my/our participation in the programme, seen in relation to the cost of attending; Q10: the company will participate in upcoming projects initiated by Företagsakademin FA AB; Q11: I/we will recommend other companies to participate in future training sessions; Q12: participation in education has been a great way to develop my enterprise; Q13: participation in education has been a great way to develop myself; Q 14: I’ve got the tools, knowledge and inspiration to develop the company/participate in the development of the company; Q15: participating in the Business School has inspired me/us to ma ke further investments in skills; * , ** statistically significant at the 5 and 1% level respectively
67
Business
development
programmes
Table III. Results of the correlation analysis of the independent and dependent variables Variables Ethnicity Q1 Q2 Q5 Q7 Q8 Q9 Q11 Q13 Q14 Ethnicity 1.00 0.091* 0.116** 0.092* 0.095* 0.101* 0.125** 0.112* 0.119** 0.098* Significant 0.04 0.01 0.04 0.03 0.02 0.00 0.01 0.01 0.03 Q1 0.091* 1.00 0.837** 0.803** 0.737** 0.742** 0.804** 0.786** 0.798** 0.700** Significant 0.04 0.00 0.00 0.00 0.00 0.00 0.00 0.00 0.00 Q2 0.116** 0.837** 1.00 0.778** 0.738** 0.711** 0.746** 0.741** 0.763** 0.697** Significant 0.01 0.00 0.00 0.00 0.00 0.00 0.00 0.00 0.00 Q5 0.092* 0.803** 0.778** 1.00 0.713** 0.744** 0.790** 0.798** 0.820** 0.777** Significant 0.04 0.00 0.00 0.00 0.00 0.00 0.00 0.00 0.00 Q7 0.095* 0.737** 0.738** 0.713** 1.00 0.688** 0.700** 0.706** 0.736** 0.687** Significant 0.03 0.00 0.00 0.00 0.00 0.00 0.00 0.00 0.00 Q8 0.101* 0.742** 0.711** 0.744** 0.688** 1.00 0.805** 0.785** 0.767** 0.718** Significant 0.02 0.00 0.00 0.00 0.00 0.00 0.00 0.00 0.00 Q9 0.125** 0.804** 0.746** 0.790** 0.700** 0.805** 1.00 0.896** 0.880** 0.789** Significant 0.00 0.00 0.00 0.00 0.00 0.00 0.00 0.00 0.00 Q11 0.112* 0.786** 0.741** 0.798** 0.706** 0.785** 0.896** 1.00 0.887** 0.769** Significant 0.01 0.00 0.00 0.00 0.00 0.00 0.00 0.00 0.00 Q13 0.119** 0.798** 0.763** 0.820** 0.736** 0.767** 0.880** 0.887** 1.00 0.813** Significant 0.01 0.00 0.00 0.00 0.00 0.00 0.00 0.00 0.00 Q14 0.098* 0.700** 0.697** 0.777** 0.687** 0.718** 0.789** 0.769** 0.813** 1.00 Significant 0.03 0.00 0.00 0.00 0.00 0.00 0.00 0.00 0.00 n. 504 504 504 504 504 504 504 504 504 504 Notes: * , ** statistically significant at the 5 and 1% levels, respectively
EJTD
39,1
68
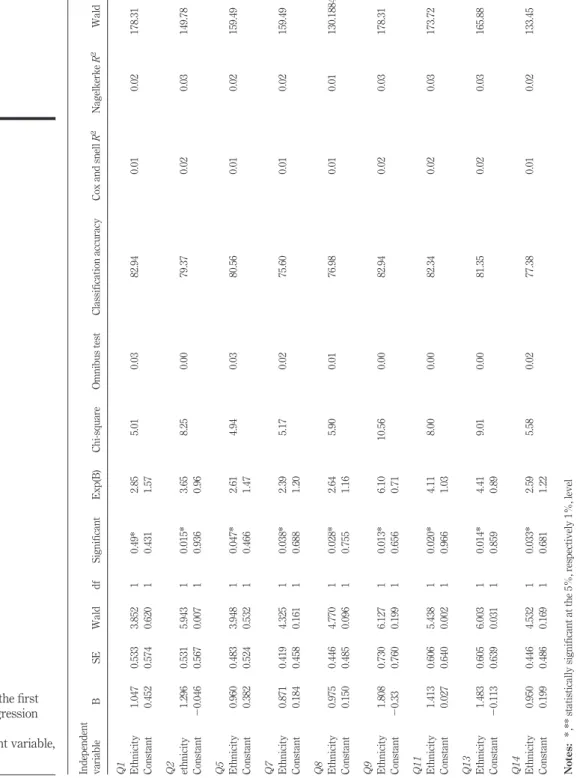
presented below. The results show the coefficient estimations, the standard errors and the p-value for testing the null hypothesis that the coefficient of each covariate is equal to zero.
The results of the logistic regression models are reported inTable IV, and indicate that the independent variable ethnicity is relevant and significant in explaining the change in all the nine dependent variables. Consistent with the study hypothesis, these results clearly confirm that ethnicity, with a high coefficient, strongly influences the nine dependent variables. The positive nature and significance of the coefficients show that firm owners/mangers who are immigrants are more likely to have a positive attitude towards participation in development programmes than their native counterparts.
The odds ratio, Exp (B), implies generally that the likelihood of immigrants showing a positive attitude is greater than the likelihood of natives doing so. For example, concerning variable Q1 (the overall quality of education was very high), a respondent from the immigrant group is 2.85 times more likely to agree than a native respondent.
In the same way as the t-test in multiple regressions, the Wald statistic indicates whether the coefficients for each predictor differ significantly from zero and hence make a significant contribution to predicting the results. Several diagnostic tests, including the Omnibus and Classification Accuracy tests, are used to investigate the validity of the models.Table IVshows the Omnibus test for all the model coefficients, providing an overall indication of how well the model performs. This basically tests the null hypothesis that the coefficients for the independent variables are equal to 0. These results indicate that, as per the chi-square test, the overall models are significant (chi-squares are high, and p⬍ 0.05 for all dependent variables). Moreover, to assess how well the model actually predicts the linkage between ethnicity and the dependent variables, classification accuracy tests are carried out. These tests compare the prognosticated results to the observed results, and show high overall accuracy rates for all variables (between 75.60 and 82.94). The value corresponding to the classification accuracy of Q9 is the highest, and Q7 shows the lowest classification accuracy value. The results show that the independent variable ethnicity displays a very strong classification power. Furthermore, the high explanatory power of the model is confirmed by other diagnostic validations like the Cox and Snell, Nagelkerke R2and Wald tests.
Comparing the predictors for the nine logistic regression models presented in
Table IV, it can be noted that explanatory power of the sixth variable (Q9: I am very happy with my/our participation in the programme, seen in relation to the cost of attending) is greatest, in terms of the coefficient (b⫽ 1.808) and odds ratio (Exp (B) ⫽ 6.10). On the other hand, the fourth variable (Q7: The programme has exceeded my expectations, where b⫽ 0.871 and Exp (B) ⫽ 2.39,) represents the lowest explanatory power of all the variables.
In summary, the empirical findings are in agreement with the hypothesis because they partly confirm that immigrant managers/owners are more likely to show a positive attitude towards participation in a development programme than their native counterparts. However, there are no significant differences between the two groups for six out of the fifteen attitude variables.
69
Business
development
programmes
Table IV. Results of the first logistic regression analysis: independent variable, ethnicity Independent variable B S E Wald df Significant Exp(B) Chi-square Omnibus test Classification accuracy Cox and snell R 2 Nagelkerke R 2 Wald Q1 Ethnicity 1.047 0.533 3.852 1 0.49* 2.85 5.01 0.03 82.94 0.01 0.02 178.31 Constant 0.452 0.574 0.620 1 0.431 1.57 Q2 ethnicity 1.296 0.531 5.943 1 0.015* 3.65 8.25 0.00 79.37 0.02 0.03 149.78 Constant ⫺ 0.046 0.567 0.007 1 0.936 0.96 Q5 Ethnicity 0.960 0.483 3.948 1 0.047* 2.61 4.94 0.03 80.56 0.01 0.02 159.49 Constant 0.382 0.524 0.532 1 0.466 1.47 Q7 Ethnicity 0.871 0.419 4.325 1 0.038* 2.39 5.17 0.02 75.60 0.01 0.02 159.49 Constant 0.184 0.458 0.161 1 0.688 1.20 Q8 Ethnicity 0.975 0.446 4.770 1 0.028* 2.64 5.90 0.01 76.98 0.01 0.01 130.1884 Constant 0.150 0.485 0.096 1 0.755 1.16 Q9 Ethnicity 1.808 0.730 6.127 1 0.013* 6.10 10.56 0.00 82.94 0.02 0.03 178.31 Constant ⫺ 0.33 0.760 0.199 1 0.656 0.71 Q11 Ethnicity 1.413 0.606 5.438 1 0.020* 4.11 8.00 0.00 82.34 0.02 0.03 173.72 Constant 0.027 0.640 0.002 1 0.966 1.03 Q13 Ethnicity 1.483 0.605 6.003 1 0.014* 4.41 9.01 0.00 81.35 0.02 0.03 165.88 Constant ⫺ 0.113 0.639 0.031 1 0.859 0.89 Q14 Ethnicity 0.950 0.446 4.532 1 0.033* 2.59 5.58 0.02 77.38 0.01 0.02 133.45 Constant 0.199 0.486 0.169 1 0.681 1.22 Notes: * ,** statistically significant at the 5%, respectively 1%, level
EJTD
39,1
70
5. Conclusions and discussion
The paper focusses on an important issue, investigating the attitudes towards participation in development programmes of micro-firm owners in Sweden, through an ethnic comparison between business owners/managers. Several methods including a binary logistic regression model have been used to analyse a unique and new firm-level panel database. The empirical findings indicate that immigrant managers/owners are more likely to show a positive attitude towards participation in development programmes, in terms of 9 out of 15 attitude variables, than their native counterparts. The findings confirm, for example, that the immigrant managers/owners were, on average, more satisfied with the quality of education than the native group. It might be the result of well-tailored workshops and sessions that fulfilled the needs of these relatively unprivileged groups (Schlosser, 2012;Bank of England, 2002,Dhaliwal, 2008). They also regarded participation in business development programmes as a valuable tool, giving knowledge and inspiration to develop the skills of management and employees in micro-firms. This satisfaction can be interpreted as a sign of the effectiveness of the efforts made and of the awareness of the needs of the target groups (Ram and Smallbone, 2003; Fallon and Berman Brown, 2004). Because there is no information about second generation of immigrants in the sample; thus, this category may have had impact on the results. However, there is no possibility to identify any impact of this on the results.
The findings show that there has been a need for knowledge among the owners of small firms, and that this need has been satisfied to a greater extent for immigrant owners. The results confirm that participation was an answer to the lack of resources which, in this case, was a lack of business knowledge and information (Chavan, 2003). Perhaps this was an attempt to avoid an eventual bankruptcy (Westholm et al., 2003) to escape from unfavourable conditions (Ram and Smallbone, 2003), to obtain better entrepreneurial skills or careers (Garavan and O’Cinneid, 1994) or quite simply to update and adjust their knowledge (Henry et al., 2005). On the other hand, the results mean that native-born entrepreneurs seem have had more access to such knowledge and, as result, they feel less need to acquire it. This means that such efforts are more important for immigrant entrepreneurs and can decrease the gap between native-born and immigrant entrepreneurs both in the short and the long term.
However, this study addresses some concrete social and economical challenges to Swedish policymakers, social scientists and immigrant business owners. To not contribute immigrants with such business support programmes can, in short and long term, among others, lead to loss of thousands of jobs and billions Crowns for the Swedish economy, less export and growth, alienation, exclusion and immigrants’ insufficient integration in to the society. Social scientists also need to do more specific research on this issue with new research questions.
Finally, this study fills a knowledge gap for policymakers, as the study is the first in Swedish context that deals with immigrant entrepreneurs’ attitudes towards such training programmes. Based on the insights provided by the study, policymakers can encourage the start-up of new immigrant businesses through facilitating the participation of immigrants in business development programmes. Because young micro-firms, especially those owned by immigrants, do not typically have sufficient resources to organise their own training programmes, their owners should use the outside education and training resources that are offered and, for example, participate in
71
Business
development
programmes
government-sponsored training programmes. The findings also confirm that policymakers should, in accordance with earlier research, consider the significance of carefully tailored programmes that really fulfil immigrant entrepreneurs’ need and desire.
This study has a number of limitations. First, the dataset used in study merely consists of Swedish micro-firms. Second, the attitude towards participation in business development programmes is context-related behaviour. Consequently, the findings may not be generalised to firms operating in other countries and/or contexts. Furthermore the sample lacks classifications in first and second generation of immigrants, classification in owners/manager and CEOs, as well as specific information on countries of birth. Thus, future study should take into account theses variables. In addition, a deeper understanding of the issue requires a qualitative analysis of the question.
References
Bank of England (2002), Finance for Small Firms – A Ninth Report, Bank of England Domestic Finance Division, London.
Bannock, G. (1981), The Economics of Small Firms: Return from the Wilderness, Basil Blackwell, Oxford.
Baruch, Y. and Holtom, B. (2008), “Survey response rate levels and trends in organizational research”, Human Relations, Vol. 61 No. 8, pp. 1139-1160.
Basu, A. (1998), “An exploration of entrepreneurial activity among Asian small businesses in Britain”, Small Business Economics, Vol. 10 No. 4, pp. 313-326.
Behrenz, L., Delander, L. and Månsson, J. (2012), “Start-up subsidies in Sweden: treatment, deadweight and direct displacement effects”, Working Paper No. 17, Linnaeus University Centre for Labour Market and Discrimination Studies, Växjö.
Block, Z. and Stumpf, S.A. (1992), “Entrepreneurship education research: experience and challenge”, in Sexton, D.L. and Kasarda, J.M. (Eds), The State of the Art of
Entrepreneurship, PWS-Kent Publishing, Boston, MA, pp. 17-45.
Chavan, M. (2003), “Education and training needs of the ethnic entrepreneur in Australia”,
Industry and Higher Education, Vol. 17 No. 3, pp. 187-198.
Chrisman, J.J. (1989), “Strategic, administrative and operating assistance: the value of outside consulting to pre-venture entrepreneurs”, Journal of Business Venturing, Vol. 4 No. 6, pp. 401-418.
Chrisman, J.J., Carsrud, A.L., DeCastro, J. and Herron, L. (1990), “A comparison of assistance needs of male and female pre-venture entrepreneurs”, Journal of Business Venturing, Vol. 5 No. 4, pp. 235-248.
Chrysostome, E. (2010), “The success factors of necessity immigrant entrepreneurs: in search of a model”, Thunderbird International Business Review, Vol. 52 No. 2, pp. 137-152.
Collins, J. (2003), “Cultural diversity and entrepreneurship: policy responses to immigrant entrepreneurs in Australia”, Entrepreneurship & Regional Development: An International
Journal, Vol. 15 No. 2, pp. 137-149.
Cox, L.W. (1996), “The goals and impact of educational interventions in the early stages of entrepreneur career development”, Proceedings of the Internationalising Entrepreneurship
Education and Training Conference, Arnhem.
Cressy, R. (2006), “Why do most firms die young?”, Small Business Economics, Vol. 26 No. 2, pp. 103-116.
EJTD
39,1
Dana, L.P. (1993), “An inquiry into culture and entrepreneurship”, Journal of Small Business and
Entrepreneurship, Vol. 10 No. 4, pp. 16-31.
Dana, L.P. (2001), “The education and training of entrepreneurs in Asia”, Education⫹ Training, Vol. 43 Nos 8/9, pp. 405-415.
Dhaliwal, S. (2008), “Business support and minority ethnic businesses in England”, Journal of
Immigrant & Refugee Studies, Vol. 6 No. 2, pp. 230-246.
DTI (2003), A Comprehensive Strategy for Start-ups – Encouraging a More Dynamic Startup
Market – A Strategic Framework and Action Plan, Department of Trade & Industry,
London.
Dubini, P. and Aldrich, H.E. (1991), “Personal and extended networks are central to the entrepreneurship process”, Journal of Business Venturing, Vol. 6 No. 5, pp. 305-313. Dunstan, S., Boyd, S. and Crichton, S. (2004), “Migrants’ Experiences in New Zealand: pilot survey
report”, Department of Labour, Wellington.
European Commission (2008), Supporting Entrepreneurial Diversity in Europe – Ethnic Minority
Entrepreneurship/Migrant Entrepreneurship, Enterprise and Industry Directorate-General,
Brussels, Belgium.
Fadahunsi, A., Smallbone, D. and Supri, S. (2000), “Networking and ethnic minority enterprise development: insights in a North London study”, Journal of Small Business and Enterprise
Development, Vol. 7 No. 3, pp. 228-240.
Fallon, G. and Berman Brown, R. (2004), “Supporting ethnic community businesses: lessons from a West Midlands Asian Business support agency”, Regional Studies, Vol. 38 No. 2, pp. 137-148.
Fayolle, A., Gailly, B. and Lassas-Clerc, N. (2006), “Assessing the impact of entrepreneurship education programmes: a new methodology”, Journal of European Industrial Training, Vol. 30 No. 9, pp. 701-720.
Garavan, T.N. and O’Cinneid, B. (1994), “Entrepreneurship education and training programmes: a review and evaluation – Part 1”, Journal of European Industrial Training, Vol. 18 No. 8, pp. 3-12.
Gibb, A.A. (1987), “Enterprise culture – its meaning and implications for education and training”,
Journal of European Industrial Training, Vol. 11 No. 2, pp. 2-38.
Gibb, A.A. (1993), “Enterprise culture and education, understanding enterprise education and its links with small business entrepreneurships and wider educational goals”, International
Small Business Journal, Vol. 11 No. 3, pp. 11-34.
Gibb, A.A. and Cotton, J. (1998), “Entrepreneurship in schools and college education – creating the leading edge”, paper presented at the, Conference on Work Futures and the Role of Entrepreneurship and Enterprise in Schools and Further Education, London, 8 December. Henry, C., Hill, F. and Leitch, C. (2005), “Entrepreneurship education and training: can
entrepreneurship be taught? Part I”, Education⫹ Training, Vol. 47 No. 2, pp. 98-111. Hills, G.E. (1988), “Variations in university entrepreneurship education: an empirical study of an
evolving field”, Journal of Business Venturing, Vol. 3 No. 1, pp. 109-122.
Hisrich, R.D. and Peters, M.P. (1998), Entrepreneurship, 4th ed., Irwin McGraw-Hill, Boston, MA. Hussain, J. and Matlay, H. (2008), “Vocational education and training in small ethnic minority
businesses in the UK”, Education⫹ Training, Vol. 49 Nos 8/9, pp. 671-685.
Iyer, G.R. and Shapiro, J.M. (1999), “Ethnic entrepreneurial and marketing systems: implications for the global economy”, Journal of International Marketing, Vol. 7 No. 4, pp. 83-110.
73
Business
development
programmes
Jones, T. and McEvoy, D. (1986), “Ethnic enterprise: the popular image”, in Curran, J., Stanworth, P. and Watkins, D. (Eds), The Survival of the Small Firm, Gower, Aldershot, pp. 197-219. Le Roux, E. and Nieuwenhuizen, C. (1996), “Small business management education and training:
an innovative approach to the reconstruction and development of the new South Africa”,
Proceedings of the Internationalising Entrepreneurship Education and Training Conference, Arnhem.
Murray, T.A. and White, A. (1986), Education for Enterprise – An Irish Perspective, National Council for Education Awards and the Industrial Development Authority of Ireland, Dublin.
OECD (2010), “Entrepreneurship and migrants”, Report by the OECD Working Party on SMEs and Entrepreneurship, OECD, Paris.
Oosterbeek, H., van Praag, M. and Ijsselstein, A. (2010), “The impact of entrepreneurship education on entrepreneurship skills and motivation”, European Economic Review, Vol. 54 No. 3, pp. 442-454.
Ram, M. (1998), “Enterprise support and ethnic minority firms”, Journal of Ethnic and Migration
Studies, Vol. 24 No. 1, pp. 143-158.
Ram, M. and Deakins, D. (1995), African/Caribbean Entrepreneurship in Britain, University of Central England & Small Business Research Centre, Birmingham.
Ram, M. and Jones, T. (1998), Ethnic Minorities in Business, Small Business Research Trust, Milton Keynes.
Ram, M. and Smallbone, D. (2003), “Policies to support ethnic minority enterprise: the English experience”, Entrepreneurship and Regional Development, Vol. 15 No. 2, pp. 151-166. Rezania, F. and Önal, A. (2009), Invandrarföretagare i Sverige och Europa (Immigrant
entrepreneurs in Sweden and Europe), Svenskt Näringsliv, Stockholm.
Riksrevisionen (2007), Statens Företagsfrämjande Insatser – når de Kvinnor och Personer Med
Utländsk Bakgrund?, Rapport RiR 11, Riksrevisionen, Stockholm.
Robb, A.M. and Fairlie, R.W. (2009), “Determinants of business success: an examination of Asian-owned businesses in the USA”, Journal of Population Economics, Vol. 22 No. 4, pp. 827-858.
Rusinovic, K. (2006), “Dynamic Entrepreneurship- First and second-generation immigrant entrepreneurs in Dutch cities”, IMISCOE Dissertations, Amsterdam University Press, Amsterdam.
Schlosser, F. (2012), “Taking an active approach in entrepreneurial mentoring programmes geared towards immigrants”, The Journal of Entrepreneurship, Vol. 21 No. 2, pp. 201-221. Sexton, D.L. and Kasarda, J.D. (1991), The State of the Art of Entrepreneurship, P.W. Kent
Publishing Co., Boston, MA.
Statistics Sweden, Population (2012), available at:www.scb.se
The International Business Association of Sweden (IFS) (2013), available at: www.ifs.a.se (accessed 15 December 2013).
Tillväxtverket (2013), Företagare med utländsk bakgrund - Entreprenörskapsbarometern: Fakta
& statistic, Tillväxtverket, Stockholm.
Toussaint-Comeau, M. (2008), “Do ethnic enclaves and networks promote immigrant self-employment?”, Federal Reserve Bank of Chicago Economic Perspectives, Vol. 32 No. 4, pp. 30-50.
Vesper, K.H. and Gartner, W.B. (1997), “Measuring progress in entrepreneurship education”,
Journal of Business Venturing, Vol. 12 No. 4, pp. 403-421.
EJTD
39,1
Waldinger, R., Ward, R., Aldrich, H.E., Stanfield, J.H. (1990), “Ethnic entrepreneurs: immigrant business in industrial societies”, Sage Series on Race and Ethnic Relations, Sage Publications, Newbruy Park, Vol. 1.
Ward, R. (1991), “Economic development and ethnic business”, in Curran, J. and Blackburn, R. (Eds), Paths of Enterprise, Chapter 3, Routledge, London.
Werbner, P. (1990), “Renewing an industrial past: British Pakistani entrepreneurship in Manchester”, Migration, Vol. 8, pp. 7-41.
Westholm, A., Borevi, K. and Strömbland, P. (2003), “Diskrimineras invandrarföretagare i Sverige? En empirisk studie av småföretagskonkurser under 1990-talet”, Statens Offentliga
Utredningar 1, Fritzes, Stockholm.
Corresponding author
Saeid Abbasian can be contacted at:saeid.abbasian@miun.se
For instructions on how to order reprints of this article, please visit our website: www.emeraldgrouppublishing.com/licensing/reprints.htm
Or contact us for further details:permissions@emeraldinsight.com