Compromising Baltic salmon
genetic diversity -
conservation genetic risks associated with compensatory releases of
salmon in the Baltic Sea
Compromising Baltic salmon genetic diversity -
conservation genetic risks associated with compensatory
releases of salmon in the Baltic Sea
conservation genetic risks associated with compensatory releases of salmon in the Baltic Sea
Anna Palmé Lovisa Wennerström
Peter Guban Nils Ryman Linda Laikre
Havs- och vattenmyndighetens rapport 2012:18
Havs- och vattenmyndigheten Datum: 2012-12-20
Ansvarig utgivare: Björn Risinger ISBN 978-91-87025-19-8
Preface
A majority of the original wild Baltic salmon populations has gone extinct. Historically, 84 rivers flowing into the Baltic Sea have harbored Atlantic salmon, but currently only 10 of these maintain self sustaining wild natural populations in safe numbers. Large scale releases of salmon are carried out in the Baltic mainly to compensate for natural reproduction that has been lost due to hydroelectric power plants that are blocking previous migratory routes. These compensatory releases are made in accordance with water court decisions. The aim of this study is to summarize what is currently known regarding the genetic risks associated with large scale releases of salmon in the Baltic Sea.
This report has been produced by the Division of Population Genetics, Department of Zoology, Stockholm University on request by the Swedish Agency for Marine and Water Management. The report is part of the Swedish flagship project “to ensure sustainable fishing in the Baltic Sea” within the framework of priority area nine of the EU Strategy for the Baltic Sea Region. The views expressed in this report are those of the authors and do not
necessarily represent the official position of the Swedish Agency for Marine and Water Management.
Funding was provided by the Swedish Agency for Marine and Water
Management and the BaltGene research program (funded by BONUS Baltic Organisations' Network for Funding Science EEIG). Additional support was obtained from The Sida Baltic Sea Unit and from the , the Nordic Council of Ministers, and Stockholm University.
I hope that this report will be useful in the future management of Baltic salmon and during the finalization of the European Union multiannual plan for the Baltic salmon, COM(2011) 470 final.
Gothenburg 2012
Ingemar Berglund, Director, Planning Department, Swedish Agency for Marine and Water Management
2.2.1. The Baltic salmon flagship project of the former Swedish Board of
Fisheries (now the Swedish Agency for Marine and Water Management) .... 14
2.2.2 The European Commission proposal on Baltic salmon stocks ... 15
2.3 Objectives of the present study ... 15
3.BIOLOGY OF THE ATLANTIC SALMON ... 16
3.1 Threat status of the Baltic salmon ... 16
4.EXPLOITATION AND MANAGEMENT OF BALTIC SALMON ... 20
4.1 ICES assessment units ... 20
4.2 Mixed fishery ... 20
5.CURRENT KNOWLEDGE ON GENETIC BIODIVERSITY OF BALTIC SALMON ... 22
5.1 Literature review ... 22
5.1.1 Early genetic studies of Baltic salmon ... 23
5.1.2 Genetic uniqueness of Baltic salmon... 23
5.1.3 Differentiation patterns within the Baltic Sea ... 24
5.1.4 Genetic variation within Baltic populations ... 24
5.1.5 Evolutionary history of Baltic salmon ... 24
5.1.6 Available genotypic data and tissue archives on Baltic salmon ... 47
6.LARGE SCALE RELEASES OF SALMON IN THE SWEDISH PART OF THE BALTIC SEA ... 48
6.1 Current salmon releases in Swedish waters ... 48
6.2 History of compensatory releases in Sweden ... 49
6.3 Hydropower plants and compensatory releases in Swedish Baltic salmon rivers ...50
6.3.1 Populations used for compensatory releases ... 51
6.3.2 Amount of compensatory released salmon ... 51
6.3.3 Procedures for producing smolt for releases ... 53
8.1 Straying rates of released salmon ... 66
8.2 Genetic variation in wild vs. hatchery salmon populations ... 69
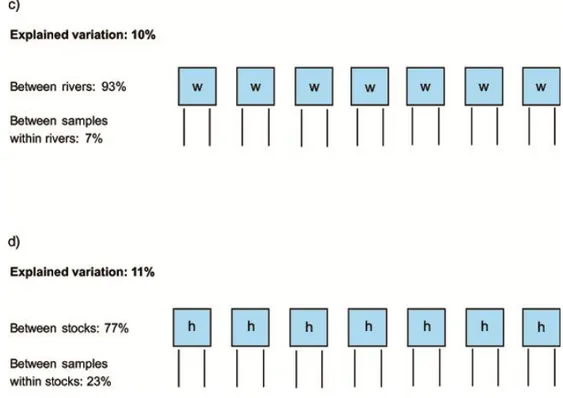
8.2.1 Hierarchical gene diversity analyses ... 69
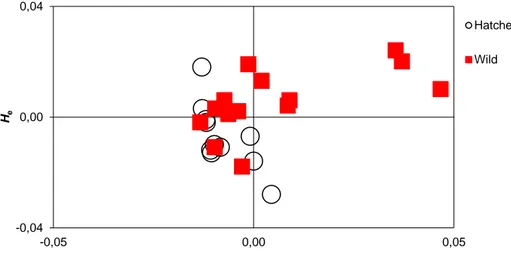
8.2.2 Diversity and divergence patterns in hatchery vs. wild populations ... 73
8.3 Effects on total genetic effective population size from population extinctions ... 75
8.4 Potentially unique genetic variation in hatchery stocks ... 78
8.5 Some reflections on genetic pros and cons of halting compensatory releases ... 79
9.FUTURE RESEARCH NEEDS ... 81
9.1 Documentation and archiving ... 81
9.2 Research ... 82
10.CONCLUSIONS AND RECOMMENDATIONS ... 83
10.1 Recommendations ... 84
11.ACKNOWLEDGMENTS ... 86
12.REFERENCES ... 87
Websites: ... 96
A majority of the original wild Baltic salmon populations, i.e. populations of Atlantic salmon (Salmo salar) in the Baltic Sea, has gone extinct. Historically, 84 rivers flowing into the Baltic Sea have harbored Atlantic salmon, but currently only 10 of these maintain self sustaining wild natural populations in safe numbers (CCB 2012). Large scale releases of salmon are carried out in the Baltic region to increase productivity of separate populations and to
compensate for natural reproduction that has been lost due to hydroelectric power plants that are blocking previous migratory routes.
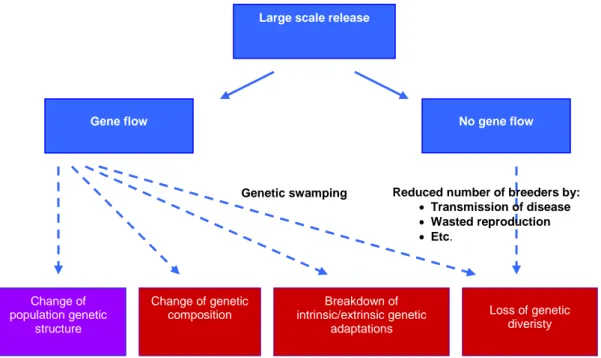
Already in the 1980s observations of pronounced genetic differentiation between populations inhabiting different rivers, coupled with indications that salmon hatchery stocks are genetically divergent from the wild populations they were meant to represent, have warranted conservation genetics researchers to warn against potential negative effects of large scale releases (Ståhl 1981, 1983, 1987). In brief, current large scale releases can cause the following four types of genetic risks for native populations: 1) loss of genetic variation, 2) loss of adaptations, 3) change of population composition, and 4) change of population structure (Laikre et al. 2010). These adverse genetic impacts have been recognized and documented for salmonid fishes for decades (Ryman 1981; Ryman & Utter 1987; Hindar et al.1991; Waples 1999; Naish et al. 2008; Nielsen & Hansen 2008). In 2011 these potential risks of large scale releases gained attention when the European Commission put forward a proposal of phasing out all compensatory releases of salmon in the Baltic area (European Commission 2011).
We have compiled and reviewed information regarding compensatory releases of salmon in Swedish rivers including spatio-temporal genetic variability patterns of wild and hatchery salmon populations in the Baltic region. We review and synthesize scientific information from both peer-review and “gray” literature, and have used available genetic data from both published and unpublished studies to address the following main questions:
What is currently known regarding the spatio-temporal genetic variability patterns of Atlantic salmon in the Baltic Sea?
How has the loss of salmon populations affected the overall capacity for Baltic salmon to maintain genetic variation?
What are the effects of releases on genetic variation between and within wild salmon populations?
seven additional reports. Together they cover genetic information from populations representing 35 Baltic river systems (Rivers Umeälven and Vindelälven counted separately) and c. 23 000 genotyped individuals. The main conclusions from these studies are that the Baltic salmon is genetically divergent from other Atlantic salmon populations and that there is a high degree of genetic structuring between populations in different rivers within the Baltic area. Further, there is a hierarchical grouping of populations in the Baltic, and three larger genetic groups, corresponding to populations in the north, east and south Baltic Sea have been found.
In Sweden, compensatory releases of salmon are performed in eight rivers flowing into the Baltic Sea and a total of more than 1.8 million salmon smolt are released annually in Sweden. Despite the hydropower companies’ policy to use local strains, fish of non-local origin is sometimes released. Further, in some hatcheries relatively few spawners are used, which may lead to an increased loss of genetic variation. Information regarding the number of released salmon, number of females and males used in rearing, and strains used for stocking is not easily accessible, and therefore assessment of genetic effects of large scale releases is not straightforward
Our analyses of published and unpublished genetic data indicate that a large part of the original genetic variation in Baltic salmon has already been lost due to extinction of individual populations and reduction in population sizes. There is a clear pattern of isolation-by-distance among wild populations, whereas no such pattern is found among hatchery stocks. Further, hatchery stocks typically exhibit lower genetic variation and are less divergent from each other than wild populations. However, hatchery stocks can harbor unique genetic variation and may thus be important to conserve.
The genetic effects of releases have not been monitored in the Baltic, but one scientific study indicates strong genetic homogenization of wild populations. Many of the changes of Baltic salmon gene pools occurred prior to the time when molecular genetic studies were possible. Thus, we are not likely to ever clarify exactly the changes that have occurred. Studies of salmonid releases in other parts of the world have in several cases documented altered genetic composition and reduced variability and viability. The extent of this threat needs further investigation. Until such data is available large scale releases should be stopped in line with the precautionary principle, provided that essential actions are implemented to protect remaining wild stocks from e.g. overharvest. Likewise, as many previous spawning areas as possible need to be
1. The Atlantic salmon in the Baltic Sea is genetically irreplaceable in that it represents one of three major evolutionary units of the species. Each present salmon river harbors at least one genetically distinct population. 2. The extinction of a large number of wild populations has been harmful to
the Baltic salmon; the capacity for retaining genetic variability has decreased as a consequence of a reduced genetically effective population size of the global population.
3. The global and the local effective population sizes have been further depleted through decreasing size of remaining local populations. 4. From a conservation genetics perspective the compiled information
suggests that the proposal of the European Commission to halt compensatory releases of salmon in the Baltic is logical and sound. 5. Large scale releases constitute a potential threat to Baltic salmon genetic
diversity. This is due to the genetic risks associated with i) gene flow from released hatchery stocks into wild populations, and ii) risks of overharvest of weak, wild populations because of increased numbers of salmon in the Baltic following the releases.
6. Little research has been devoted to empirically assessing the genetic effects of compensatory releases in the Baltic Sea, but observations from large scale salmonid releases in other geographical areas include: i) genetic homogenization of previously diverged populations, ii) complete or partial replacement of native gene pools, iii) break down of adaptations to local conditions, and iv) spread of diseases and parasites reducing absolute and effective sizes of native populations.
7. Comparisons of wild and hatchery stocks of the same river show that the genetic divergence between hatchery stocks is generally smaller than between wild ones. Further, there is a clear pattern of isolation-by-distance among wild populations, whereas no such pattern is found among hatchery stocks, suggesting that the natural genetic structure has not been
maintained in hatcheries. This genetic homogenization might affect the capacity for local adaptation.
8. We have found only one monitoring study on genetic effects of
compensatory releases in the Baltic Sea. In that study the scientists report a strong homogenizing effect on the genetic composition of the wild
population in the River Vindelälven. This population became increasingly similar to hatchery stocks released in the neighboring area, and migration from hatchery stocks into the wild population was estimated as over 10
result in loss of genetic variation, but the extent of such loss remains unclear.
11. Strategies are urgently needed for maintenance of genetic variation that only exists in hatchery stocks, and for restoring as much as possible of the global Baltic salmon population through re-establishing spawning areas and opportunities for natural reproduction.
Based on our evaluation of the genetic risks associated with large scale compensatory releases of salmon in the Baltic we provide the following recommendations:
1. Compensatory releases of salmon in the Baltic should be phased out. 2. Releases in remaining salmon rivers that support wild, viable populations
should be prohibited.
3. Conservation releases to support or re-establish weak/extinct populations can be used to protect and maintain as much as possible of the remaining Baltic salmon gene pool. The need for such releases should be evaluated on a case by case basis.
4. When releases are carried out they should always be monitored with
respect to genetic effects, including those from supportive breeding because of the risk of reducing the genetically effective size of local populations. 5. The conservation genetic goal for Baltic salmon should be to create a global
population that is as efficient as possible with respect to retaining genetic variation on a local and global scale.
6. A change of present fishing pressure is of key importance for the success of measures taken to improve the situation for, and the genetic status of, the Baltic salmon. It is critical that fishing pressures are modified in relation to changes in smolt production if compensatory releases are halted.
7. As many previous spawning areas and local populations as possible should be re-established.
8. The fate of individual hatchery stocks must be determined on a case by case basis. This can include i) using hatchery material for restoring or restocking rivers that presently do not support self sustaining populations, ii) keeping hatchery brood stocks or sea ranched populations as gene banks during a restricted period of time, and iii) prioritizing hatchery stocks with respect to their contribution to the global gene pool, and if necessary focus conservation actions on those stocks that contribute significantly. These
methods for consistent documentation and record keeping on hatchery breeding and release operations.
10. A review of existing archives of Baltic salmon tissue samples and genotypic data should be performed as soon as possible. Such resources provide an important basis for further genetic monitoring of Baltic salmon genetic biodiversity. Similarly, identifying the most critical gaps in currently available genotypic data constitutes a natural and important next step following the present synthesis report.
11. Several research issues remain to be addressed. Important cost effective work can be carried out without large scale additional genetic screenings building on already available genetic data.
Palmé is currently affiliated with the Swedish Agency for Marine and Water Management and can be contacted at anna.palme@havochvatten.se. Linda Laikre and Nils Ryman can be contacted at linda.laikre@popgen.su.se and nils.ryman@popgen.su.se, respectively.
Other publications generated within the framework of the present assignment include:
Palmé A, Wennerström L, Guban P, Laikre L (editors) 2012. Stopping compensatory releases of salmon in the Baltic Sea. Good or bad for Baltic salmon gene pools? Report from the Baltic Salmon 2012 symposium and workshop, Stockholm University February 9–10, 2012. Davidsons Tryckeri, Växjö, Sweden.
Palmé A, Wennerström L, Guban P, Ryman N, Laikre L. 2012. Conclusions on conservation genetic risks associated with compensatory releases of salmon in the Baltic Sea. A brief summary of a synthesis report to the Swedish Agency for Marine and Water Management. Department of Zoology, Division of
Population Genetics, Stockholm University, Sweden. These reports can be downloaded from: www.popgen.su.se
information is crucial for evaluating consequences of such a ban. Several aspects need to be considered when evaluating the present proposal including ecological, socioeconomic, and commercial and sport fisheries related issues. Also, the specific suggestion of phasing out compensatory releases within a seven year period must be evaluated. However, our current assignment is of a strictly genetic nature.
We review and synthesize what is currently known regarding genetic variability of Baltic salmon and how this variability is affected by large scale releases of hatchery reared individuals. Specifically, we evaluate the genetic risks of large scale releases and provide recommendations based on this synthesis.
2.1 Background
The Atlantic salmon is one of the most well studied species world wide with respect to population genetic structure. A study of genetic variation and possible spatial intraspecific differentiation based on quantitative characters was presented in the beginning of 1970s (Ryman 1972). Soon thereafter,
introduction of new techniques such as protein electrophoresis made it possible to explore allelic variation in distinct loci and these techniques were adapted to tissue analysis of salmonids (Allendorf et al. 1976). The first multi loci genetic studies of Atlantic salmon in the Baltic were carried out in the early 1980s and showed pronounced genetic differentiation between populations inhabiting different rivers (Ryman 1981, Ståhl 1981). Early genetic studies also indicated that hatchery salmon stocks were genetically differentiated from the wild populations they were meant to represent (Ståhl 1983, 1987).
These observations have warranted conservation genetics researchers to warn against possible losses of intraspecific biodiversity (=genetic diversity)
following human impact on natural populations. Warnings have included possible effects of river dam constructions that prohibit natural reproduction and thus can result in loss of genetically unique populations, and large scale compensatory releases that are carried out to compensate for lost natural reproduction but which can result in negative effects on native gene pools. Such negative effects can arise if the released individuals i) do not represent the natural genetic composition in areas of release and thus can change the genetic composition and/genetic structure, ii) carry parasites that can spread to the native populations resulting in reduced effective sizes, iii) do represent the natural populations genetically but reduce the effective population size through
salmon stock and the fisheries exploiting that stock” (European Commission 2011). This proposal includes the suggestion that releases of salmon in Baltic rivers should be phased out over a seven year period. Exceptions are
conservation releases that are carried out to re-establish populations in rivers that have lost their natural population or to support weak natural populations. Populations subjected to such conservation releases must, according to the proposal, be monitored genetically to be able to evaluate effects of the release on remaining natural gene pools (European Commission 2011).
The European Commission also proposes to allow releases in rivers with remaining wild salmon populations. The rivers with wild salmon are listed in Annex I of the proposal. The suggestion states that “released smolts in each river shall not exceed the estimated potential smolt production capacity of the river”, and further that “stocking shall be conducted in a way that safeguards the genetic diversity of the different salmon river stocks taking into account existing fish communities in the stocked river and in neighboring rivers while maximizing the effect of stocking”.
2.2 Political background of suggestion on halting
compensatory releases
Below is a brief summary of the political background to the current discussion on phasing out compensatory releases of salmon in the Baltic region and the genetic effects of maintaining or halting releases.
2.2.1. The Baltic salmon flagship project of the former Swedish
Board of Fisheries (now the Swedish Agency for Marine and
Water Management)
The European Union launched an EU Strategy for the Baltic Sea Region in 2009 (Council of the European Union 15265/1/09 REV 1;
http://ec.europa.eu/regional_policy/cooperate/baltic/index_en.cfm) and priority area 9 of this strategy focus on reinforcing sustainability of agriculture, forestry and fisheries. Within the framework of this work the Swedish Board of Fisheries (now the Swedish Agency for Marine and Water Management) launched a flagship project on enabling sustainable fishing of salmon including regional coordination efforts to implement the EU Baltic Sea salmon
management plan. A workshop was held at the HELCOM headquarters in Helsinki in October 2010 and a main conclusion from that workshop was that the genetic risks of salmon stocking needs to be recognized and addressed to enable biologically sustainable management of Baltic salmon (Swedish Board
biodiversity the specific objective of this initiative is to ensure that the genetic integrity and diversity of the Baltic salmon stock is safeguarded and in this context “a phasing out of release of salmon in rivers with man made obstacles and without potential for re-establishment of self sustaining wild salmon populations in order to protect the genetic diversity of the wild stocks” (Explanatory memorandum of the proposal).
The proposal separates stocking from restocking. It suggests stocking may only be conducted in wild salmon rivers (Chapter IV, Article 12 of the proposal), and lists 28 such rivers in Annex 1 of the proposal (cf. Table 2 in this report). Restocking of rivers with potential for self-sustaining wild salmon populations should be supported according to the proposal provided that the release aims to establish or enhance a viable self sustaining wild population. Conservation and management measures must also be in place, including pre- and post-release monitoring programs (Chapter VI, Article 13). Further, the member state must provide information to the Commission including “for each wild salmon river stock, available genetic information” and “the activity of stocking and direct restocking of salmon” (Chapter IX, Article 23).
2.3 Objectives of the present study
The aim of this study is to summarize what is currently known regarding the genetic risks associated with large scale releases of salmon in the Baltic Sea. More specifically, we review and synthesize:
current knowledge on gene level biodiversity of Atlantic salmon in the Baltic Sea (Chapter 5),
information regarding compensatory releases in Sweden (number of salmon released, proportion marked/tagged individuals, origin of released salmon, etc.; Chapter 6),
current knowledge regarding potential risks associated with large scale releases (Chapter 7),
results from empirical studies of genetic effects of releases in salmonids (Chapter 7.1).
Further, we use previously published and unpublished data to address
conservation genetic aspects associated with compensatory releases of salmon in the Baltic (Chapter 8).
naturally reproducing salmon populations in rivers and streams from western Russia to Iceland and south to northern Spain (NRC 2002).
Most Atlantic salmon populations are anadromous (Jones 1959); individuals spend their first years in their natal river before migrating to the sea (or to a lake for landlocked populations) where they grow and become sexually mature (Klemetsen et al. 2003). During the sea ranging phase, different populations occur in a mixture and although populations from the same area migrate roughly to the same feeding grounds there is no tendency of close kin from the same river to aggregate (Koljonen et al. 2005; Palm et al. 2008; HELCOM 2011). Atlantic salmon spend one to several years in the sea before returning to the rivers to spawn.
Spawning takes place during fall and winter, and one individual can spawn several times with migrations to the sea between spawning events (Klemetsen et al. 2003). The Atlantic salmon is characterized by a strong instinct to return to their natal river or stream to spawn (so-called homing behaviour; Stabell 1984; Hansen et al. 1993). Although the homing behaviour is not fully perfect - some individuals stray to nearby rivers resulting in gene flow between
populations of different rivers – this provides an opportunity for the salmon to genetically adapt to environmental conditions in their natal streams (e.g. Allendorf & Ryman 1987). Homing also results in the potential for relatively large genetic differences to occur over short geographical distances both within and among rivers (see review by Fraser et al. 2011). This in turn, means that a relatively large part of the genetic biodiversity of salmon is represented by genetic differences between individual populations. Losing individual populations thus can result in loss of a distinct part of the species gene pool that might represent a unique adaptation to a particular local environment (Allendorf & Luikart 2007).
3.1 Threat status of the Baltic salmon
The largest interference with Baltic salmon populations is the construction of water power plant stations, obstructing the route to spawning grounds (McCormick et al. 1998). Due to such constructions Atlantic salmon in the Baltic Sea is classified as Endangered (EN) according to the IUCN red list criteria although nationally, red list categories of salmon vary between Baltic Sea countries (Table 1; HELCOM 2007).
Table 1. IUCN threat status classification in national red lists.
Salmon IUCN threat status Country Reference
Critically endangered (CR) Poland www.helcom.fi
Endangered (EN) Denmark, Estonia,
Finland, Germany
Rassi et al. 2010; http://elurikkus.ut.ee; www.helcom.fi
Least concern (LC) Sweden Gärdenfors 2010
Unclear Latvia, Lithuania, Russia
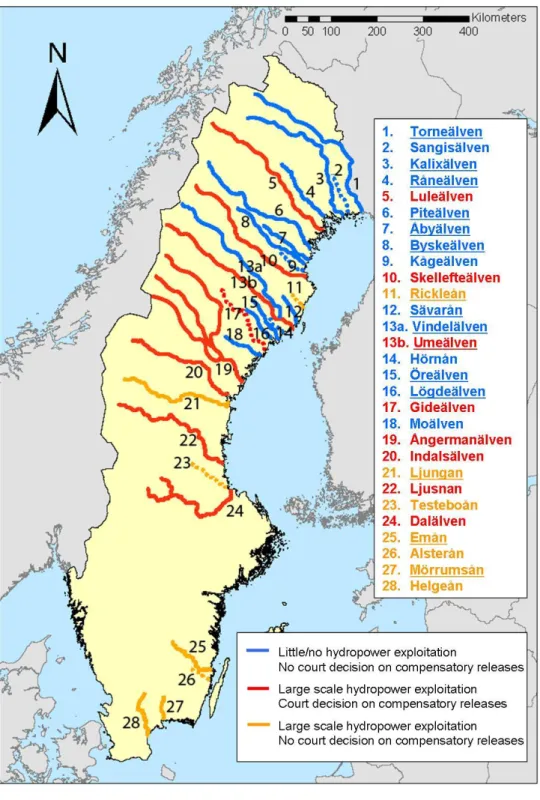
Historically, 84 rivers flowing into the Baltic Sea have harbored Atlantic salmon populations. Currently, only 10 of these maintain self sustaining wild natural populations in safe numbers (Figure 1). Seven of these rivers are located in Sweden (Table 2; Figure 1), one at the Swedish-Finnish boarder (River Torneälven/Tornionjoki) and one each in Finland (River Simojoki), Latvia (River Salaca), and Lithuania (River Nemunas). The European Commission classifies 27 of the 84 rivers as “wild salmon rivers” (Table 2; European Commission 2011).
Of current wild salmon smolt production, 90% is produced in Swedish rivers (River Torneälven included; ICES 2011). Hatchery produced and released salmon is estimated to constitute about 70% of the salmon in the Baltic Sea (ICES 2011), while just a few years ago 90% of Baltic salmon originated from hatcheries (ICES 2003)
(CCB classification)
Belarus 0 0
Denmark 0 0
Estonia 0 Pärnu, Kunda, Keila, Vasalemma
Finland Torneälven/Tornionjoki (shared with Sweden) Torneälven/Tornionjoki (shared with Sweden)
Germany 0 0
Latvia Salaca Salaca, Vitrupe, Peterupe, Irbe, Uzava, Saka,
Barta/Bartuva (shared with Lithuania)
Lithuania Nemunas Nemunas,
Barta/Bartuva (shared with Latvia)
Poland 0 0
Russia 0 - (not a member of the EU)
Sweden Kalixälven, Piteälven, Åbyälven, Byskeälven,
Vindelälven, Ljungan, Emån
Torneälven/Tornionjoki (shared with Finland)
Kalixälven, Råneälven, Piteälven, Åbyälven, Byskeälven, Rickleån, Sävarån,
Ume/Vindelälven, Öreälven, Lögdeälven, Emån, Mörrumsån, Ljungan
Figure 1. Baltic salmon rivers. The map is reproduced with kind permission from Coalition Clean Baltic (CCB 2012).
Baltic area. To maintain or increase commercial and sport fishery, and to compensate for lost natural reproduction due to power plant constructions, substantial numbers of hatchery reared salmon are released every year. In Sweden, releases include permissions by local authorities for improving sport fisheries (and/or for conservation purposes) as well as large scale
compensatory releases of fish for production losses caused by hydropower developments (Laikre & Palmé 2005; Laikre et al. 2006).
4.1 ICES assessment units
There is a general consensus that salmon in the Baltic Sea should be managed on a population level, i.e. on a river by river basis (Ståhl 1987; Koljonen et al. 1999; Verspoor et al. 1999; 2005; HELCOM 2011). The International Council for the Exploration of the Sea (ICES) has established six different assessment units for the Baltic Sea. These assessment units are:
1. Northeastern Bothnian Bay stocks, from River Perhonjoki to River Råneälven.
2. Western Bothnian Bay stocks, from River Lögdeälven to River Luleälven. 3. Bothnian Sea stocks, from River Dalälven to River Gideälven in Sweden,
and from River Paimionjoki to River Kyrönjoki in Finland. 4. Western Main Basin stocks.
5. Eastern Main Basin stocks, i.e. stocks in Estonian, Latvian and Lithuanian rivers.
6. Gulf of Finland stocks.
The grouping of Baltic rivers into assessment units is based on management objectives as well as biological and genetic characteristics of the populations (ICES 2011). The units make sense from a management perspective; stocks of a particular unit are believed to exhibit similar migration patterns and it can be assumed that they are subjected to the same fisheries, experience the same exploitation rates and are affected by management in the same way. The genetic variability between stocks of an assessment unit is smaller than the genetic variability between stocks of different units (ICES 2011).
4.2 Mixed fishery
Harvest at feeding grounds means that it is not possible to separate which populations are included in the harvest – a so-called mixed fishery. Open Sea
2010) but which has only to a limited extent been applied in Baltic waters using both genetic and life history data (e.g. Koljonen & McKinnel 1996; Koljonen & Pella 1997; Koljonen et al. 2005; Anderson et al. 2008).
At least until 2009, genetic data on catch composition was not used in salmon stock assessment in the Baltic Sea (ICES 2009). Rather, catch composition analyses in the Baltic have been focused on estimating proportions of wild fish, and hatchery fish from Finland and Sweden respectively (ICES 2011).
Of the total salmon catches in Sweden 2010 (418 tonnes), 39% represented offshore catches with an obvious risk of mixed fishery. River catches, which focuses directly on populations of individual rivers only represented 17%, whereas coastal catches represented 44% (ICES 2011). However, in 2011, the Swedish Agency for Water and Management (SwAM) decided to forbid offshore fishery with longline (In Swedish: drivande linor med krok) to 2013 (anchored floating gillnets (In Swedish: svajgarn) are already forbidden). The Swedish quota will instead only include river and coastal fisheries using traps (push-up traps and hoop nets (In Swedish: ryssja)) close to river mouths. During 2012, it is still allowed to take 40% of the Swedish quota of 34 327 salmon with longline, while 60% is earmarked for coastal fisheries with permanent fishing gears. There are intentions for the future to introduce similar regulations for the commercial trolling fishery at sea (Peter Funegård, SwAM, pers. comm.). Sport fisheries in rivers is outside national quotas, and sport fishermen have only a one fish daily bag limit during the annual time period when fishing is allowed in rivers.
Finland is the only other country besides Sweden in the Baltic region that has taking action in the same direction, however they allow fishing with longline for 4 000 salmon per year at maximum (of their total national quota of 31 667 salmon).
The first population genetic structure studies of Atlantic salmon were carried out in the early 1970s (e.g. Møller 1970; Payne et al. 1971; Behnke 1972; Payne 1974; Child et al. 1976). These studies, focusing on North American populations and using only single loci, indicated genetic sub structuring within the species. The methodology for analyzing several loci of Atlantic salmon providing opportunities to estimate of level of variation within and between populations was developed in the late 1970s using salmon from the British Isles (Cross & Ward 1980). The first study that involved some samples from Baltic waters was based on one single locus and focused only on genetic differences between European and North American salmon (Nyman & Pippy 1972). However, variation between Baltic and other European samples or variation within the Baltic Sea was not considered until later.
5.1 Literature review
To obtain information on what is currently known regarding genetic
composition and spatio-temporal patterns of the Baltic salmon we searched the literature using the database Science Citation Index (ISI Web of Science) and Google Scholar, as well as compiling non-scientific publications (“gray
literature”). As search criteria for scientific publications we used the following strings:
genetic AND (differen* OR structure OR divergen*) AND Baltic in ISI Web of Science database
genetic AND Salmo salar AND Baltic in the ISI Web of Science database
genetic AND Salmo salar AND Baltic in Google Scholar. A total of 37 scientific studies, based multiple nuclear loci and/or
mitochondrial DNA information, delineating patterns of Baltic salmon genetic diversity have been identified. “Gray” literature of Swedish salmon population comprises seven additional reports. Out of these 44, the 36 studies presenting data on number of individuals genotyped are summarized in Table 3a and b. In total, they cover genetic information from populations representing 35 Baltic river systems (Rivers Umeälven and Vindelälven counted separately), and c. 23 000 genotyped individuals.
It is difficult to construct search criteria that result in a completely exhaustive retrieval, and we do not claim that the present bibliography includes each and every study on genetic variability on Baltic salmon. We believe, however, that
Atlantic salmon is naturally substructured into multiple genetically differentiated and more or less reproductively isolated populations within as well as between major drainages (Ståhl 1981, 1987).
The genetic variation over the entire species range is divided into three major clusters – the western Atlantic, the eastern Atlantic and the Baltic (Ståhl 1987).
The greatest genetic difference is found between populations from the North America vs. Europe. This difference is twice as great as that between major clusters within Europe, i.e. Baltic vs. eastern Atlantic (Ståhl 1987).
Hatchery stocks exhibit lower levels of genetic variation than the wild populations they originate from (Ståhl 1983).
Large allele frequency changes occur between age classes in hatcheries indicating low number of parents to offspring produced for release (Ståhl 1983).
The pattern of genetic differentiation between hatchery stocks differs from that for natural populations. The major reason for the observed differences between hatchery and wild stocks is suggested to be the use of too few parents in hatchery production (Ståhl 1987).
The results from Ståhl´s studies had several implications for conservation genetic management which were pointed out early (Ståhl 1981; Ryman 1981; Ryman 1983; Ståhl 1987) but which were largely ignored at that time. It was not until the late 1980s (Koljonen 1989) and the late 1990s that other researchers continued the population genetic studies of Baltic salmon that Ståhl initiated (Table 3a and b).
5.1.2 Genetic uniqueness of Baltic salmon
Later studies have confirmed Ståhl´s work in the 1980s showing genetic uniqueness of Baltic salmon compared to other population in Atlantic waters (e.g. Verspoor et al. 1999, 2005; Nilsson et al. 2001; Koljonen et al. 2002; Johannesson & André 2006). The genetic distinctness of Baltic salmon populations is maintained through low migration rates through the Danish Belts (between the Baltic Sea and the Atlantic Ocean; Klemetsen et al. 2003). Further, Baltic salmon populations exhibit lower genetic variation than other Atlantic populations. This is probably due to bottleneck events at the
al. 2005; Ozerov et al. 2010). Genetic structuring within river systems has been observed in the Rivers Torneälven and Kalixälven (Ståhl 1987; Lohm 2002). Occasional straying occurs mostly among geographically proximate
populations resulting in an association between genetic and geographic distance (isolation by distance; Bourke et al. 1997; Koljonen et al. 1999; Vasemägi et al. 2001). Thus, genetic diversity in one population can to some degree depend on other geographically close populations (Vasemägi et al. 2005a).
5.1.4 Genetic variation within Baltic populations
Wild populations of Atlantic salmon are assumed to be genetically temporally stable (Ståhl 1987; Verspoor et al. 2005). This has been shown also for Baltic salmon specifically (Koljonen 1989) and when temporally separated samples from the same locality have been available they have most often been pooled together in genetic analyses. However, some studies have shown temporal heterogeneity in samples from hatchery stocks (Ståhl 1987; Säisä et al. 2003; Verspoor et al. 2005). Present day hatchery stocks have lost genetic diversity compared to wild populations, and are also genetically diverged from the wild populations they are meant to represent (Ståhl 1983; Säisä et al. 2003).
Effective population size (Ne; Wright 1969, p. 211) determines the rate of loss of
genetic variation. We have found no estimates on effective population size for wild salmon populations in the Baltic Sea. Genetic data appears to have been used only twice to estimate Ne of salmon in the Baltic region and those studies
involved brood stocks (Koljonen 2002; Säisä 2003).
5.1.5 Evolutionary history of Baltic salmon
On a higher hierarchical level there is a genetic substructuring of the total Baltic population, where northern, southern, and eastern salmon populations form different genetic groups (Koljonen et al. 1999; Säisä et al. 2005). This is most likely due to colonization of the Baltic Sea after the last ice age of two or more phylogeographic lineages, surviving the ice age in different glacial refugia (Koljonen et al. 1999; Nilsson et al. 2001; Säisä et al. 2005).
Exact routes of colonization and location of glacial refugia are under debate (Nilsson et al. 2001; Tonteri et al. 2007), but most authors agree on one freshwater refugium being located east or south of the ice sheath covering the whole area of the Baltic Sea during the last glaciation. As the ice retreated salmon from this southern or eastern refugium migrated into the Baltic Sea area, and made up the southern and eastern populations in the present Baltic
refugium has been questioned, however, and it is possible that also populations in the northern part of the Baltic Sea colonized the area from the east (Nilsson et al. 2001). Possibly an additional third phylogeographic lineage colonized the Baltic Sea from a southern refugium, making up present populations in the southernmost Baltic (Säisä et al. 2005).
River system River system number (Figure 1)
River Country Sampling
years
H/W Markers Approx.
number of ind.
He Ho h References
Byskeälven 8 Byskeälven Sweden 1999 W mtDNA 53 0.073 Nilsson et al.
2001 1979 1980 1994 W Allozymes 188 0.035 -0.183 Koljonen & McKinnel 1996; Koljonen & Pella 1997; Koljonen et al. 1999; Ryman & Ståhl 1981; Ståhl 1981, 1983, 1987 2003 W Microsatellit es 184 0.760 Koljonen 2006; Säisä et al. 2005 1980 H Allozymes 40 0.018 Ståhl 1983, 1987
Dalälven 24 Dalälven Sweden 1997
1998
B mtDNA 100 0.167 Nilsson et al.
2001;
1995 H mtDNA 50 0.000 Verspoor et al.
1999 1994 1999 Microsatellit es 100 0.522 -0.730 Koljonen 2006; Langefors 2005; Säisä et al. 2005
(Figure 1)
Dalälven cont. 24 Dalälven cont. Sweden 1988
1993
H Allozymes 250 0.045 0.078 Bourke et al.
1997; Koljonen & McKinnel 1996; Koljonen & Pella 1997; Koljonen et al. 1999 1994 H MHC IIB RFLP/DGGE 40 0.870 Langefors 2005 1994 Sequenced MHC IIB Langefors et al. 2001
1994 MHC IIB RFLP 41 0.810 0.830 Langefors et al.
1998
Daugava 48 Daugava Latvia 1998 B mtDNA 53 0.000 Nilsson et al.
2001
1996 H Allozymes 125 0.051 Koljonen et al.
1999
1996 H Microsatellites 70 0.700 Koljonen 2006;
(Figure 1)
Emån 25 Emån Sweden 1998
1999
W mtDNA 59 0.000 Nilsson et al.
2001 1999 2003 W Microsatellites 163 0.730 Koljonen 2006; Säisä et al. 2005 1981 H Allozymes 82 0.015 Ståhl 1983
Gauja 49 Gauja Latvia 1996 W Microsatellites 70 0.680 Koljonen 2006;
Säisä et al. 2005
Iijoki 79 Iijoki Finland 1981
1986 1987 1990 1993 1997 H Allozymes 594 0.030 -0.180 0.034 Koljonen 1995; Koljonen & McKinnel 1996; Koljonen & Pella 1997; Koljonen et al. 1989; Koljonen et al. 1999; 1973 1980 1992 1995 1997 1999 H Microsatellites 512 0.672 -0.679 Koljonen 2006; Koljonen et al. 2002; Säisä et al. 2003; Säisä et al. 2005; Vasemägi et al. 2005b
(Figure 1)
Iijoki cont. 79 Iijoki cont. Finland 1962 W Microsatellites 70 0.680 Koljonen et al.
2002; Säisä et al. 2003; Säisä et al. 2005
1997
1999
H mtDNA 15 Vasemägi et al.
2005b
Indalsälven 20 Indalsälven Sweden 1995
1997
H mtDNA 149 0.536 Nilsson et al.
2001; Vasemägi et al. 2005b 1979 1980 1993 H Allozymes 355 0.017 -0.042 Koljonen & McKinnel 1996; Koljonen & Pella 1997; Koljonen et al. 1999; Ryman & Ståhl 1981; Ståhl 1983, 1987 1995 1997 H Microsatellites 129 0.740 Koljonen 2006; Säisä et al. 2005; Vasemägi et al. 2005b
(Figure 1)
Kalixälven 3 Kalixälven Sweden 1989 W mtDNA 35 0.363 Nilsson et al.
2001 1979 1981 1987-1989 Allozymes 1124 0.059 -0184 Koljonen & McKinnel 1996; Koljonen & Pella 1997; Koljonen et al. 1999; Ryman & Ståhl 1981; Ståhl 1981, 1983, 1987 W Microsatellites 226 0.710 Koljonen 2006; Säisä et al. 2005
Kaitumälven 1979 W Allozymes 98 0.030 Ryman & Ståhl
1981; Ståhl 1981, 1983, 1987 Ängesån Satter 1981 W Allozymes 46 0.026 Ståhl 1983, 1987 Ängesån Vettasjoki 1981 W Allozymes 79 0.026 Ståhl 1983, 1987 Ängesån Vaitiojoki 1981 W Allozymes 29 0.031 Ståhl 1983, 1987
(Figure 1)
Keila 55 Keila Estonia 1996
1997
W mtDNA 59 0.000 Nilsson et al.
2001 1996 2000 W Microsatellites Minisatellites 117 0.678 0.631 Vasemägi et al. 2005a 1994 1995
W Allozymes 63 0.077 Koljonen et al.
1999
1997 W Microsatellites 53 0.690 Koljonen 2006;
Säisä et al. 2005;
Kemijoki 82 Kemijoki Finland 1981
1983 1988 1992 H Allozymes 559 0.040 -0.163 0.044 Koljonen 1989; Koljonen 1995; Koljonen & McKinnel 1996; Koljonen & Pella 1997
Kunda 61 Kunda Estonia 1996
1997
W mtDNA 48 0.034 Nilsson et al.
2001 1996- 1998 W Microsatellites Minisatellites 91 0.596 0.642 Vasemägi et al. 2005a 1994 1995
W Allozymes 59 0.078 Koljonen et al.
1999 1996 1999-2007 W Microsatellites 101 0.610 -0.630 0.620 Koljonen 2006; Ozerov et al. 2010; Säisä et al. 2005
(Figure 1)
Kymijoki 65 Kymijoki Finland 1981-1983 Allozymes 60 0.040 0.035 Koljonen 1989
Ljungan 21 Ljungan Sweden 1997
1998
B mtDNA 49 0.594 Nilsson et al.
2001
1996 W Allozymes 52 0.062 Koljonen et al.
1999
1998
2003
W Microsatellites 133 0.770 Koljonen 2006;
Säisä et al. 2005
Ljusnan 22 Ljusnan Sweden 1997
1998
H mtDNA 101 0.077 Nilsson et al.
2001; Vasemägi et al. 2005b
1993 H Allozymes 50 0.057 Koljonen &
McKinnel 1996; Koljonen & Pella 1997; Koljonen et al. 1999 1997- 1999 H Microsatellites 103 0.740 Koljonen 2006; Säisä et al. 2005; Vasemägi et al. 2005b
Loobu 59 Loobu Estonia 1996
1999 W Microsatellites Minisatellites 79 0.530 -0.532 0.542 -0.663 Vasemägi et al. 2005a 1994 1995
W Allozymes 50 0.068 Koljonen et al.
(Figure 1)
Luga 63 Russia 2003 Microsatellites 67 Koljonen 2006
Luleälven 5 Luleälven Sweden 1995
1997 H mtDNA 206 0.376 - 0.439 Nilsson et al. 2001; Verspoor et al. 1999; Vasemägi et al. 2005b 1981 1993 H Allozymes 140 0.02 5-0.05 6 0.094 Bourke et al. 1997; Koljonen & McKinnel 1996; Koljonen & Pella 1997; Koljonen et al. 1999; Ståhl 1983, 1987; 1995 H MHC IIB RFLP/DGGE 38 0.86 1 Langefors 2005 1995 H Sequenced MHC IIB Langefors et al. 2001 1995 H MHC IIB RFLP 36 0.81 0 0.860 Langefors et al. 1998 1995 1997 H Microsatellites 158 0.52 3-0.76 0 Koljonen 2006; Langefors 2005; Säisä et al. 2005; Vasemägi et al. 2005b
(Figure 1)
Lögdeälven 16 Lögdeälven Sweden 1994
1995
W mtDNA 43 0.047 Nilsson et al.
2001 1995 W Microsatellites Minisatellites 49 0.77 2 0.774 Vasemägi et al. 2005a 1979 W Allozymes 69 0.04 7 Koljonen & McKinnel 1996; Koljonen & Pella 1997; Koljonen et al. 1999; Ryman & Ståhl 1981; Ståhl 1981, 1983, 1987 1995 2003 W Microsatellites 99 0.73 0 Koljonen 2006; Säisä et al. 2005
Mörrumsån 27 Mörrumsån Sweden 1996 W mtDNA 51 0.000 Nilsson et al.
2001 1994 W Allozymes 67 0.08 2 Koljonen et al. 1999 MHC IIB RFLP/DGGE 46 0.64 5 Langefors 2005 1993 2003 W Microsatellites 227 0.56 0-0.72 0 Langefors 2005; Säisä et al. 2005 1993 Sequenced MHC IIB Langefors et al. 2001 1993 MHC IIB RFLP 13 0.63 0 0.690 Langefors et al. 1998
(Figure 1)
Narva 62 Narva Estonia/
Russia 1998 2000 H Microsatellites Minisatellites 54 0.722 0.717 Vasemägi et al. 2005a 1999 2001 H Microsatellites 110 0.670 0.660 Koljonen 2006; Ozerov et al. 2010
Neva 64 Neva Russia 1995 H mtDNA 45 0.087 Nilsson et al.
2001 1999-2007 H Microsatellites 397 0.600 -0.750 0.630 -0.735 Koljonen et al. 2002; Koljonen 2006; Ozerov et al. 2010; Ryynänen et al. 2007; Säisä et al. 2005; Tonteri et al. 2005; Tonteri et al. 2007; 1996 1998 H Microsatellites Minisatellites 70 0.733 -0.761 0.724 -0.745 Vasemägi et al. 2005a 1990 1993 1995 1997 W Allozymes 370 0.064 Koljonen 1995; Koljonen & McKinnel 1996;Koljonen & Pella 1997; Koljonen et al. 1999; Tonteri et al. 2005
Neva cont. 64 Neva cont. Russia H SNP 42 0.18 0 0.180 Ryynänen et al. 2007 1983 H Allozymes 261 0.04 4 0.041 Koljonen 1989 Neva (Laukaa, Finland) 1981 H Allozymes 70 0.03 7 0.043 Koljonen 1989
Oulujoki 77 Oulujoki Finland 1981
1992 1997 H Allozymes 288 0.05 8-0.07 6 0.056 Koljonen 1989; Koljonen 1995; Koljonen & McKinnel 1996; Koljonen & Pella 1997; Koljonen et al. 1999
Allozymes 180 Koljonen &
McKinnel 1996; Koljonen & Pella 1997 1940 W Microsatellites 69 0.73 0 Säisä et al. 2003 1995 1997 H Microsatellites 227 0.66 0-0.68 2 Koljonen 2006; Koljonen et al. 2002; Säisä et al. 2003; Säisä et al. 2005; Vasemägi et al. 2005b
H mtDNA 58 Vasemägi et al.
(Figure 1)
Pärnu 53 Pärnu Estonia 1997 W mtDNA 23 0.000 Nilsson et al.
2001
1997 W Microsatellites 26 0.710 Koljonen 2006;
Säisä et al. 2005;
Råneälven 4 Råneälven Sweden 2003 W Microsatellites 35 Koljonen 2006
Simojoki 81 Simojoki Finland 1981-
1983 1992 1993 1995 W Allozymes 975 0.048 -0.064 0.044 -0.083 Bourke et al. 1997; Koljonen 1989; Koljonen 1995; Koljonen & McKinnel 1996;Koljonen & Pella 1997; Koljonen et al. 1999
1997 W Microsatellites 139 0.700 Koljonen et al.
2002; Säisä et al. 2005; Koljonen 2006
1995 mtDNA 50 0.041 Verspoor et al.
(Figure 1) Skellefteälven 10 Skellefteälve n Sweden 1995 1996 H mtDNA 191 0.440 -0.463 Nilsson 1997; Nilsson et al. 2001; Vasemägi et al. 2005b 1996 H Microsatellit es Minisatellites 52 0.726 0.722 Vasemägi et al. 2005a 1995 1996 H Microsatellit es 202 0.498 -0.700 Koljonen 2006; Nilsson 1997; Säisä et al. 2005; Vasemägi et al. 2005b 1993 H Allozymes 434 0.020 -0.046 Koljonen & McKinnel 1996; Koljonen & Pella 1997; Koljonen et al. 1999; Ståhl 1983, 1987
Sävarån 12 Sävarån Sweden 2005
2006
W Microsatellit
es
98 0.726 0.727 Nilsson et al.
(Figure 1)
Torneälven 1 Torneälven Finland/
Sweden 1979-2000 W Allozymes 846 0.061 0.023 -0.074 Bourke et al. 1997; Koljonen & McKinnel 1996; Koljonen & Pella 1997; Koljonen et al. 1999; Ryman & Ståhl 1981; Ståhl 1981, 1983, 1987 1989 1994 1995 W mtDNA 185 0.115 -0.220 Nilsson et al. 2001; Verspoor et al. 1999 W SNP 36 0.150 0.150 Ryynänen et al. 2007 W Sequenced GH1 gene Ryynänen & Primmer 2004 2000 W Microsatellit es 219 0.590 -0.712 0.590 -0.600 Koljonen 2006; Koljonen et al. 2002; Ryynänen et al. 2007; Tonteri et al. 2005, 2007
Torneälven cont. 1 Torneälven cont. Finland/ Sweden 1992 1993 H Allozymes 629 0.04 7 0.080 Bourke et al. 1997; Koljonen & McKinnel 1996; Koljonen & Pella 1997; Koljonen et al. 1999 H Microsatellites 179 0.70 2 Koljonen 2006; Koljonen et al. 2002
B Microsatellites 61 Vasemägi et al.
2005b
B mtDNA 61 Vasemägi et al.
2005b 1981 1992 B Allozymes 380 0.04 8 0.053 Koljonen 1989; Koljonen 1995 U Microsatellites Minisatellites 36 0.52 0 0.500 Tonteri et al. 2010
Lainio 1979 W Allozymes 14 0.027 Ryman & Ståhl
1981; Ståhl 1981, 1983, 1987
Kukkola 1980 H Allozymes 50 0.031 Ryman & Ståhl
1981; Ståhl 1983, 1987 Mouth of Torneälven 1980 H Allozymes 130 0.027 Ståhl 1983, 1987
(Figure 1)
Umeälven 13b Umeälven Sweden 1992
1995 2002 H mtDNA 184 0.52 7 Nilsson et al. 2001; Vasemägi et al. 2005b 1994 1995 2002 H Microsatellites 191 0.4 73-0.6 50 Koljonen 2006; Langefors 2005; Säisä et al. 2005; Vasemägi et al. 2005b 1995 H Microsatellites Minisatellites 50 0.6 74 0.68 0 Vasemägi et al. 2005a 1989 1990 Allozymes 296 0.0 30-0.1 04 Koljonen & McKinnel 1996; Koljonen & Pella 1997; Koljonen et al. 1999 1994 H MHC IIB RFLP/DGGE 45 0.6 84 Langefors 2005 Sequenced MHC IIB 45 Langefors et al. 2001 MHC IIB RFLP 26 0.5 00 0.42 0 Langefors et al. 1998
Vasalemma 54 Vasalemma Estonia 1996
1997 W mtDNA 27 0.00 0 Nilsson et al. 2001 1994 1995 W Allozymes 43 0.0 71 Koljonen et al. 1999
Venta 45 Venta Latvia/ Lithuania 1996 W Allozymes 94 0.0 60 Koljonen et al. 1999 W Microsatellites 66 0.7 00 Koljonen 2006; Säisä et al. 2005
Vindelälven 13a
Vindel-älven Sweden 1985-2003 W mtDNA 481 0.43 0-0.46 4 Nilsson 1997; Nilsson et al. 2001; Vasemägi et al. 2005b W SNP 44 0.1 20 0.10 0 Rynnänen et al. 2007 1985-2003 W Microsatellites 637 0.4 10-0.6 70 0.47 0 Koljonen 2006; Nilsson 1997; Ryynänen et al. 2007; Säisä et al. 2005; Tonteri et al. 2005; Tonteri et al. 2007; Vasemägi et al. 2005b 1995 W Microsatellites Minisatellites 50 0.6 68 0.67 8 Vasemägi et al. 2005a 1989 1990 Allozymes 100 0.0 40 Koljonen & Pella 1997; Koljonen et al. 1999 W Microsatellites Minisatellites 37 0.4 90 0.47 0 Tonteri et al. 2010 Table 3a cont.
Ångerman-älven 19 Ångerman-älven Sweden 1995 H mtDNA 184 0.48 0-0.49 1 Nilsson 1997; Nilsson et al. 2001; Vasemägi et al. 2005b 1993 H Allozymes 100 0.0 48 Koljonen & McKinnel 1996; Koljonen & Pella 1997; Koljonen et al. 1999 1995 H Microsatellites 168 0.4 93-0.7 50 Koljonen 2006; Nilsson 1997; Säisä et al. 2005; Vasemägi et al. 2005b
River system River system number (Figure 1 and 2) River Sampling years Year classes H/W Type of marker Approx. number of ind. He Ho h References Dalälven 24 Dalälven 1988 1993 1997 at least 1993 1996-1998 H Allozymes 640 0.09 8-0.13 0 Jansson 1995; Jansson & Öst 1998; Öst & Jansson 2001 mtDNA 155 0.160-0.170 Indalsälven 20 Indalsälven 1987 1988 1990 1992 1997 at least 1987 1988 1992 1996 H Allozymes 338 0.08 4-0.12 2 Jansson 1995; Öst & Jansson 1999, 2001 mtDNA 74 0.520
Kalixälven 3 Kalixälven 1987-1989 unknown W Allozymes 457 0.14
4
Jansson 1993, 1995
Kaitumälven 1987-1989 unknown W Allozymes 239 0.14
3
0.150 Jansson 1993,
1995
Ängesån 1987-1989 unknown W Allozymes 488 0.15
7-0.17 3
0.200 Jansson 1993,
Ljungan 21 Ljungan 1986 1996 1998 at least 1995-1998 H/W Allozymes 378 0.106 -0.160 Jansson 1997; Öst & Jansson 1999, 2001 mtDNA 49 Ljusnan 22 Ljusnan 1992 1998 at least 1992 1997 1998 H Allozymes 252 0.111 -0.122 0.070 Jansson 1995; Öst & Jansson 1999, 2001 mtDNA 51 Luleälven 5 Luleälven 1992 1997 1992 1996 H Allozymes 140 0.107 -0.141 0.560 Jansson 1995; Öst & Jansson 2001 mtDNA 38 Mörrumsån 27 Mörrumsån 1994 1996
unknown W Allozymes 98 Jansson & Öst
1998 mtDNA 51 0.000 Skellefteälven 10 Skellefte-älven 1993 1994 at least 1993 1994 H Allozymes 268 0.097 -0.103 0.440 Jansson 1995; Öst & Jansson 2001 mtDNA 50
Torneälven 1 Lainioälven unknown unknown W mtDNA 14 0.48 0 Jansson & Öst 1998 Torneälven 1988 1989 unknown H/W Allozymes 556 0.153 0.140 -0.210 Jansson 1993, 1995 Umeälven 13b Umeälven 1987 1988 1992 1993 1987-1992 H/W Allozymes 398 0.075 -0.160 Jansson 1997; Jansson & Öst 1998; Öst & Jansson 2001 mtDNA 41 0.51 0-0.54 0 Ångerman-älven 19 Ångerman-älven 1992 at least 1992 H Allozymes 100 0.085 -0.125 Jansson 1997; Jansson & Öst 1998, 2001 mtDNA 63 0.49 0
individual Baltic salmon have been genotyped. If the ICES WGBAST baseline data generated between 1995-2008 by Koljonen´s lab (parts of it already published in scientific peer review publications) is included this figure increase to almost 24 000 individuals. Presumably, this raw data is still accessible from the researchers that have carried out the studies (Table 3a and b).
The extent to which tissue or DNA archives exists that can be used for future genetic studies are available is not clear. The tissue bank at the Division of Population Genetics, Department of Zoology, Stockholm University comprises a total of 9 051 individual salmon, and SLU Department of Wildlife, Fish and Environmental Studies in Umeå has DNA samples from approximately 6 500 individual salmon. To our knowledge, no tissue samples have been saved from the research work done at the Swedish Salmon Research Institute in Älvkarleby (LFI; see Chapter 6.2). It is at the moment unclear to us if there are other research groups in the Baltic region that have access to tissue or DNA
collections. Securing both existing genotypic databases and possible tissue and DNA archives are of vital importance for future genetic monitoring of Baltic salmon genetic biodiversity (Laikre et al. 2008; Jackson et al. 2012).
Large scale releases of Atlantic salmon and other salmonid fishes have been carried out for over a century more or less world wide (Laikre 1999 and
references therein). Salmonid species including Atlantic salmon have also been introduced outside their native range, for instance to Chile which is now a world leading producer of salmon based exclusively on the introduction and farming of this non-native species (Gajardo & Laikre 2003).
Conservation genetic concerns about the effect of releases on native gene pools have been expressed by conservation and population geneticists since it has been possible to generate information on genetic differentiation and
substructuring (Ryman 1981; Ryman & Ståhl 1981; Allendorf & Phelps 1981). In Baltic area releases of salmon have occurred since the 19th century. In this
chapter we summarize the background, history and current knowledge on releases of Atlantic salmon in the Swedish part of the Baltic Sea.
6.1 Current salmon releases in Swedish waters
Stocking of salmon in Swedish waters is presently conducted for two purposes: 1) to compensate for production loss caused by hydropower developments which prohibit natural migration of spawners to reproduction areas in rivers and migration of smolt to feeding areas in the Baltic, and 2) to support weak natural populations to increase local harvest potential.
The amount of salmon to be released for compensating effects of hydropower plants and where geographically releases are to be conducted is determined by Swedish Water Court rulings. To perform the second type of release, permit from the local county administrative board is needed since 1955. During the period 1995-2001 95 such permits were issued of which 66 and 83 include information on released stock and number of fish, respectively (Laikre & Palmé 2005; Laikre et al. 2006). Compared to compensatory releases, salmon releases authorized by county administrative boards constitute only a minor fraction. The intention of conservation releases is to cease as soon as the natural reproduction has reached acceptable levels. For instance, the River Dalälven salmon hatchery strain has been released into the River Testeboån to increase productivity of this river (Laikre et al. 2006; HELCOM 2011). For such conservation releases, pre-smoltificated salmon (larvae/fry and/or eggs) with low survival rate is often used (Jens Persson, SLU, pers. comm.), in contrast to compensatory measures where mostly smoltificated individuals are released.
The first Swedish salmon hatchery was established in 1864 in River Umeälven, but when hydro power plants began to block migratory routes of salmon in late 1800 the first solution was to build fish ladders. However, in 1913 a proposal of rearing of smolt for release was put forward and was approved (Lindroth 1984). Building of hydro power stations in larger salmon rivers in Sweden started in the 1940s. In 1945 an investigation group was established to give guidelines for compensatory measures with respect to migratory salmon. Their guidelines were presented in 1951 and included that i) compensatory measures should be established for each river, ii) experiments with breeding and releasing of smolt should continue, and iii) a laboratory for these efforts should be constructed. In 1952 in such a laboratory was built in Hölle in the Province of Jämtland. In 1961 the Swedish Salmon Research Institute (LFI) was established in Älvkarleby just south of Gävle. This institute was financed by hydro power companies (Lindroth 1984).
The work and suggestions from the investigation group formed the basis for how river plans and compensatory releases and water court rulings on such releases were performed. The steps were as follows:
1. Hydro power companies apply to the Environmental court suggesting amount of annual compensatory releases that they can perform in a particular river.
2. The Environmental Court consults with the Swedish Board of Fisheries (Fiskeriverket) and the State Attorney office (Kammarkollegiet).
3. The Environmental Court takes a preliminary decision on amount of smolt to be released, followed by a permanent decision.
4. The County Administrative Boards are the bodies that are to control the performance of the rulings.
5. The Swedish Salmon Research Institute provided advice to both the Swedish Board of Fisheries and to the hydro power companies on releases (Lindroth 1984).
The question on the extent of smolt releases has caused large problems in the court process where agreements must be reached between the hydro power companies and by the fish experts employed by the Environmental courts. The idea is to compensate for lost natural reproduction and to release smolt in the
Swedish Water Court decisions follow the "äldre vattenlagen" SFS 1918:523 to 1993, the "nya vattenlagen" 193:291 to 1998, and since 1999 the Swedish Environmental Code 1998:808. Today, hydropower production is high in Sweden; in 2009, almost half (48.8%) of the total net electricity production in Sweden was produced by the current 1900 hydropower plants (SEA 2010). About 50 of these plants have a capacity of 100MWh or more (SEA 2010), and most of these large stations were built in the mid 20th century
(www.vattenfall.se).
Rulings regarding compensatory releases stem from awide period of time, from 1960s to 2006. Only a few of the enhancement obligations are final judgments (for the Rivers Luleälven, Indalsälven, and Ångermanälven) while the majority are temporary decisions and still under investigation (Karl-Erik Nilsson, County Administrative Board of Norrbotten and Hans Olofsson, County Administrative Board of Västernorrland, pers. comm.).
6.3 Hydropower plants and compensatory
releases in Swedish Baltic salmon rivers
There are around 1900 hydropower plants in Swedish rivers, and the majority of them are located in 29 rivers flowing into the Baltic Sea that have or used to have natural salmon populations (Figure 2). Compensatory releases are today carried out in eight of these rivers (Figure 2; Appendix), of which six of them have no wild salmon and are totally dependent on hatchery reared individuals to not lose their status as a salmon river. Court decision years and rulings for compensatory releases in individual rivers are presented in Appendix. In most rivers exploited for hydropower purposes, there are no (or poor) possibilities for fish to migrate up the power plant dam to find spawning
grounds. In some rivers, constructed fish ladders enable migration some tens of kilometers up the river.
For 22 of the Swedish salmon rivers flowing into the Baltic there are some legal protection from further water power plant developments (for the entire river or parts of the main river and/or tributaries) according to the Swedish
Environmental Code (ch. 4, §6; see Appendix). Of those 22 rivers, four - Rivers Kalixälven, Piteälven, Torneälven, and Vindelälven - are classified as rivers of national importance (In Swedish: nationalälv).
6.3.1 Populations used for compensatory releases
A total of 30 salmon strains are used for large scale compensatory releases and stocking authorized by county administrative boards (Laikre et al. 2008, their Table 6). Regarding stocks used for compensatory releases, such information is available in an easily accessible way only for years 1999-2010. Court decisions do not specify the origin of releases in most cases, but the hydropower
companies have adopted a policy of using local strains. However, in some cases non-local strains are used (e.g. Skellefte-strain is used in the River Gideälven) and in some cases the strain is unknown (database from Jens Persson, SLU). Also, some water court decisions allow salmon to be replaced by sea trout, or vice versa (e.g. in the River Indalsälven).
6.3.2 Amount of compensatory released salmon
The number of salmon obliged to be released are to be found in court decisions for individual rivers. According to these court decisions, in total c. 1.7 million salmon should be released annually in Swedish rivers flowing into the Baltic. However, these obligations can during individual years differ substantially from what is actually released. During the time period 1992-2010 (data from LFI yearbooks), c. 47 million hatchery reared individuals (of which c. 34 million have been smolt) have been released in Swedish Baltic rivers (Figure 3a-i), which make an annual average of c. 2.5 million individuals (of which c. 1.8 million are smolt). Of the total amount of salmon individuals released during these 19 years, c. 13 millions have been fin-clipped (the regulation regarding fin-clipping of all released fish in Sweden came into force in 2003/2004) and c. 270 000 have been Carlin tagged.
The total number of released individuals includes smolt, fry, and eggs.
However, many court decisions specify that smoltificated individuals should be used for compensatory releases. Releases of fry and eggs may be the result of over production in hatcheries, experimental activities (concerning marking of individuals), and/or releases of fry and eggs as a replacement of smolt. Such releases should thus in some cases be seen as a part of the compensatory releases (Jens Persson, SLU, pers. comm.) but within the scope of this project it has been impossible to distinguish between situations when they should be seen as part of compensatory releases and when they should not.
Figure 2. Swedish salmon rivers. Hydropower exploitation and compensatory release status for rivers are shown as blue, red, and yellow. Rivers marked with dashed lines are those without protection according to the Swedish Environmental Code, and rivers with wild salmon populations, as classified by the European Commission, are underlined in the figure legend. Note that Finnish compensatory releases are conducted in the River Torneälven.
separated from those resulting from possible natural reproduction. When spawners are collected, hatcheries have their own policies of mixing wild and hatchery produced males and females, dependent on the possibility for wild reproduction in that particular river.
Exactly how breeding at individual hatcheries is carried out is difficult to follow in detail. During the 1970-1980s it was noted that few parents were often used, resulting in inbreeding and inbreeding effects (Ståhl & Ryman 1987). Similarly, recommendations of mixing parent fish from different rivers were put forward (Rasmuson 1968). These problems do not appear to exist today. However, as far as we have been able to find out, the production of salmon smolt in hatcheries is not fully based on knowledge on possible within-river structure. For example, when collecting females and males to be used for rearing, the intention appears to be to maximize the genetic variation among spawners and fish are therefore collected during the entire returning to the river-period (i.e. spawners will represent both early and late migrating fish).
However, as far as we know, the fertilization is carried out without separating these groups of returning fish which implies that a potential genetic difference between early and late migrating fish is lost. Similarly, hatchery reproduction can never mimic natural conditions as mate choice and potential sexual selection is not possible.
0 100 000 200 000 300 000 1992 1994 1996 1998 2000 2002 2004 2006 2008 2010 N um ber of re le a s e d s Year Releases (smolt) 0 5 000 10 000 15 000 20 000 1992 1994 1996 1998 2000 2002 2004 2006 2008 2010 N umbe r of re le a s e d s a lm on Year River Gideälven 0 200 000 400 000 600 000 800 000 1 000 000 1 200 000 1 400 000 1992 1994 1996 1998 2000 2002 2004 2006 2008 2010 N umbe r of re le a s e d s a lm on River Indalsälven c) b)
0 10 000 20 000 30 000 40 000 1992 1994 1996 1998 2000 2002 2004 2006 2008 2010 N umbe r of re le a s e d Year 0 200 000 400 000 600 000 800 000 1992 1994 1996 1998 2000 2002 2004 2006 2008 2010 N umbe r of re le a s e d s a lm on Year River Ljusnan 500 000 1 000 000 1 500 000 N umbe r of re le a s e d s a lm on River Luleälven f) e)
0 100 000 200 000 300 000 1992 1994 1996 1998 2000 2002 2004 2006 2008 2010 N umbe r of re le a s e d Year 0 100 000 200 000 300 000 400 000 500 000 1992 1994 1996 1998 2000 2002 2004 2006 2008 2010 N umbe r of re le a s e d s a lm on Year River Skellefteälven h)