Summary
The radiation environment to which the population of Sweden is exposed is dominated by medical investigations and background radiation from the ground and building materials in our houses. That is the conclusion of the first general Swedish summary of environmental monitoring data and dose calculations within the field of radiation. The report shows that people’s behaviour in the form of their exposure to the sun and smoking has a major impact on the risk of suffering radiation injuries. The radiation dose received by individuals can also be high as a result of high indoor radon concentrations or high concentrations of naturally occurring radionuclides in drinking water.
On the basis of the results from the radiation environment monitoring, mapping and a number of long-term research projects, the SSI has for the first time summarised an overall picture of the radiation environment in Sweden. The report presents environmental conditions and trends for various radiation sources and estimated average doses for the population and for population groups subject to a particularly high level of exposure. Such groups could for example consist of smokers as regards radon and reindeer herdsmen as regards caesium-137.
There are many different types of radiation sources in the Swedish environment. Natural sources include the sun, particles from outer space, radon in the air and various radioactive substances in the ground. Mankind also produces radiation, e.g. in solariums, radio transmitters, power lines and X-ray equipment and from radioactive substances that are formed through nuclear reactions.
The Swedish Radiation Protection Authority (SSI) is responsible for radiation protection for the population and the environment. The authority therefore carries out long-term environmental monitoring concerning radiation in Sweden. Municipal and other authorities also measure and map the Swedish radiation environment. Environmental monitoring of the radiation environment has been undertaken in Sweden since the 1950s with varying objectives and scope. Much of the monitoring concerns the spreading of radioactive substances from atmospheric nuclear weapons testing, the Chernobyl accident and nuclear plants. Naturally occurring radioactive substances are also monitored in drinking water, indoor air, the ground and elsewhere, as are UV radiation and electromagnetic fields.
Doses received by the population
As smoking has such a major impact on the risks relating to radon, the total doses from ionising radiation received by non-smokers and smokers are reported separately. The average radiation dose to which the non-smoking part of the Swedish population is exposed is estimated by the SSI to be 2.4 mSv/year (Figure S1).
The radiation doses received by the population from cosmic radiation (0.3 mSv/year) and from potassium in the body (0.2 mSv/year) generally only vary marginally between individuals. For the other sources that are reported, the variation between individuals is considerable. The largest average source (0.9 mSv/year) is represented by medical investigations. Naturally occurring radioactive substances in the ground and in building materials give an average of 0.6 mSv/year, while natural occurring radionuclides that
enter the body via food and water give an annual dose of approx. 0.2 mSv. Radon in indoor air gives an average annual radiation dose of approx. 0.2 mSv for non-smokers. The dose from caesium-137 is generally low compared with other radiation sources (0.01 mSv/year).
Higher doses for specific groups
Although the average radiation dose is not considered to be a problem, certain individuals can be exposed to considerably higher doses. Figure S1 shows examples of annual doses for some population groups or individuals which deviate from the average in different ways.
Smoking causes the risk associated with radon in indoor air to increase dramatically. The risk associated with the average concentration of radon in indoor air corresponds to a dose of several mSv per year for a daily smoker. The combination of smoking and high radon concentrations can result in much higher risks and smokers account for a large majority of the approximately 450 cases of lung cancer that are caused by radon every year in Sweden. For smokers as a whole (including former smokers, occasional smokers, etc.), radon is the dominant average dose contribution (Figure S1).
People who eat a lot of foods with high concentrations of caesium-137 from areas which were affected most by the Chernobyl accident can receive an additional dose of caesium-137 of 1-2 mSv/year. The average dose in the risk group reindeer herdsmen is however approximately 0.2 mSv/year. However, as Figure S1 shows, the radiation dose from a large intake of reindeer meet is instead dominated by naturally occurring polonium-210, which is also found in reindeer meat.
0,0
0,5
1,0
1,5
2,0
2,5
3,0
3,5
4,0
medical diagnostics caesium-137naturally occurring radio nuclides in the food radon in indoor air potassium in the body
the ground and building material cosmic radiation
Neve
r-smok
e
rs
Smokers (inc. former smokers)
Drinki ng w a ter prob lem F reque nt flyer Rein de er her d e rs
effective dose (mSv/year)
Figure S1. Average effective annual dose received by the population broken down between
never-smokers and never-smokers (daily never-smokers, former daily never-smokers, occasional never-smokers, etc.) and examples of doses received by individuals under special circumstances (see Table 25).
One radiation source that is perhaps unknown to many is cosmic radiation in connection with air travel. Although the contribution received by most people is small, a person who makes a journey outside the Nordic region once a week is estimated to receive an extra dose of 1 mSv over a period of 12 months.
People whose drinking water supply comes from a well can also receive a much higher dose from high concentrations of various naturally occurring radioactive substances in drinking water. In the example shown here, the total extra dose is approximately 1 mSv, but in extreme cases the extra dose can be many mSv per year.
Exposure to UV radiation and electromagnetic fields (EMF) is not expressed in doses in the same way as for ionising radiation. While the risks associated with exposure to EMF are considered to be low, the number of deaths caused by malignant melanoma, which is largely caused by UV radiation, is similar to the number of deaths caused by radon (approximately 450 per year).
Trends in the radiation environment
The ongoing radiation protection work means that the dose from many important sources can be expected to decrease rather than increase. This applies for example to radon in indoor air and the dose from naturally occurring nuclides in building materials and drinking water. Doses of radioactive substances in the environment from nuclear weapons testing and the Chernobyl accident are also falling.
There are however a number of areas where the trend is more uncertain. The total dose from medical diagnostics has increased by 25% since 1995 and, if the use of dose-requiring computer tomography investigations continues to increase, this dose contribution could increase further.
UV exposure is a cause for concern. In some areas of Sweden, UV radiation is increasing as a result of reduced cloud cover, but of even more importance are behavioural changes of the population. For example, much of the UV exposure occurs in connection with foreign travel, which means that changes in travel habits can have a major impact on UV exposure.
Electromagnetic fields are used in many applications in society today. Exposure to radio-frequent fields can for certain frequencies increase with increased use of various types of wireless communication, but exposure is currently well below the current reference values
Improved knowledge of natural radionuclides in groundwater
Mapping of naturally occurring radioactive substances in the ground, drinking water and indoor air shows that the concentrations are relatively high in Sweden compared with other countries. Radioactive substances in drinking water can represent an important source of radiation doses for the population. These substances originate from the disintegration of uranium and thorium, which occur naturally in the bedrock. Concentrations in the ground vary considerably across the country. For example, granite areas with relatively high uranium and thorium concentrations exist north of Lysekil, north of Falun and north of Hornavan in the interior of Norrbotten. Studies show however that there are examples of very high concentrations of radionuclides which form part of
uranium’s disintegration chains in groundwater even where the bedrock has low or normal concentrations of uranium. Concentrations of naturally occurring radionuclides in drinking water from wells drilled into bedrock in Sweden are not at present sufficiently well known in order to make a more accurate assessment of the extent of the problem (Figure S2).
Falling concentrations of caesium-137
The radioactive substance caesium-137 is spread in the environment both as a result of atmospheric nuclear weapons testing, which was primarily carried out during the 1950s and 1960s, and as a result of the Chernobyl accident in 1986. An important aspect of the environmental monitoring programme has therefore been to monitor the substance in the Swedish environment. Three types of sample have been continually monitored: airborne particles, dairy milk and people. Figure S3 shows how concentrations of caesium-137 on particles in the air in Stockholm vary with the total explosive force of atmospheric tests through to 1980, when atmospheric tests ceased entirely and concentrations began to fall more sharply. After the Chernobyl accident in 1986, concentrations were for a short period of time higher than during the 1960s, but they have since gradually fallen again.
Radium SGU - SSI -226 (Bq/ L) 1988 - 2004 (n=752) 2 to 6,85 (4) 1 to 2 (5) 0,5 to 1 (10) 0,2 to 0,5 (38) 0 to 0,2 (693)
Figure S2. The concentration of 226Ra in samples from 752 private wells (Kulich et al, 1988; Åkerblom et al, 2005). 1950 1960 1970 1980 1990 2000 2010 air milk humans nuclear tests
Figure S3. Concentration of 137Cs in dairy milk (national average), particle-bound in the air (Stockholm), in the population (control group Stockholm) and total annual explosive force (Mt) of atmospheric nuclear weapons tests. Note that the scale for air concentrations is logarithmic.
Table S1. Example of X-ray investigations. Effective patient doses (mSv) per investigation and
annual number of investigations carried out on adult patients.
Typical dose No. of investigationsa
Dental X-ray intraoral per image 0.01 13 000 000
Conventional lung investigation 0.08 1 000 000
Mammography 0.1 750 000
Conventional lower back investigation 1.5 140 000
Computer tomography brain 2.2 180 000
Computer tomography, thorax/abdomen 6.5/10 160 000
aThe figure for the number of investigations dates from 1994. The current number is expected to be approximately the same, except for computer tomography, which has increased by a factor of 2-2.5 relative to the figures shown.
The same figure also shows how concentrations in milk and people changed during the period during which nuclear tests were carried out and after the Chernobyl accident. Concentrations in milk fell relatively rapidly as a result of active measures within the agricultural sector such as ploughing, the spreading of fertiliser, choice of feeds, etc. In people, the peak is slightly delayed, as it takes a certain period of time before the fall-out of caesium-137 is taken up by plants and animals and finally ends up in our food. The decline is slower in people than in milk. One explanation for this is that the reduction in caesium-137 in food from natural ecosystems, such as game, freshwater fish and fungi, is considerably slower than in milk.
Radiation from medical diagnostics on the increase
X-ray investigations and medical investigations using computer tomography expose patients to radiation doses. This also applies to isotope investigations where a radioactive medicine seeks out the part of the body that is to be investigated, such as the skeleton, brain, heart or kidneys. Medical investigations represent the largest average radiation source for the population and the dose contribution has also increased by 25% since 1995. This is partly the result of a considerable increase in the number of investigations using computer tomography. The radiation dose from other investigations has decreased over the same period. An individual X-ray image taken by a dentist today corresponds to approximately 0.01 mSv (Table S1).
Individuals who do undergo any form of investigation will of course receive no dose at all, while the dose for an individual comprehensive investigation could be 10 mSv or more. Over an extended period of time, most people will undergo one or more investigations, so that the life dose will to some extent vary less between individuals. The statistics that are available are however not linked to individuals, so it is difficult to estimate how these investigations are distributed within the population, but approximately 1.5 million people are estimated to have received an effective dose exceeding 1 mSv during 2004. SSI will request more information from dentists and hospitals in order to obtain a more comprehensive and up to date picture of the radiation dose from medical investigations.
UV radiation
As regards the effects of radiation, the frequency of various forms of skin cancer caused by UV radiation from the sun and solariums is increasing. Malignant melanoma now
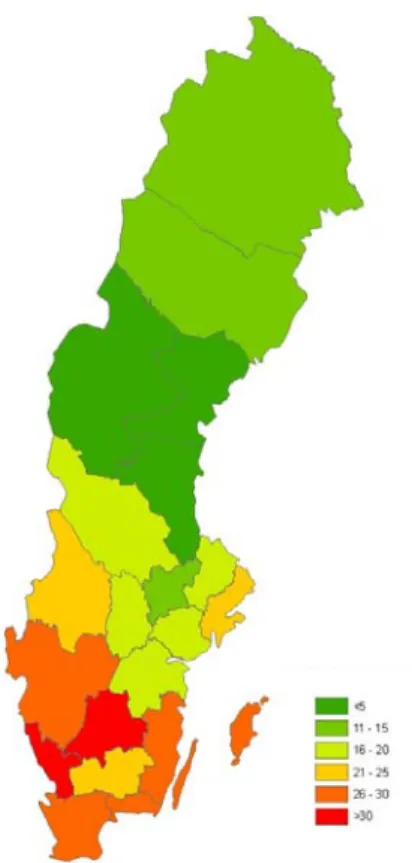
causes more than 400 deaths in Sweden every year. In Norrköping, where UV insolation has been measured since the early 1980s, UV insolation has also increased over the past 20 years (approximately 10%), primarily as a result of reduced cloud cover. It is not yet known with any certainty whether insolation has increased correspondingly across the entire country. There is geographic variation across Sweden as regards UV insolation, with insolation generally being lower in the north and higher in the south. Exposure presumably follows the same geographic patterns, a view which is supported by differences in the number of skin cancer cases between counties (Figure S4).
The total exposure of the population to UV radiation and the considerable increase in skin cancer are however mostly the result of behavioural changes. In the autumn of 2005, the first of a series of annual questionnaire surveys was carried out on behalf of SSI in order to increase our knowledge of the population’s behaviour and attitude towards the sun and sunbathing. The answers given in the survey indicate for example that exposure is higher in the 18-24 age group compared with older groups and that exposure abroad accounts for a quarter of the total exposure.
Electromagnetic fields
Relatively few measurements have been taken in Sweden with the aim of mapping electromagnetic fields in the environment. Measurements of electromagnetic fields are often carried out as a control to ensure that particular equipment, cables, transmitters, etc. do not give rise to strong fields in their immediate vicinity. Magnetic fields are stronger directly beneath power lines and in houses nearby. Measurements also show that magnetic flux density can in some cases, e.g. particularly close to induction cookers or burglary alarm detection fields, be of the same order of magnitude as the reference values. These products are however CE-marked, which means that the manufacturer has carried out more precise calculations to determine parameters such as energy absorption or induced flux density in the body and guarantees that the fundamental restrictions have not been exceeded. Radio frequency fields in public spaces have been measured in a number of locations, e.g. in the municipalities of Ekerö and Solna. The fields measured were in most cases dominated by fields from mobile telephone masts and in these locations the exposure was less than one thousandth of the reference value.
Figure S4. Number of skin cancer
cases, not malignant melanoma, per 100,000 inhabitants for women. County average 2003.
Injuries from non-ionising radiation include eye injuries from lasers and UV radiation and increased risk of skin cancer from UV radiation. There is evidence to indicate an increased risk of cancer, particularly child leukaemia, caused by long-term exposure to low frequency fields. There is no strong evidence to suggest that the exposure of the population to high frequency fields (TV transmitters, mobile telephones, etc) causes health risks, but the widespread use of mobile telephones makes it appropriate to apply the precautionary principle, i.e. avoid unnecessary exposure.
Non-ionising radiation such as UV radiation and electromagnetic fields has no corresponding dose terminology. Exposure can be indicated as the amount of energy that is absorbed per second and per kg of body tissue (e.g. the SAR value for mobile telephones) or as an exposure per m2 of skin, also inappropriately called “UV dose”. Injuries caused by ionising radiation are the result of the radiation breaking atoms and molecules apart. This means that radiation can damage cells and DNA molecules in different ways. Cells have a number of repair systems which can repair most types of damage, but radiation still gives an elevated risk of cancer later in life. High radiation doses, which kill many of the cells in tissue, can also cause acute radiation sickness and foetal damage.
Radiation dose is a measure of how much radiation has been absorbed in body tissue for example. The effective dose is often considered, which takes into account the biological effect that different types of radiation have. The unit for effective radiation dose is the sievert (Sv). One sievert is a very high radiation dose and the unit millisievert, mSv (one thousandth of a sievert) is often used.
The life is the period of time that it takes before the activity of a given sample has fallen by half. The half-life is unique to a particular substance and is for example approximately four days for radon-222 and 4.5 billion years for uranium-238. The half-life also gives no indication of how dangerous a substance is, simply how quickly the radiation from it reduces.
The number of Bq in a sample does not on its own give an indication of how dangerous a substance is. It is also necessary to know the substance, and therefore the type of disintegration, concerned.
Fact box
The activity of a radioactive substance is measured in becquerels (Bq), where one Bq indicates one disintegration per second. Within environmental monitoring and the setting of limits, etc., the activity concentration is often specified as becquerels per kg.