SKI Report 2003:14
Research
Commercial Satellite Data as a Support to
the Additional Protocol Declarations
Stig Isaksson Göran Dahlin Camilla Jönsson May 2003
SKI-perspektiv
BakgrundSedan avslöjandena om Irak:s kärnvapenprogram i början av 1990-talet har det internationella atomenergiorganet, IAEA och dess medlemsstater arbetat intensivt med att förstärka den internationella kontrollen av efterlevnaden av ickespridningsfördraget, NPT. IAEA har givits ett förstärkt mandat att utföra denna kontroll. Ett av de nya verktygen i denna kontroll är möjligheten att använda kommersiella satellitbilder dels för att verifiera medlemsstaternas deklarerade kärntekniska verksamhet dels för att identifiera eventuella odeklarerade aktiviteter.
Den förstärkta kontrollen utgår bl.a. från det s.k. tilläggsprotokollet till safeguardavtalet med IAEA. Så snart en stat skrivit under tilläggsprotokollet skall en grunddeklaration över statens kärntekniska verksamhet skickas till IAEA som sedan granskar deklarationen och vid behov ställer frågor kring den. IAEA använder kommersiella satellitbilder för att verifiera
grunddeklarationerna.
SKI har genom sitt stödprogram för IAEA:s safeguard bidragit till att utveckla IAEA:s användning av kommersiella satellitbilder.
SKI:s syfte
Detta projekt har syftat till att undersöka om och hur SKI kan använda högupplösta kommersiella satellitbilder för att ta fram den svenska grunddeklarationen till IAEA när tilläggsprotokollet träder i kraft för EU:s medlemsstater. Vidare har projektet syftat till att utvärdera hur kommersiella satellitbilder kan användas för att upptäcka förändringar vid en anläggningsplats under en längre tid s.k. change detection.
Resultat
Studien visar att kommersiella satellitbilder är ett bra verktyg för att verifiera den information som de kärntekniska anläggningarna lämnar till SKI som underlag för den nationella
grunddeklarationen. Detta gäller i första hand kartor och liknande dokumentation som visar vilka byggnader som finns inom respektive anläggningsplats. Vidare har studien visat att geografiska informationssystem, GIS där satellitbilden kopplas till databaser med annan relevant information om anläggningsplatsen är ett bra sätt att hantera information som rör anläggningsplatserna.
Studien visare vidare att satellitbilder är ett effektivt sätt att identifiera förändringar som sker över en längre tid t.ex. i samband med uppförande av nya byggnader, konstruktion av tunnlar eller anläggningar under jord.
SKI Report 2003:14
Research
Commercial Satellite Data as a Support to
the Additional Protocol Declarations
Stig Isaksson¹
Göran Dahlin¹
Camilla Jönsson²
¹Swedish Nuclear Power Inspectorate, SKI
106 58 Stockholm, Sweden
²Metria Miljöanalys
P.O. Box 24154
104 51 Stockholm, Sweden
May 2003
This report concerns a study which has been conducted for the Swedish Nuclear Power Inspectorate (SKI). The conclusions and viewpoints presented in the report are
2
Contents
CONTENTS...2
INTRODUCTION ...3
OBJECTIVES...3
PROJECT ORGANISATION AND FINANCING...3
PROJECT DESCRIPTION...3
STUDY AREAS...3
DATA AND SOFTWARE...4
Satellite Data ...5
Field visit ...6
METHODS...6
Processing of satellite data...6
Data model and data collection ...7
Change Detection ...8
Lower resolution satellite data ...9
DELIVERABLES...11
TIME SCHEDULE ...13
DEPARTURES FROM PLAN...13
USER VALIDATION ...14
DISSEMINATION AND EXPLOITATION...14
USE OF FINANCIAL RESOURCES...15
CONCLUSIONS AND RECOMMENDATIONS ...15
Introduction
This document is the final report to the Swedish National Space Board, SNSB for the project ”Commercial satellite data as a support to the Additional Protocol declarations” financed within the SNSB’s ”User Program”.
Objectives
The overall objective of the project is to show how commercial satellite data can be used for safeguard purposes both at the Swedish Nuclear Power Inspectorate, SKI and the International Atomic Energy Agency, IAEA. Furthermore the experiences from this project can support IAEA in its process to develop methods and routines to make the best use of the Member State provided information in combination with satellite images. Finally it will give IAEA a relevant case study of the usefulness of satellite data for change detection purposes.
This project shall provide SKI with digitised maps and commercial satellite data to verify the descriptions provided by two Swedish nuclear operators. Furthermore those digital data may be included in the declaration given to IAEA. The long-term aim is to enhance the quality of the Swedish declaration as well as to give the IAEA support as regards methods to use commercial satellite data.
Project organisation and financing
The project is carried out in co-operation between SKI and Metria Miljöanalys.
The project has been financed through the Swedish National Space Board “User Program” and by SKI in the form of costs for participating personnel. Please turn to section 6 of this report for a more detailed account of costs.
Project Description
Study areas
The project has provided SKI with digitised vector maps and optical satellite data over two selected nuclear sites. Furthermore these data will help to verify the descriptions that thoose two Swedish nuclear operators will give to SKI.
The selected sites in this project are:
♦ Simpevarp with the three Oskarshamn nuclear power reactors, CLAB (the Central Interim
Storage Facility for Spent Nuclear Fuel) and Äspö laboratory. The area has been chosen since it contains nuclear power reactors, as well as storage facilities for used nuclear fuels and an underground research laboratory. For the Simpevarp site historical data has also been included to illustrate changes that have occurred since the first reactor O1 came in to use.
Eventuell fortsatt verksamhet inom området
För närvarande har SKI inga konkreta planer på ytterligare forskningsprojekt inom området. SKI har inte fattat beslut om att söka medel för ytterligare forskningsprojekt från
Rymdstyrelsens användarprogram. Alternativt finns möjligheten att initiera forskning inom ramen för SKI:s egen forskningsverksamhet i den mån resultatet kan bidra till att utveckla SKI:s tillsynsverksamhet.
Effekt på SKI:s verksamhet
SKI överväger att rutinmässigt börja använda kommersiella satellitbilder och GIS för samtliga större kärntekniska anläggningar. Detta skulle innebära att satellitbilder över ytterligare tre kärnkraftanläggningar och några andra kärntekniska anläggningar behöver införskaffas och knytas till övrig relevant information om dessa anläggningar.
Projektinformation
SKI:s projekthandläggare: Stig Isaksson
Projektnummer
5.31-001036
Andra projekt inom området
• IAEA Safeguards: Cost/Benefit Analysis of Commercial Satellite Imagery,
SKI-rapport 99:14
• IAEA Safeguards: Implementation Blueprint of Commercial Satellite Imagery,
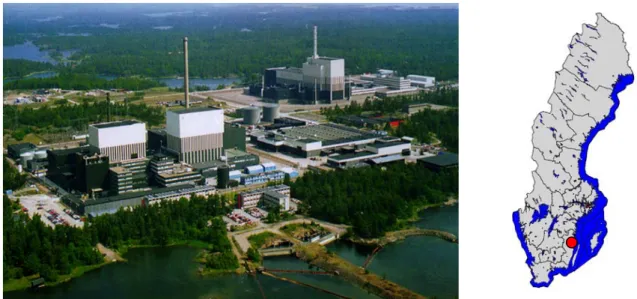
Figure 1: Oskarshamn nuclear power station to the left and an overview map over Sweden to the right with the study area marked with red.
♦ Studsvik with the materials testing reactor ”R2”, a number of other types of nuclear
technical activities and other non-nuclear related activities. The site has been chosen for its complexity.
Figure 2: Studsvik to the left and an overview map over Sweden to the right with the study area marked in red.
Data and software
Data used for the study are: Simpevarp:• Topographical maps (1:12 500)
5
• QuickBird from 2002-05-21 (system corrected, 0.7-meter pan sharpened)
• Landsat TM data
• Site Declaration
• Site map
Studsvik:
• Topographical maps (1:12 500)
• Aerial photographs (ortho photos) from 1998
• IKONOS from 2001-02-20 (system corrected, 1-meter pan sharpened)
• Site Declaration
• Site map
The software used for the project in general is ArcView GIS 3.2. The IKONOS image was geo rectified with the software Socetset.
Satellite Data
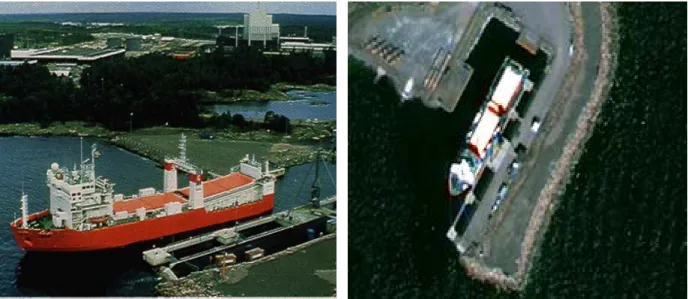
The satellite data used in the project is mainly VHR (Very High Resolution) satellite images. To gain some understanding for the degree of details that can be detected in this type of data, two examples with subsets from the QuickBird image are shown together with photos
displaying the same area in figure 3 and 4.
Figure 4: Äspö Laboratory north of Simpevarp.
Field visit
In February 2002 SKI and Metria Miljöanalys carried out a field visit at the Simpevarp site. The whole site was closely examined and the uncertainties between the images and the declaration were clarified. During the field visit one building was detected in the image that was not marked on the site declaration.
Methods
Processing of satellite data
The data was geo rectified to RT90 2,5 gon using control point from ortho photos over the same site. The image was then contrast stretched for the best possible visual interpretation.
7
Data model and data collection
As a starting point, all available and delivered maps over the two sites were compiled and digitised in the software ArcView. The objects that were extracted with visual interpretation and digitised on-screen from satellite images in this work are:
• buildings • roads • power lines • fences • water lines • tunnel entrances
• inlet and outlet for cooling water
• culverts
• dock areas/ bridges
• coastlines
• pylons
• site boundaries
• helipads
• geographical names
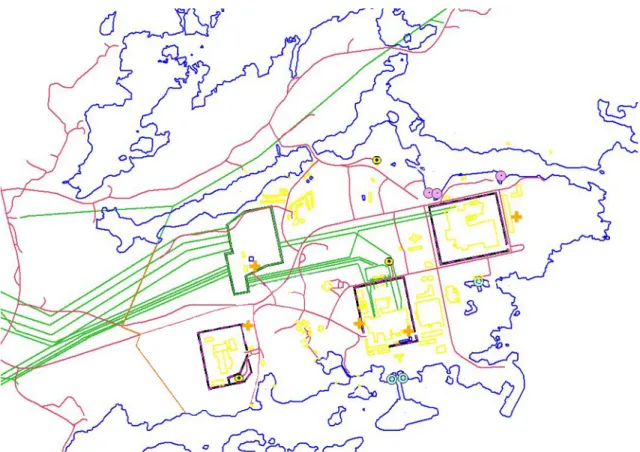
Not all features were present in both study areas. Buildings were given a unique number for identification and attribute data were added to each building that are represented in the declarations from respective site. In figure 5 all features over Simpevarp is shown.
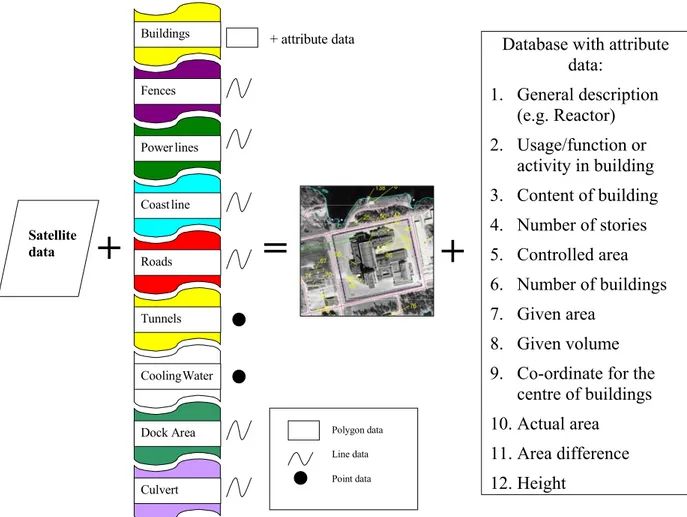
SKI and Metria Miljöanalys designed a data model to make sure that all relevant objects are extracted and presented in the desired way. The design was made to fit the needs and demands of SKI. Figure 6 below shows the data collection and examples of attribute data that can be included in the database.
Polygon data Line data Point data
+
Buildings Fences Power lines Coastline Roads Tunnels CoolingWater Dock Area Culvert=
+
+ attribute data Satellite dataDatabase with attribute data: 1. General description (e.g. Reactor) 2. Usage/function or activity in building 3. Content of building 4. Number of stories 5. Controlled area 6. Number of buildings 7. Given area 8. Given volume 9. Co-ordinate for the
centre of buildings 10. Actual area
11. Area difference 12. Height
Figure 6: Workflow for generating the final product.
Change Detection
Satellite data gives an opportunity to discover and confirm potentially undeclared activities even in areas not possible to visit. It also gives an opportunity to follow sites under
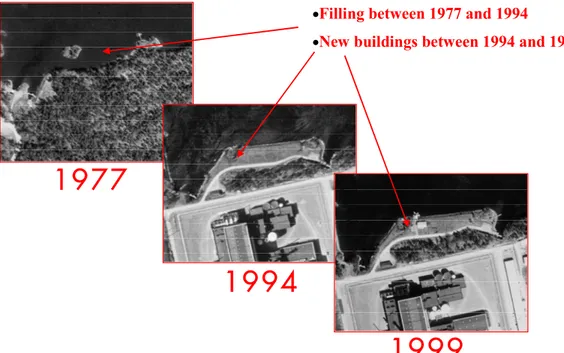
construction, and in detail to map the development as new buildings and constructions occur. Figure 7 below gives an example from the Simpevarp site illustrating the changes between the years 1977 to 1999.
9
1977
1994
•Filling between 1977 and 1994
•New buildings between 1994 and 1999
1999
Figure 7: A detailed study over a subset of the Simpevarp site from 1977, 1994 and 1999.
Many studies have been carried out using VHR-data for automatic change detection (studies have also been carried out at the satellite laboratory at IAEA). Still the most effective method is visual interpretation even if new and more efficient methods certainly will show up in the near future.
Figure 8: Visual interpretation is today the most appropriate way to handle this type of applications. A good knowledge about the nuclear fuel cycle is of necessity for qualified judgement of changes between images. The image shows an entrance to a tunnel at Simpevarp.
Lower resolution satellite data
Besides the actual work with digitising and extracting information from the satellite images also some work was done by investigating the potential in lower resolution satellite data as a complement to VHR-data.
Figure 12: Example of a detailed study over Simpevarp.
Table 1: Data over Simpevarp delivered to SKI.
Image data Vector data
QuickBird 2002 Buildings Polygons
Ortophoto 1999 Power lines Lines
Ortophoto 1994 Roads Lines
Ortophoto 1977 Fences Lines
Site boundaries Lines
Cooling water; inlet, outlet Lines
Dock area Lines
Culvert Lines
Tunnel Points
10
Figure 9: The two uppermost images show two Landsat TM images (30 meters resolution) with approximately 10 years between registrations. Two areas appear to have gone through
dramatic changes between the two occasions (the red ellipse and the yellow arrow). In the two images at the bottom we can in the VHR-data interpret the changes. At the yellow arrow it is Äspö laboratory that has been built and at the red ellipse it is a storage-yard from the construction of the Äspö tunnel.
Landsat data also range over the thermal infrared area and can therefore be interesting for detecting if a reactor is active or not, one example is shown in figure 10.
Figure 10: The pixel elements in the water with the highest digital grey levels have been extracted and highlighted in red. This area happens to coincident with the outlets for the cooling water from the reactors at
Simpevarp.
Deliverables
The concrete results from the project are compiled maps in digital and analogue form, as well as databases describing the different elements extracted from the images. Appendix 1-3 shows examples on how this material can be presented as analogue maps.
Since we did not have access to all information mentioned earlier the database at present contains a general description about the main purposes of the different buildings as well as height, length and width. The database is supposed to be continually updated and more information can be added as follows.
One important outcome from this project is that SKI obtained the GIS software ArcView and now has the possibility to continue to work with and update the database. At the delivery of the results a short introduction course in the software and in how to use the data was given to concerned personnel at SKI.
Figure 11: A manual was compiled for the concerned personnel at SKI. The purpose is that the delivered material from the beginning shall be updated regularly at SKI.
12
Figure 12: Example of a detailed study over Simpevarp.
Table 1: Data over Simpevarp delivered to SKI.
Image data Vector data
QuickBird 2002 Buildings Polygons
Ortofoto 1999 Power lines Lines
Ortofoto 1994 Roads Lines
Ortofoto 1977 Fences Lines
Site boundaries Lines
Cooling water; inlet, outlet Lines
Dock area Lines
Culvert Lines
Tunnel Points
Table 2: Data over Studsvik delivered to SKI.
Image data Vector data
IKONOS 2001 Buildings Polygons
Ortofoto 1998 Power lines Lines
Roads Lines
Coastline Lines
Site boundaries Lines
Bridges Lines
Helipad Polygons
Pylons Points
Geographical names Points
The project was presented at the Symposium on International Safeguards: “Verification and Nuclear Material Security” held at IAEA in Vienna, 29 October - 2 November 2001. For this occasion a project description and power point presentation was compiled about the project. Furthermore the project was presented at the meeting of the “Nordic Society for Non-Proliferation Issues” in Bergen, Norway 16-17 October 2002.
Time Schedule
The original time schedule for the project was developed to fit the expected ratification of the Additional Protocol by all EU-member States during 2001. However the political process in some states was much slower than expected and all EU-member States have not yet ratified the Protocol. Nevertheless the project started as planned in January 2001 and was finalised, with a one-year delay, in December 2002.
Departures from Plan
The project has been delayed one year mainly because of two reasons, the difficulties in receiving VHR satellite data and the delay in receiving the site declarations from Simpevarp and Studsvik.
An order for satellite data was submitted from April 2001 and forward over the two sites. Over neither of the study sites satellite data from the preferred time period were received. Over Studsvik an image from the end of February year 2001 was retrieved from the archive, but over Simpevarp no data neither before nor after the preferred time span were received during 2001. The project was therefore prolonged during 2002 and in May this year a QuickBird scene was registered over Simpevarp.
The first delivery was in September 2002 and at that same time a short introduction course to ArcView was held at SKI. The site declaration from Studvik was not received until in the end of November 2002. The final delivery of both study areas was therefor not ready until
14
The departures from plan has not negatively affected the coming use of the deliverables since the Additional Protocol will come into force at earliest at the end of 2003.
User Validation
SKI has no previous experience in the use of satellite images in its role as regulatory and supervisory authority. Furthermore SKI has had a relatively short time to use the result of the project and therefor the experiences from practical use are limited. However we can see the potential of satellite images as a part of a Geographical Information System/GIS. SKI will explore the possibility to use GIS as a tool to organise information related to Swedish nuclear sites and specifically in fulfilling the requirements of the Additional Protocol.
The project has given SKI an important insight in the potential of using a GIS-based system not only for Additional Protocol purposes but also for other activities of SKI.
Dissemination and Exploitation
As mentioned in chapter Deliverables, SKI has purchased and installed ArcView and also received an introduction in order to use the delivery from the project. In order to get started and use the software more effectively SKI has received hands-on training in the use of ArcView for one person during a full week early 2003. The training took place in the premises of Metria Miljöanalys.
Furthermore the European Commission is in the process to introduce a software package to be used in the implementation of the Additional Protocol. The package, which is called CAPE, can use information from ArcView. The Commission will make the CAPE software available for use in March 2003. Furthermore it has come to SKI´s knowledge that IAEA has shown interest in the use of CAPE for national declarations under the Additional Protocol. SKI has been closely involved in the development of CAPE and has decided to use CAPE for reporting under the Additional Protocol.
In addition to the possible use of satellite imagery in the connection with the Additional
Protocol declarations, SKI will also explore other areas such as emergency preparedness where this technique might be useful. Furthermore, during the project it has become clear that both the sites involved, Studsvik and Simpevarp, are interested to further explore the possibility to use, for their own purposes, satellite imagery for various applications. A similar interest has been voiced by other authorities e.g. the police that have been informed about the project.
One important aspect that needs to be analysed carefully is the need for confidentiality. It is clear that the images are publicly available. However once you start to add information in databases about objects in the images e.g. a nuclear facility and combine it with the image in a Geographic Information System the product may become sensitive. The principle should be that the information should be treated as confidential and only be available on a need to know basis irrespective of if the information is digital or analogue. Furthermore the confidentiality aspect also needs to be taken into account in presentations of the project and when reports that are publicly available are produced.
Use of Financial Resources
Description KSEK Comment
Metria Miljöanalys 420 Technical consultants
Purchase of ArcView 16 Software
Field trip to Simpevarp 5 Travel costs
Satellite data, Simpevarp 19 Quick Bird 2002-05-21
Satellite data, Studsvik 50 Ikonos 2001-02-20
Other costs 15 Printing of report etc.
Total 525
The cost for the satellite image over Studsvik has not yet been invoiced. However SKI has been informed that the price is approximately 5400 USD.
Furthermore SKI personnel has participated in the project with 30 working days.
Conclusions and Recommendations
Using satellite images, as a complement to auxiliary data ought to give economical benefits to SKI as well as the IAEA such as more effective work, unlimited access to image information and an enhanced knowledge of the history of different sites.
So far the study has shown that:
• satellite images of 1m resolution or better give relevant additional information for the monitoring of nuclear sites, especially in areas of low access,
• there are limitations to the availability of satellite data from specific geographic locations due to e.g. weather conditions,
• satellite images from the seasons when the sun does not rise very high, late autumn,
winter and early spring, may not be as useful as images from other seasons,
• change detection using manual interpretation and ‘historical’ satellite images is an efficient method to follow nuclear site developments,
• the use of an image and vector system (i.e. ArcView) in combination with the
continuos update of a site database could be one way of handle the Additional Protocol Declarations,
• confidentiality of the collected information needs to be properly protected. The
integrated information consisting of digital images and site databases is safeguards confidential and must be treated as such.
16 Agency Info Member State Info Open Sources Imagery
Figure 13: Satellite Imagery is a complement to other sources.
The economical benefits using satellite information in safeguards can amongst others be of logistic character such as improved planning of the fieldwork (e.g. which areas are in need of further field visits), which of course means more effective work in the field. Generally speaking one of the greatest benefits will be a constantly updated and easy to access database containing adequate information about interesting sites.
The monitoring will be more effective regarding e.g. confirmation of the data delivered from the member states. Also an improved quality on the information, and more detailed information is to be expected. The recommendation is that IAEA specifies a data model to be used at the deliveries of vector data.
Satellite data Field
stu dies sou rcesOpen
K n ow ledge Av ailable
data
Figure 14: The success factor is to use satellite data as one piece in the puzzle and use it together with all other available information sources.
APPENDICES
1. Overview over Studsvik 2. Detailed map over Studsvik 3. Overview over Simpevarp
18