Kalmar ECO-TECH '05 and
The Second Baltic Symposium on Environmental Chemistry KALMAR, SWEDEN, November 28-30, 2005
HYDROGEOLOGICAL INVESTIGATIONS IN
PREPARATION OF AN
IN SITU
BIOREMEDIATION STRATEGY BASED ON A
NOVEL BACTERIAL
DESULFITOBACTERIUM
DICHLOROELIMINANS
STRAIN DCAl
ABSTRACT
the reactive solutes and the injected bacterial strain.
These investigations were conducted during the evaluation of an in situ bioremediation strategy intended for the cleanup of a test site. The site lies within a historically 1,2-dichloroethane (l ,2-DCA) contaminated sandy phreatic aquifer in Tessenderlo (Belgium). The halogenated compound has a putative carcinogenic effect and a high recalcitrance towards reductive dechlorination. The isolation of the novel anaerobic Desulfitobacterium dichloroeliminans strain DCAI from the soil matrix of the Tessenderlo site at LabMET (Ghent University, Belgium) offered perspectives for the execution of a bioaugmentation strategy at this site, since this strain selectively degrades 1,2-DCA to ethene under anaerobic conditions without the production of toxic vinyl chloride.
First, a step-drawdown pumping test followed by a forced gradient multiple-well tracer test was conducted to obtain values for the hydrogeological parameters such as hydraulic conductivity, longitudinal and transverse dispersivity and effective porosity. The solute transport model was used as a predictive field-scale modelling tool in aid of designing the preliminary field tests as well as the bacterial injection. The aim of the latter was the assessment of the transport of the augmented strain DCAI. Prior modelling of these experiments provides an insight in the possible design strategies and hence, it can be concluded that profound preliminary field investigation aided by a solute transport model such as MOCDENS3D, results in a more time- and cost-effective execution of large scale cleanup processes of contaminated sites.
Katherine A. Smith
Alexander Vandenbohed
Ann Maes
Willy Verstraet
Luc Lebbe
Ghent University, Belgium
Understanding the wide variety of aquifer physical, chemical and microbiological processes is necessary for the effective implementation of in situ bioaugmentation strategies. Therefore, a numerical density dependent 3D solute transport model MOCDENS3D was developed in combination with field experiments to characterise the subsurface control parameters. This also allowed for the study of the effect of aquifer heterogeneity upon the fate and transport of
The Second Baltic Symposium on Environmental Chemistry
KALMAR, SWEDEN, November 28-30, 2005
KEYWORDS
Bioaugmentation; 1,2-dichloroethane; Pumping test; Tracer test; Solute transport modelling
1 INTRODUCTION
At a chemical plant in Tessenderlo (Belgium) the top region of the underlying sandy phreatic aquifer is contaminated with the probably carcinogenic compound dichloroethane ( 1,2-DCA), The product is used as an intermediate in the polyvinyl chloride production, Due to its high water solubility (8 g/L at 20°C), low log KOC-value ( 1,28-1,62) and high mobility in
soils, considerable amounts may leach to underlying reductive aquifers, Also, because of the high resistance towards reduction reactions, this contamination poses a considerable threat to the environment and the population [2], Although aerobic treatment schemes like pump-and treat or aerobic degradation have been applied in the past, this does not always prove to be the most cost effective solution,
On the site a novel anaerobic Desuljitobacterium dichloroeliminans strain DCA I was identified by LabMET [3], This strain selectively degrades 1,2-DCA to ethene under maximum 1,2-DCA dechlorination rate exceeded 350 nmol chloride released per min per mg anaerobic conditions without the production of toxic vinyl chloride, On laboratory scale the total bacterial protein during the exponential growth stage [4]. Therefore, it was decided to design a remediation strategy for this site based on in situ bioaugmentation, This implies an addition of micro-organisms to the subsurface to ameliorate the biodegradable performances noted there. Besides obtaining an optimal spread of the micro-organisms in the subsurface,
parameter identification field tests are
one of the major difficulties in implementing in situ bioremediation is the efficient delivery of
characterisation step-drawdown pumping test nutrients and substrates to the inoculated bacteria [12]. Hence, it is vital to gather fundamental knowledge of the contaminated site before the actual bioaugmentation project starts.
The first step in this buildup of knowledge consists of the of the lithostratigraphic and hydrogeological setting of the test site, To this purpose, two consecutive
executed, namely a
followed by a forced gradient multiple-well tracer test [14]. They provide an estimation of the hydraulic and solute transport properties of the aquifer. These determine the advective and dispersive transport processes in the subsurface and hence give an insight in the physical and chemical processes which control the spreading of any substance throughout the aquifer. The next step is to incorporate the acquired knowledge of the site into a solute transport model that is modified to simulate the transport of the bacterial strain DCA I. It is based on a 3D, density dependent, solute transport model using the code MOCDENS3D [I I]. In this model the mass balance for mobile and immobile phase microbes contains terms for advection, dispersion and sorption. The model serves as a tool for field scale design of an in
situ pilot test in which the mobility of strain DCA I is investigated, Once this mobility under
field conditions is ascertained, the model developed to describe the linked physical and chemical processes, will be enlarged to contain specific bacterial processes and hence contribute to the design of the further bioremediation scheme,
2 SETTING OF THE STUDY AREA
The historical 1,2-DCA contamination on the test site in Tessenderlo (Belgium) is situated in the upper part of an approximately 110 m thick, phreatic aquifer. The aquifer consists of
Kalmar ECO-TECH '05 and
The Second Baltic Symposium on Environmental Chemistry KALMAR. SWEDEN, November 28-30, 2005
relatively homogenous medium grained sands rich in glauconite, They belong to the Formation of Diest (Upper Miocene), which forms an erosive gully in the underlying clay of the semi-pervious Formation of Boom. The water table is situated some 7 meters below the surface. Due to the position of the site on the water divide, the natural occurring horizontal groundwater velocities are limited to about I. 7 m per year.
3 HYDROGEOLOGICAL SITE INVESTIGATIONS
In order to characterise the groundwater reservoir at the test site two preliminary parameter identification field tests are carried out, namely a step-drawdown pumping test followed by a forced gradient tracer test. Results and execution of these tests are described below.
3.1 Step-drawdown pumping test
During the step-drawdown pumping test. groundwater is extracted with a discharge rate that is increased in consecutive steps; in this case four steps, each lasting 1.5 hours, during which
water is pumped from well L V50 at a discharge rate of respectively 46.8 m'/d, 96.0 m3/d,
144.0 m'/d and 198.0 m'/d (well layout see Figure 1). Initially, all wells show the same
potentiometric elevation coinciding with the water table. During the test the hydraulic heads are recorded in all wells.
The interpretation of the test is performed with the aid of an inverse numerical model from the HYPARIDEN package [7]. This is a set of computer codes developed as a generalised interpretation method for single and multiple pumping tests. In the model the groundwater
reservoir is subdivided into I 7 layers (see Figure 1). Discretisation of the groundwater
reservoir is made in function of lithology with a denser subdivision of the semi-permeable layers to simulate accurately the development of the predominant vertical flow, and in function of the screen emplacements. Ideally during a pumping test, short screens are installed in order to obtain hydraulic parameter information on one specific layer [14]. However, on this site the screens are relatively long and hence, the observed drawdowns depend on the different responses of the intersected layers. This is reflected by the parameters which could be optimised. On the other hand, long screens are preferred during tracer tests. A satisfactory end result could be obtained by maximally incorporating the results of the tracer test in the simultaneous interpretation of both field tests.
The clays of the Formation of Boom function as the impervious lower limit in the numerical model. The lower part of the Formation of Diest consists of fine sands that show a gradual coarsening upwards. Therefore, ever smaller conductivities are attributed to layers I to 5. Layers 7 to I 6 form the upper part of the formation and are relatively heterogeneous.
Three different parameter groups are considered during the interpretation of the step drawdown pumping test. The first group comprises the horizontal hydraulic conductivities of layers I to 17 together with their hydraulic resistances. Anisotropy, or the ratio of the horizontal to the vertical conductivity, is set at 2. Conductivity ratios between different layers are estimated since no further information can be obtained from the field observations. The second group contains the specific elastic storage of layers I to 17. The C-value of the well
loss, C(t, in which Q is the extraction rate, forms the parameter in the third group. The
storage coefficient near the water table is insensitive to the observations and as a result is
- �v�L - Lv51_ Ly_S? _ Surface 0 - - ����- _
14
15
35_5,
The Second Baltic Symposium on Environmental Chemistry KALMAR, SWEDEN, November 28-30. 2005
Hydraulic conductivity of the sediments is the most sensitive parameter, No important correlation exists between the identified parameters. The largest condition index is 26 9, indicating a moderate dependency between the parameters [1 ]. Sensitivity analyses confirm that the drawdown observations are sensitive to horizontal and vertical conductivities and hydraulic resistances of the individual layers. However, due to the long screens and their position they can not be determined individually. The concentration observations. made during the forced gradient tracer test, will provide additional insight.
� �.)6m �1_SIT_1
____,,
Layers 1n Waterttable numencal model
17
Al
- _J6_ 15 10 13 12 11 10I
Bl
I
I
20.5---- 7 -=�-a---=---: 20 21.5 ! 23.5' 25I
Well scree n 27.51 3-_ 51.5 ', 75,5 107.5Figure l, Well layout at test site (left) and discretisation of groundwater reservoir (right),
3.2 Forced gradient multiple-well tracer test
During the consecutive forced gradient multiple-well tracer test with a conservative tracer (NaCl), 2.1 m' of water with a TDS of I 0.8 g/L is injected in L V50 at a rate of 48 m'/d. The background concentration of the aquifer measures 0.86 g/L. After injection, extraction stans from well L V52 at a discharge rate of 2.0 m'/d. In this way, the evolution of the spreading of the tracer can be monitored in well L V22 and L V 51 making use of the high electrical conductivity of the salt water plume (see Figure]). This conductivity is measured twice a day during a period of 12 days with the aid of the focused electromagnetic induction method EM39. The EM39-probe registers the electrical conductivity of the surrounding sediments within a torus with an inner and an outer radius of respectively 20 and 100 cm from the well axis and a vertical sensitivity of 30 cm above and below the measuring point [ 1 OJ, The relationship between the total salt content and the recorded electrical conductivity is described in [13]. In this manner the salt content can be deduced at different levels in time and space, The forced gradient tracer test is simulated using the program package TRACER3D [14], TRACER3D simulates the flow and solute transport in the vicinity of a pumping or injection well(s) whilst taking advective and dispersive transport into account. The discritisation of the
Kalmar ECO-TECH '05 and
The Second Baltic Symposium on Environmental Chemist!) KALMAR, SWEDEN, November 28-30, 2005
groundwater reservoir is refined from the one used in HYP ARID EN to enhance computational accuracy of the solute transport, Hydraulic parameters derived from the pumping test serve as initial values, They are altered as the drawdown and concentration data are interpreted iteratively, In this way, drawdowns and concentration data are interpreted simultaneously and both the hydraulic and solute transport parameters are derived more accurately [ 14], Figure 3 illustrates the comparison between the observed and calculated data in well L V228, DRAi,/0□1O1(11) ,oO t----+----+---; 10.? T lt1E (MIN) LAYER I 5 LA.YER 10
Figure 2, Comparison between observed (crosses) and calculated (full line) drawdowns for layers 10 and 15,
The Second Baltic Symposium on Environmental Chemistry KALMAR, SWEDEN, November 28-30, 2005
eoooil '-' I
,,!
' -<Pl .. .,.ii , ucl . ,,,IFigure 3, Comparison between observed (points) and calculated (full line) data in LV22B, Times are set in box in hours after start of pumping,
3.3 Conclusion of the preliminary field tests
A good agreement between hydraulic parameters, derived from the step-drawdown test and the tracer test, is obtained. At the level where the tracer test is executed, two layers with a different conductivity can be distinguished. The upper part ( depth 9 to 16.2 m) has a conductivity of 13,4 mid, the lower (depth 16,3 to 19.5 m) has a conductivity oft7,4 mid. The effective porosity equals 0.37. To simulate the observations made in L V22B, only advective transport is considered. Dispersion is too small to be of relevance. However, a longitudinal dispersivity of 0.08 m is needed to model the observations made in L V5 l, Transverse dispersivity is fixed at a value IO times smaller, Hence, the dispersivity increases in function of travel distance from the tracer,
4 MICROBIAL TRANSPORT MODEL
With the acquired understanding of the hydraulic and solute transport parameters from the field tests, a solute transport model is developed, based on the computer code MOCDENS3D [ I I ], This model aims to design a transport test in order to investigate the microbial mobility in the subsurface, Since this is only a preliminary study to the actual bioremediation scheme,
Kalmar ECO-TECH '05 and
The Second Baltic Symposium on Environmental Chemistry KALMAR, SWEDEN, November 28-30, 2005
the microbial transport will be simplified as a transport of inert colloids in porous media. Afterwards, the model will be extended to encompass the microbial processes as welL Transport equations for advection, dispersion (both mechanical dispersion and diffusion), external sources and sorption are incorporated so as to describe the physico-chemical transport processes in the aquifer, Eq. ( 1) and (2) describe the 3D groundwater flow in MOCDENS3D:
( 1) (2) where q,, q1, and q= are the Darcian flow velocities in the principal directions x, y and z [L r1];
S, is the specific elastic storage of the porous material [L·1];
are the dynamic viscosities of the
h1is the freshwater head [L]; Rw
is an external source (recharge and pumping) [T1] ; t is time [T]; K
fx, Kfy and K1= are freshwater
horizontal hydraulic conductivities [LT1] ; N and µ,
freshwater and the water at the ith point respectively [ML.1T1]; p
1tand p, are the densities of the freshwater and the water at the ith point respectively [ML-3],
In this case the buoyancy factor [(p, -p1)! Pt] approximates zero, As a mixture the presence of 1,2-DCA in the fresh water aquifer hardly influences the density of the groundwater, nor does the addition of nutrients to the subsurface,
The change of solute-concentration (in this case the micro-organisms) in the groundwater :
(3) during a small period of time can be given by Equation (3) [6]
where Cm is the concentration of the solutes in the aqueous phase [ML-3],
V
is the averageinterstitial velocity vector [L T1] with
V
=q
/
n, , ne is the effective porosity [L3L-3],
D
is the second order hydrodynamic dispersion tensor [L2T1] , C ' is the concentration of the injected
water [ML.3] and R1 is the retardation factor with R1 = I t+ (ph Kd
/nJ
in which Pb is thebulkdensity [ML-3] (assumed constant here), Kd is the distribution coefficient of the solute
between the solid and the aqueous phase [L3M-1] ,
The sorption term in Eq. 3 assumes immediate and reversible sorption described by a linear sorption isotherm, At any moment in time, the mobile and immobile phases are in local equilibrium with each other or, C,m = Kd * Cm , with C;m is the concentration of the immobile
phase [ML.3]t This equilibrium assumption is valid when mass transfer velocities exceed, groundwater velocities.
During pumping however, groundwater velocities may be larger causing the rate of partitioning between mobile and immobile phases to be limited, resulting in rate-limited, or non-equilibrium, transport [5]. This is illustrated in Eq. 4, with S is the concentration of the
The Second Baltic Symposium on Environmental Chemistry KALMAR, SWEDEN, November 28-30, 2005
1
compound in the adsorbed phase [MM.t] and Tv is the first-order mass transfer rate parameter
[Tl ]:
P
h
as
a,
=
T'
(c -
m_§_)
Kd (4)4.1 Transport test design
In order to develop a successful bioaugmentation strategy for the cleanup of a contaminated site, an assessment must be made of the bacterial mobility in the subsoil. Since no information on this subject is yet available for strain DCA I. estimation is made based on the geometric mean of the Kd-values found by Lindqvist and Bengtsson [8]. This results in a Kd-value of
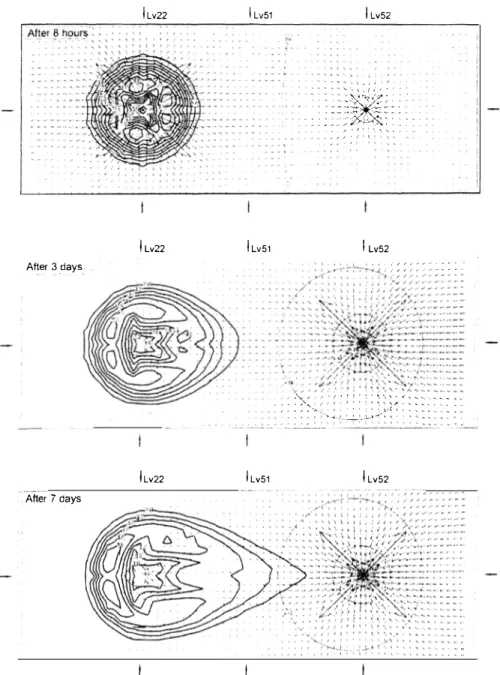
2.79 L/kg; or in other words, a RJ of 1 4. Figure 4 illustrates the predicted evolution of the bacterial transport in the subsoil. For this simulation, the same well configuration is used as during the preliminary field tests ( see Figure 1). However, during this test L V 50 and L V 5 I act as monitoring wells, L V22 serves as the injection well and L V52 as the extraction well. The course of the test is given in Table I.
The transport model comprises a 3D grid of 70 rows and 70 columns of each 0.1 m wide, and is divided into I 9 layers of each 1.0 m in thickness. The boundary conditions of the upper and lower limit are taken to be impervious whereas the lateral limits are considered constant head boundaries. Initially, all wells show the same potentiometric elevation coinciding with the water table. The initial concentration of bacteria in the subsoil is set at O %. Injection of bacteria occurs at a concentration of a J OO %. No chemical interactions in the groundwater reservoir are considered with the exception of sorption.
Kalmar ECO-TECH '05 and
The Second Baltic Symposium on Environmental Chemistry KALMAR. SWEDEN, November 28-30, 2005
1 Lv22
I
Lv51I
Lv52 ..,. , , . \ ' ' ; • - � •• -. ' · , ' • ! ,· , ,, • , ,::I}t�t?<
. . ,. • ! ' '. '. , , - . . , ,.. ,. ,, • 1 ' I '. ,I
Lv22 I Lv51I
Lv52 After 3 _days . \ I ; ' 1 / ,' ,' / / ,. ,, � ' • • • • : ,, ,, / •' ,· ,. -·�
. . .: :: >\::i:LJ}?�: :�:
?::
· -··-· --� - ---
---·--·-i Lv22 I Lv51I
Lv52 After 7 daysFigure 4. Simulated evolution of mobile bacteria at a depth of 17 to 18 m below the subsurface after 8 hours, 3 days and 7 days, Concentration contour lines (in %, bold lines) are numerically indicated in rectangular labels. The hydraulic head contour lines (every 0.25 m, fine line) are represented with circular labels, The arrows in the picture represent the
The Second Baltic Symposium on Environmental Chemistry KALMAR, SWEDEN, November 28-30, 2005
Table 1. Execution of the transport test.
Trans port test L V22 - Injection well L V52 - Extraction well Injection of groundwater: 2 m'/h
supplemented with: Extraction of
PHASE I SOL inoculum (5* 1 07
bacteria strain DCAl /mL) groundwater: Day 1 : 0-J h SL sodium lactate solution (40mM) (Fluka)
4.8L NaHCO3 -buffer ( IM) (VWR)
Extraction of Injection of groundwater: 0.2m'/h
PHASE 3 supplemented with: groundwater:
Day 1 : 8h - end 280 L sodium lactate solution (40mM) (Fluka) 5 m'lh PHASE 2
Day 1 : J -8h
2L yeast extract (50g/L) (Oxoid) 4.8L NaHCO3-buffer ( IM) (VWr) Injection of groundwater: 2 m'/h supplemented with:
28L sodium lactate solution (40mM) (Fluka) 2L yeast extract (50g/L) (Oxoid)
2.6 m'/h Extraction of groundwater: 2.6 m3/h
4.2 Results
In the course of the transport test groundwater samples
bacteria. are taken in order to follow up the evolution the concentration of mobile Molecular detection of a statistically significant amount of microbial cells by Real-Time PCR ( l 6S rRNA-gene) downstream of the injection well L V22 confirm the mobility of the strain DCA 1 in the subsurface. The 1 6S rRNA-gene of strain DCA J was first detected in LV5 1 and LV52 on day 3 and day 7 respectively after the start of the test. The maximum concentration of strain DCA 1 passed LV5 1 on day 5.
This result suggests a relatively small retardation factor for strain DCA I in the subsoil when
Haggerty and Golerick [5) show that rate-limited mass transfer is important in the vicinity of injection and pumping wells. A larger Tv-value corresponds to a smaller area of influence.
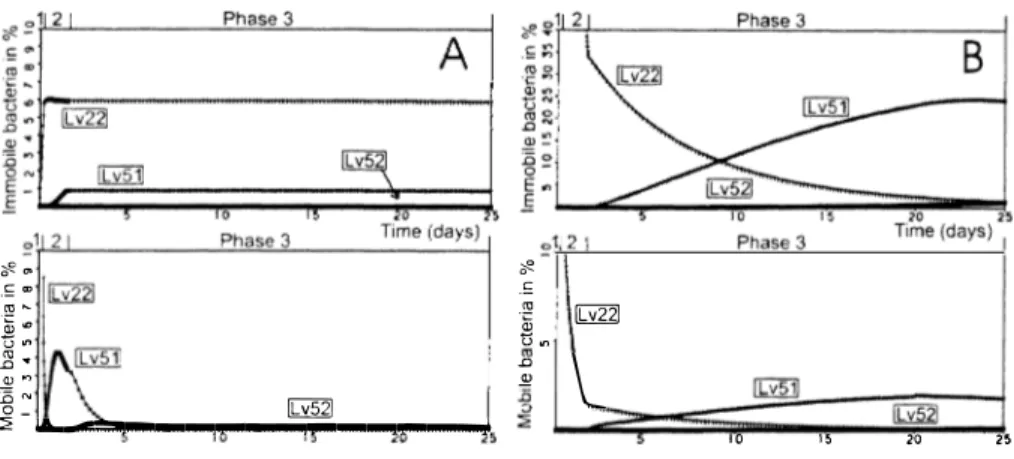
Figure 5 shows the simulated evolution in time of the mobile and immobile bacterial
1 concentrations in well L V22, LV5t1 and LV52 assuming a R1 of 14 and a T1 v-value of 0.06 d"t
(A) and 6.0 d"t (B). The slow upcoming rise of mobile bacteria in well LV5 1 in Figure 5B is contradictory to the observed field concentrations. Also, there is no distinct sign of arrival of the mobile bacteria in well L V52. On the other hand, Figure 5A illustrates that a smaller Tv
value does lead to a quick rise and somewhat slower descent of mobile bacteria in well L VS I as is seen in the field. Furthermore, a small increase in mobile bacterial concentration appears in L V52 as it does in the field. When a R1 of 2 is considered (Figure 6), the evolution of the
mobile bacterial concentration is approximately the same, although the appearance of the peak concentration has somewhat shifted in time. The main difference lies in the concentration of immobile bacteria. Unfortunately, due to practical reasons, no field data are available, so no decisive conclusions can be drawn. Both theories, however, support a relatively large mobility of strain DCA I in the subsurface.
starting from the linear equilibrium approach. Unfortunately, by the lack of quantitative data, an accurate fit between observed and simulated data is prohibited.
Kalmar ECO-TECH '05 and
The Second Baltic Symposium on Environmental Chemistry KALMAR. SWEDEN, November 28-30, 2005
'#- 11> £ 0,
"' �
j o u � 1l •" �
�
.!:"' li:illl
·as tl � D�
:g :
�
::i:IA.---�
\_
1 0 1 5 20 25Fif,llre 5: Evolution of mobile and immobile bacterial concentration with R1 14 and Tv 0. 06
cf (A) and 6 0 cf1 (B), � �1 ? l ,£ 11> ro m Phase 3
t
lbilll
1i�r---J
a, • :3 .., � N E _ __ [bYfil]_vs_1_�_vs_2_..,..______..,.__ ..._ 5 1 0 1 5 20 25o1 2 Phase 3 Time (days)
Figure 6: Evolution of mobile and immobile bacterial concentration with Rf 2 and Tv 0. 06 cf 1.
5 DISCUSSION
In situ bioaugmentation holds the promise of a simpler, cheaper and more environmentally
friendly cleanup technique for 1,2-DCA contaminated reductive aquifers than the more commonly used pump-and-treat technologies. However, the limited amount of information available on the parameters controlling the complex combination of microbiological and hydrogeological processes occurring in such polluted environments, often limits its implementation. Here, the usefulness of preliminary field tests to help identify these parameters and the additional value of numerical modelling for the design and interpretation
[9] Lovley, D. R., 2003. Cleaning up with genomics: applying molecular biology to bioremediation. Nature reviews., Microbiology 35-44.
[l OJ Mc Neill, J.D., Bosnar, M., Snelgrove, F.B., 1990. Resolution of an electromagnetic
borehole conductivity logger for teotechnical and ground water applications, Technical
Note TN-25, Geonics Limited.
[11] Oude Essink, G.H.P., 1998. MOCJD adapted to simulate JD Density-Dependent
Groundwater Flow, In: Proc. MODFLOW'98 Conference, Golden, Colorado, USA,
The Second Baltic Symposium on Environmental Chemistry KALMAR, SWEDEN, November 28-30, 2005
pumping test followed by a forced gradient tracer test, enables the characterisation of hydrogeological and solute transport parameters, An in situ transport test demonstrates the relatively high mobility of strain DCA l in the subsurface, With this knowledge, the successful execution of this promising bioremediation strategy can be developed.
REFERENCES
[1] Belsley, D. A., 1990. Conditioning diagnostics: collinearity and week data in
regression. New York, John Wiley & Sons, 292 p.
[2] De Wildeman, S., Verstraete, W., 2003. The quest for microbial reductive dechlorination of C2 to C4 chloroalkanes is warranted. Appl. Microbial. Biotechnol. 61, 94-102.
[3] De Wildeman, S., Diekert, G., Van Langenhove, H., Verstraete, W., 2003. Stereoselective Microbial Dehalorespiration with Vicinal Dichlorinated Alkanes.
Applied and Environmental Microbiology 69(9), 5643-5647.
[4] De Wildeman, S., Linthout, G., Van Langenhove, H., 2004. Complete Lab-scale Detoxification of Groundwater containing 1,2-dichloroethane. Applied Microbiology
and Biotechnology 63(5), 609-612.
[5] Haggerty, R., Golerick, S. M., 1994. Design of multiple contaminant remediation: sensitivity to rate-limited mass transfer. Water Resources Research 30, 435-446. [6] Konikow, L. F., Grove, D.B., 1997. Derivations describing solute-transport in ground
water. U.S.G.S. Water Resources Investigation Report 77-19 (Revised from 1984), 30
p.
[7] Lebbe, L., 1999. Hydraulic Parameter Identification., Generalized Interpretation
method for single and multiple pumping tests. Springer-Verslag, Berlin Heidelberg, 359
p.
[8] Lindqvist, R., Bengtsson, G., 1991. Dispersal dynamics in ground water bacteria.
Microb. Ecol. 21, 49-72.
291-303.
[12] Phanikumar, M. S., Hyndman, D. W., Wiggert, D. C., Dybas, M. J., Witt, M. E., Criddle, C. S., 2002. Simulation of microbial transport and carbon tetrachloride biodegradation in intermittently-fed aquifer columns. Water Resources Research 38(4), 1-13.
[13] Van Meir, N., Lebbe, L., 2005. Parameter identification for axi-symmetric density dependent groundwater flow based on drawdown and concentration data. J Hydro!. 309, 167-177.
[14] Vandenbohede, A., Lebbe, L., 2003b. Combined Interpretation of Pumping and Tracer Tests: Theoretical Considerations and Illustration with a Field Test. J Hydro!. 277, 134-149.
[15] Vandenbohede, A., Lebbe, L., Double forced gradient tracer test: performance and interpretation of a field test using a new solute transport model. J llydrol. (in press).