Report number: 2015:20 ISSN: 2000-0456 Available at www.stralsakerhetsmyndigheten.se
Guide for thyroid monitoring in
the event of release of radioactive
iodine in a nuclear emergency
2015:20
Author: Mats Isaksson
SSM 2015:20
SSM perspective
Abstract
This report aims to serve as a guide in the execution of a thyroid
moni-toring program for laboratories with responsibility to respond with
measurement capacity to a nuclear emergency.
Background
The dose contribution to the committed effective dose of
131I
accumu-lated in thyroids can be considerable as has been repeatedly shown
in nuclear accidents. This makes thyroid monitoring, together with
the short half-life of
131I (8 days), relatively urgent in the intermediate
phase of response to a nuclear emergency.
Objectives of the project
Enhance preparedness regarding in vivo thyroid monitoring
Results
For different times after intake, measured values in net count rate or
dose rate are given for example instruments at the levels of the
commit-ted effective dose corresponding to a “no thyroid exposure” (< 1 mSv),
the lower (20 mSv) and upper (200 mSv) action levels.
2015:20
Author:
Date: May 2015
Report number: 2015:20 ISSN: 2000-0456 Available at www.stralsakerhetsmyndigheten.se
Mats Isaksson 1), Lilian del Risco Norrlid 2)
1) Göteborgs universitet 2) Strålsäkerhetsmyndigheten
Guide for thyroid monitoring in
the event of release of radioactive
iodine in a nuclear emergency
This report concerns a study which has been conducted for the
Swedish Radiation Safety Authority, SSM. The conclusions and
view-points presented in the report are those of the author/authors and
do not necessarily coincide with those of the SSM.
SSM 2015:20
Content
Abstract ... 2
1. Thyroid monitoring in a nuclear emergency ... 3
1.1. Action levels coupled to thyroid monitoring ... 3
1.2. Monitoring flow chart ... 4
1.3. Intake of stable iodine ... 6
1.4. Contribution of other radionuclides to the thyroid dose ... 6
2. From monitored activity in the thyroid to the effective dose ... 7
2.1. General assumptions ... 7
2.2. Committed effective dose per unit of the activity accumulated in the thyroid at monitoring time ... 8
2.3. Threshold values corresponding to action levels ... 9
2.4. “No thyroid exposure” level ... 10
3. Dose conversion coefficients for selected instruments ... 12
3.1 Exploranium GR-135 ... 13
3.2 IndentiFinder ... 15
3.3 Uptake meter THEO 10 ... 17
References ... 19
Abstract
This report aims to serve as a guide in the execution of a thyroid monitoring pro-gram during the intermediate phase of response to a nuclear emergency. Calibration factors for some instruments verified in the framework of the Nordic project THY-ROID (Nyander P. 2014) are listed here as an example. For different times after the intake, we present in this guide the measured values in net count rate or dose rate for example instruments at the levels of the committed effective dose corresponding to a “no thyroid exposure” (< 1 mSv), the lower (20 mSv) and upper (200 mSv) action levels.
SSM 2015:20 2
Abstract
This report aims to serve as a guide in the execution of a thyroid monitoring pro-gram during the intermediate phase of response to a nuclear emergency. Calibration factors for some instruments verified in the framework of the Nordic project THY-ROID (Nyander P. 2014) are listed here as an example. For different times after the intake, we present in this guide the measured values in net count rate or dose rate for example instruments at the levels of the committed effective dose corresponding to a “no thyroid exposure” (< 1 mSv), the lower (20 mSv) and upper (200 mSv) action levels.
3
1. Thyroid monitoring in a
nuclear emergency
The response to a nuclear emergency is based on plans where predetermined opera-tional intervention levels have been set up. According to the Nordic guidelines on the protective measures in early and intermediate phases of response, thyroid moni-toring is not usually needed as ground for decisions in the early phase (NEP, 2014). The Nordic countries have agreed upon the automatic implementation of iodine prophylaxis with of iodine pills (KI) in the early phase, for residents nearby the nuclear facility and in the areas where predictions on thyroid doses exceed 50 mGy for adults and 10 mGy for children less than 18 years of age. The dose contribution
from iodine -131 (131I) accumulated in thyroids to the committed effective dose can
be considerable. This together with the short half-life of 131I (8 days) makes thyroid
monitoring a relatively urgent matter in the intermediate phase of response. A thyroid monitoring program aims to identify the individuals, who may have
in-haled or ingested 131I in an amount that give rise to thyroid equivalent and effective
doses exceeding the projected dose specified by the authority. The projected dose is the effective dose (often model-predicted) that would be expected to be incurred as consequence of the nuclear emergency (NEP 2014).
The projected dose is set as criterion for the decision of starting a thyroid monitoring program. The corresponding operational intervention levels are, for adults, dose
rates over 100 µSv/h and/or iodine air concentration over 10 000 Bq/m3 for two
days; for children, 10 µSv/h and/or iodine air concentration over 1 000 Bq/m3 for
two days (NEP 2014).
The results of the monitoring program are useful for the assessment of thyroid doses to the different age-groups of the population that could have been exposed. These results will also serve for verifying the early phase predictions of thyroid doses based on the simulation of the transport of the radioactive plume.
General decisions concerning the allocation of responsibilities for the provision of information to the public and specifically to the persons that should be monitored, the activation of monitoring response plans, as well as the handling and storage of the monitoring data are managed by national authorities and are not in the scope of this report.
1.1. Action levels coupled to thyroid monitoring
Two levels in terms of committed effective dose are recommended (Rojas-Palma 2009): an upper action level at 200 mSv and a lower action level at 20 mSv. That is,
ALU = 200 mSv and ALL = 20 mSv. A level called “no thyroid exposure” is usually
set to a committed effective dose of 1 mSv. This “no exposure” level serves the purpose of sorting out the individuals for whom no significant exposure can be con-firmed.
The actions corresponding to the different levels can be summarized as follows: Action level 1, for measurements over the “no-exposure level but under 20 mSv:
- Provision of information
- Consider giving priority to children in long term monitoring program Action level 2, for measurements over 20 mSv and under 200 mSv:
- Provision of information
- Consider additional thyroid and whole body monitoring (give priority to children)
- Include in long term monitoring program Action level 3, for measurements over 200 mSv:
- Provision of information - Referral for medical assessment
- Additional thyroid and whole body monitoring (give priority to children) - Include in long term monitoring program
1.2. Monitoring flow chart
The flow diagram below can support laboratories in the execution of the thyroid monitoring program.
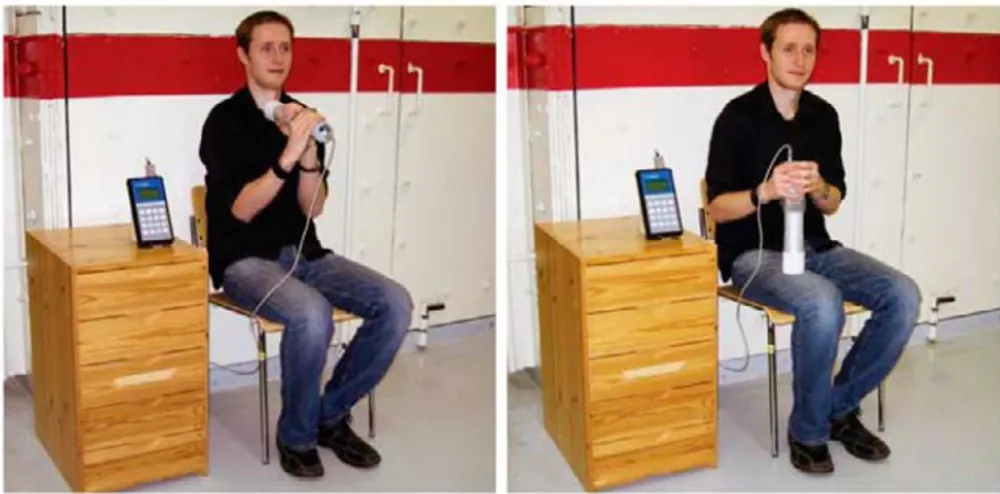
In the diagram, the average environmental count rate, B, is the average reading in the location selected for the reception of possible contaminated persons. The average thyroid count rate, C, is the reading of the instrument placed close to the skin of the neck of the subject, with the subject standing or sitting alone in the monitoring room. The average body count rate, CB, is the reading for the instrument placed close to the skin of one of the subjects’ lower thighs, as recommended by (Rojas-Palma 2009). Figure 1 illustrates the measurement to obtain C, to the left and to obtain CB, to the right.
All preparations preceding the start of the monitoring program such as personal resources, instruments’ readiness, location, access to decontamination facilities, etc. must be covered by the preparedness plans of the responders to nuclear emergencies.
Figure 1: Illustration for thyroid (C) and corresponding body background (CB) measurement, as recommended in TMT handbook (Rojas-Palma 2009)
SSM 2015:20 4
- Provision of information
- Consider giving priority to children in long term monitoring program Action level 2, for measurements over 20 mSv and under 200 mSv:
- Provision of information
- Consider additional thyroid and whole body monitoring (give priority to children)
- Include in long term monitoring program Action level 3, for measurements over 200 mSv:
- Provision of information - Referral for medical assessment
- Additional thyroid and whole body monitoring (give priority to children) - Include in long term monitoring program
1.2. Monitoring flow chart
The flow diagram below can support laboratories in the execution of the thyroid monitoring program.
In the diagram, the average environmental count rate, B, is the average reading in the location selected for the reception of possible contaminated persons. The average thyroid count rate, C, is the reading of the instrument placed close to the skin of the neck of the subject, with the subject standing or sitting alone in the monitoring room. The average body count rate, CB, is the reading for the instrument placed close to the skin of one of the subjects’ lower thighs, as recommended by (Rojas-Palma 2009). Figure 1 illustrates the measurement to obtain C, to the left and to obtain CB, to the right.
All preparations preceding the start of the monitoring program such as personal resources, instruments’ readiness, location, access to decontamination facilities, etc. must be covered by the preparedness plans of the responders to nuclear emergencies.
Figure 1: Illustration for thyroid (C) and corresponding body background (CB) measurement, as recommended in TMT handbook (Rojas-Palma 2009)
5
Begin
measure the average environmental background count rate, B
measure the average thyroid count rate, C
thyroid contamination
not found End
measurement of the average body background count rate, CB
C > 2 x CB ? C > 2 x B ?
check for skin/clothes contamination Is contamination larger than 2CB? decontami-nation procedure C - CB ³ ”no exposure”? (tables 9, 12, 15) thyroid contamination
not found End
No Yes
thyroid contamination
not found End
No ”no exposure” < C – CB ≤ ALL? (tables 8,11,14) Yes Yes Yes ALL < C – CB ≤ ALU ? (tables 8,11,14) No C – CB > ALU ? (tables 8,11,14) No No No thyroid contamination is present
Yes level 1Action End
thyroid contamination
is present Action level 2 End
Yes
thyroid contamination
is present level 3Action End
Yes
End
1.3. Intake of stable iodine
The intake of stable iodine pills will block the accumulation of radioactive iodine in the thyroid. If stable iodine is administered before the exposure to the radioactive plum containing radioiodines, all radioactive iodine will be blocked. If, however, stable iodine is administered more than 10 h after the exposure, the values provided in tables 1 – 4 and 7 – 15 in this guide should be used with caution since the block-ing factor can be highly variable.
1.4. Contribution of other radionuclides to the thyroid
dose
The contribution to the equivalent thyroid dose from ingestion of long-lived radio-nuclides such as cesium-137 is small and can be considered negligible if proper food restrictions have been put in place (Minenko 2006). The contribution from the ex-ternal exposure coming from the ground deposition is also small and depends on the geographical distribution of this deposition and should be assessed based on meas-urement data (Minenko 2006).
Three other radioactive isotopes of iodine and two precursor isotopes of tellurium
behave in the reactor, in the environment, and the human body similarly to 131I.
These are 132I (2.3 h), 133I (20.8 h), 135I (6.6 h), 131mTe (30 h) precursor of 131I and
132Te (78.2 h) precursor of 132I. The contributions to the equivalent thyroid dose
from 133I and 135I have been found both in Chernobyl and Fukushima to be well
under 1 % of the contribution from 131I (Shinkarev 2014).
For the case of 132I and its precursor 132Te, the contribution to the thyroid dose is
determined by the dominant pathway of the internal contamination. In Chernobyl the consumption of local cow milk was the main pathway and the contribution to the
equivalent thyroid dose from 132I and 132Te ranged between 2 – 5 % of the
contribu-tion of 131I (Gavrilin 2004).
If the dominant pathway for the internal contamination is inhalation, as it was in
Fukushima, depending on the ratio 132Te/131I at reactor shutdown and because of the
main form of 132Te is aerosol, the contribution to the equivalent thyroid dose may be
considerable higher. In the Fukushima scenario it has been found that 132I and 132Te
these contributed to the equivalent thyroid dose by up to 40 % of the contribution
from 131I, for one year old children (Shinkarev 2014).
If the presence of short-lived radioiodines such as 132I, 133I, 135I is not considered,
instruments that show a reading as count rate in cps would overestimate the commit-ted effective dose just after a reactor release. From 12 hours and after the release, the contribution to the instruments reading from short-lived radioiodines and short-lived
SSM 2015:20 6
1.3. Intake of stable iodine
The intake of stable iodine pills will block the accumulation of radioactive iodine in the thyroid. If stable iodine is administered before the exposure to the radioactive plum containing radioiodines, all radioactive iodine will be blocked. If, however, stable iodine is administered more than 10 h after the exposure, the values provided in tables 1 – 4 and 7 – 15 in this guide should be used with caution since the block-ing factor can be highly variable.
1.4. Contribution of other radionuclides to the thyroid
dose
The contribution to the equivalent thyroid dose from ingestion of long-lived radio-nuclides such as cesium-137 is small and can be considered negligible if proper food restrictions have been put in place (Minenko 2006). The contribution from the ex-ternal exposure coming from the ground deposition is also small and depends on the geographical distribution of this deposition and should be assessed based on meas-urement data (Minenko 2006).
Three other radioactive isotopes of iodine and two precursor isotopes of tellurium
behave in the reactor, in the environment, and the human body similarly to 131I.
These are 132I (2.3 h), 133I (20.8 h), 135I (6.6 h), 131mTe (30 h) precursor of 131I and
132Te (78.2 h) precursor of 132I. The contributions to the equivalent thyroid dose
from 133I and 135I have been found both in Chernobyl and Fukushima to be well
under 1 % of the contribution from 131I (Shinkarev 2014).
For the case of 132I and its precursor 132Te, the contribution to the thyroid dose is
determined by the dominant pathway of the internal contamination. In Chernobyl the consumption of local cow milk was the main pathway and the contribution to the
equivalent thyroid dose from 132I and 132Te ranged between 2 – 5 % of the
contribu-tion of 131I (Gavrilin 2004).
If the dominant pathway for the internal contamination is inhalation, as it was in
Fukushima, depending on the ratio 132Te/131I at reactor shutdown and because of the
main form of 132Te is aerosol, the contribution to the equivalent thyroid dose may be
considerable higher. In the Fukushima scenario it has been found that 132I and 132Te
these contributed to the equivalent thyroid dose by up to 40 % of the contribution
from 131I, for one year old children (Shinkarev 2014).
If the presence of short-lived radioiodines such as 132I, 133I, 135I is not considered,
instruments that show a reading as count rate in cps would overestimate the commit-ted effective dose just after a reactor release. From 12 hours and after the release, the contribution to the instruments reading from short-lived radioiodines and short-lived
radiotelluriums can be considered negligible, except for 131I.
7
2. From monitored activity in
the thyroid to the effective
dose
2.1. General assumptions
Different quantities can be measured depending on the instruments that are used. A net count rate in units of cps is recorded by most intensimeters. Also dose rate me-ters displaying µSv/h can be used. The instrument’s reading can be converted to
thyroid 131I activity in Becquerel by applying the proper calibration factor. For a
calibration procedure example regarding 131I in thyroids see (Nyander P. 2014). The
activity obtained is, however, NOT the actual intake but the 131I activity that has
accumulated in the thyroid at the measurement time.
The biokinetics of 131I is described in the ICRP Publication 56 by a
three-compartment model (ICRP 1990), see Figure 2. After entering the blood, either from
the gastrointestinal tract or from the lungs (ingestion or inhalation), 131I is
accumu-lated and thereafter cleared. The recycling of iodine is due to the production of hor-mone in the thyroid gland, which is circulated in the body.
Figure 2. Three-compartment model of iodine biokinetics, from ICRP 56.
Inhalation of iodine in particulate form will result in absorption of 30 – 40 % into the blood, depending on the particle size and solubility in the lungs. Different chem-ical forms of iodine, aerosol particle size and solubility will influence the result of the calculation of committed equivalent thyroid dose and committed effective dose.
Figure 3 shows the retention, including physical decay, of 131I in the thyroid after
intake of 1 Bq from inhalation and ingestion, respectively.
The retention curve for e.g. inhalation shows the fraction of the inhaled activity in the thyroid at various times after intake. If the time of intake is known it is then possible to determine the inhaled activity from a measurement of the activity in the thyroid.
Figure 3. Retention and clearance of 131I after an intake of 1 Bq via ingestion and inhalation.
2.2. Committed effective dose per unit of the activity
accumulated in the thyroid at monitoring time
The committed effective dose is calculated by dose coefficients from ICRP report 119 (ICRP 2012). In Figure 4 the dose coefficients are shown graphically. Table 1 contain the values of the dose coefficient (mSv/Bq) for various age groups, relating
the measured 131I activity in the thyroid at various times after intake to the
commit-ted effective dose.
The data from Table 1 may be used in case of a reactor release, if the time between release and measurement is more than 12 h. Otherwise; the measurement will be disturbed by the presence of short-lived iodine isotopes. In case of a laboratory
acci-dent, where only 131I is handled, the data may be used from 1 hour after inhalation.
Figure 4. Dose coefficients (mSv per Bq) for adults, showing a minimum at 1 d after intake due to the shape of the retention function. The activity refers to the 131I activity measured in the
thyroid at the specified time after intake and the dose refers to the effective dose. 0,00 0,05 0,10 0,15 0,20 0,25 0,30 0 5 10 15 20 Ac tiv ity in thy roi d (B q)
Time after intake (days)
Ingestion Inhalation 0,0000 0,0002 0,0004 0,0006 0,0008 0,0010 0,0012 0 5 10 15 20 m Sv p er Bq me asured in th yro id
Time between intake and measurement / d
SSM 2015:20 8
Figure 3. Retention and clearance of 131I after an intake of 1 Bq via ingestion and inhalation.
2.2. Committed effective dose per unit of the activity
accumulated in the thyroid at monitoring time
The committed effective dose is calculated by dose coefficients from ICRP report 119 (ICRP 2012). In Figure 4 the dose coefficients are shown graphically. Table 1 contain the values of the dose coefficient (mSv/Bq) for various age groups, relating
the measured 131I activity in the thyroid at various times after intake to the
commit-ted effective dose.
The data from Table 1 may be used in case of a reactor release, if the time between release and measurement is more than 12 h. Otherwise; the measurement will be disturbed by the presence of short-lived iodine isotopes. In case of a laboratory
acci-dent, where only 131I is handled, the data may be used from 1 hour after inhalation.
Figure 4. Dose coefficients (mSv per Bq) for adults, showing a minimum at 1 d after intake due to the shape of the retention function. The activity refers to the 131I activity measured in the
thyroid at the specified time after intake and the dose refers to the effective dose. 0,00 0,05 0,10 0,15 0,20 0,25 0,30 0 5 10 15 20 Ac tiv ity in thy roi d (B q)
Time after intake (days)
Ingestion Inhalation 0,0000 0,0002 0,0004 0,0006 0,0008 0,0010 0,0012 0 5 10 15 20 m Sv p er Bq me asured in th yro id
Time between intake and measurement / d
Dose coefficient, adult
9
Assuming that the dose to the thyroid dominates among other contributions to the effective dose, the thyroid committed equivalent dose is obtained by dividing the
committed effective dose by the organ weighting factor, wT, for the thyroid, which is
0.05 (ICRP 2007).
Table 1. Dose coefficients (mSv per Bq) for various age groups calculated from the retention function and dose coefficients given in ICRP report 119 (ICRP, 2012). The activity given here is the 131I activity measured in the thyroid at the specified time after intake.
Dose coefficient (mSv per Bq) Time elapsed
between intake and monitoring
Infants & <1 a 5 a 10 a 15 a Adult
1 hour 0.011 0.0057 0.0029 0.0017 0.0011 2 hours 0.0051 0.0026 0.0013 0.00078 0.00052 3 hours 0.0034 0.0017 0.00089 0.00052 0.00035 4 hours 0.0026 0.0013 0.00067 0.00039 0.00026 6 hours 0.0018 0.00091 0.00047 0.00027 0.00018 8 hours 0.0014 0.00072 0.00037 0.00021 0.00014 12 hours 0.0011 0.00055 0.00028 0.00016 0.00011 1 day 0.00083 0.00043 0.00022 0.00013 0.00009 4 days 0.0010 0.00052 0.00027 0.00015 0.00010 6 days 0.0012 0.00062 0.00032 0.00019 0.00012 8 days 0.0015 0.00075 0.00039 0.00022 0.00015 10 days 0.0018 0.00091 0.00047 0.00027 0.00018 12 days 0.0021 0.0011 0.00056 0.00033 0.00022 14 days 0.0026 0.0013 0.00068 0.00039 0.00026 16 days 0.0031 0.0016 0.00082 0.00047 0.00032 18 days 0.0037 0.0019 0.0010 0.00057 0.00039 20 days 0.0045 0.0023 0.0012 0.00069 0.00046
2.3. Threshold values corresponding to action levels
The activities measured during thyroid monitoring corresponding to the lower (20 mSv) and upper (200 mSv) action levels, are given in Table 2 and Table 3 tively. These values are 20 and 200 times the inverted values from Table 1, respec-tively.
The data from Table 2 & 3 may be used in case of a reactor release, if the time be-tween release and measurement is more than 12 h. Otherwise; the measurement will be disturbed by the presence of short-lived iodine isotopes. In case of a laboratory
accident, where only 131I is handled, the data may be used from 1 hour after
inhala-tion.
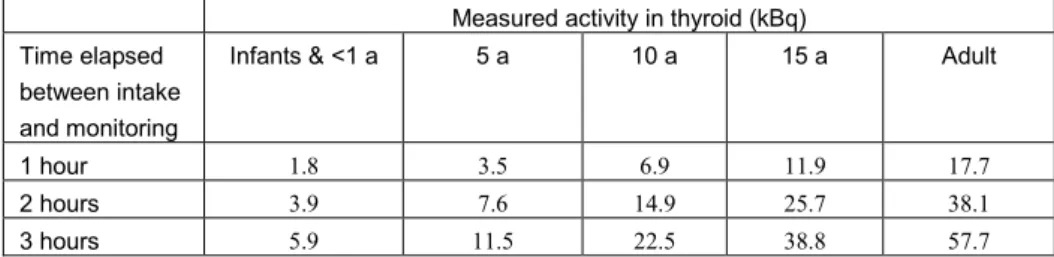
Table 2. Activity (in kBq) measured in the thyroid at various times after intake, corresponding to an intake that will give a committed effective dose of 20 mSv.
Measured activity in thyroid (kBq) Time elapsed
between intake and monitoring
Infants & <1 a 5 a 10 a 15 a Adult
1 hour 1.8 3.5 6.9 11.9 17.7
2 hours 3.9 7.6 14.9 25.7 38.1
4 hours 7.8 15.3 29.7 51.3 76.3 6 hours 11.3 22.0 42.9 74.0 110.1 8 hours 14.3 27.8 54.1 93.5 138.9 12 hours 18.7 36.5 71.0 122.6 182.3 1 day 24.2 47.0 91.6 158.2 235.1 4 days 19.9 38.7 75.3 130.1 193.4 6 days 16.5 32.0 62.4 107.7 160.1 8 days 13.6 26.5 51.7 89.2 132.6 10 days 11.3 22.0 42.8 73.9 109.9 12 days 9.4 18.2 35.5 61.3 91.1 14 days 7.8 15.1 29.4 50.8 75.5 16 days 6.4 12.5 24.4 42.1 62.6 18 days 5.3 10.4 20.2 34.9 51.9 20 days 4.4 8.6 16.8 29.0 43.1
Table 3. Activity (in kBq) measured in the thyroid at various times after intake, corresponding to an intake that will give a committed effective dose of 200 mSv.
Measured activity in thyroid (Bq) Time elapsed
between intake and monitoring
Infants & <1 a 5 a 10 a 15 a Adult
1 hour 18.2 35.4 68.9 118.9 176.8 2 hours 39.2 76.3 148.6 256.6 381.4 3 hours 59.3 115.4 224.7 388.1 576.9 4 hours 78.4 152.5 297.0 513.1 762.6 6 hours 113.1 220.1 428.6 740.4 1100.5 8 hours 142.8 277.8 541.0 934.5 1389.2 12 hours 187.3 364.5 709.9 1226.1 1822.6 1 day 241.7 470.3 915.8 1581.8 2351.3 4 days 198.8 386.8 753.2 1301.0 1934.0 6 days 164.6 320.2 623.6 1077.2 1601.2 8 days 136.3 265.2 516.5 892.1 1326.2 10 days 112.9 219.7 427.9 739.1 1098.7 12 days 93.6 182.1 354.6 612.6 910.6 14 days 77.6 151.0 294.0 507.8 754.9 16 days 64.3 125.2 243.8 421.1 625.9 18 days 53.4 103.8 202.2 349.2 519.1 20 days 44.3 86.1 167.7 289.7 430.6
2.4. “No thyroid exposure” level
The “no thyroid exposure” is the activity measured during thyroid monitoring as-sumed to give a committed effective dose of 1 mSv as maximum. It can be deter-mined as the inverse of the values in Table 1. This data in Table 4 may be used in case of a reactor release, if the time between release and measurement is more than 12 h. Otherwise; the measurement will be disturbed by the presence of short-lived
iodine isotopes. In case of a laboratory accident, where only 131I is handled, the data
SSM 2015:20 10 4 hours 7.8 15.3 29.7 51.3 76.3 6 hours 11.3 22.0 42.9 74.0 110.1 8 hours 14.3 27.8 54.1 93.5 138.9 12 hours 18.7 36.5 71.0 122.6 182.3 1 day 24.2 47.0 91.6 158.2 235.1 4 days 19.9 38.7 75.3 130.1 193.4 6 days 16.5 32.0 62.4 107.7 160.1 8 days 13.6 26.5 51.7 89.2 132.6 10 days 11.3 22.0 42.8 73.9 109.9 12 days 9.4 18.2 35.5 61.3 91.1 14 days 7.8 15.1 29.4 50.8 75.5 16 days 6.4 12.5 24.4 42.1 62.6 18 days 5.3 10.4 20.2 34.9 51.9 20 days 4.4 8.6 16.8 29.0 43.1
Table 3. Activity (in kBq) measured in the thyroid at various times after intake, corresponding to an intake that will give a committed effective dose of 200 mSv.
Measured activity in thyroid (Bq) Time elapsed
between intake and monitoring
Infants & <1 a 5 a 10 a 15 a Adult
1 hour 18.2 35.4 68.9 118.9 176.8 2 hours 39.2 76.3 148.6 256.6 381.4 3 hours 59.3 115.4 224.7 388.1 576.9 4 hours 78.4 152.5 297.0 513.1 762.6 6 hours 113.1 220.1 428.6 740.4 1100.5 8 hours 142.8 277.8 541.0 934.5 1389.2 12 hours 187.3 364.5 709.9 1226.1 1822.6 1 day 241.7 470.3 915.8 1581.8 2351.3 4 days 198.8 386.8 753.2 1301.0 1934.0 6 days 164.6 320.2 623.6 1077.2 1601.2 8 days 136.3 265.2 516.5 892.1 1326.2 10 days 112.9 219.7 427.9 739.1 1098.7 12 days 93.6 182.1 354.6 612.6 910.6 14 days 77.6 151.0 294.0 507.8 754.9 16 days 64.3 125.2 243.8 421.1 625.9 18 days 53.4 103.8 202.2 349.2 519.1 20 days 44.3 86.1 167.7 289.7 430.6
2.4. “No thyroid exposure” level
The “no thyroid exposure” is the activity measured during thyroid monitoring as-sumed to give a committed effective dose of 1 mSv as maximum. It can be deter-mined as the inverse of the values in Table 1. This data in Table 4 may be used in case of a reactor release, if the time between release and measurement is more than 12 h. Otherwise; the measurement will be disturbed by the presence of short-lived
iodine isotopes. In case of a laboratory accident, where only 131I is handled, the data
may be used from 1 hour after inhalation.
11
Table 4. Activity (in kBq) measured in the thyroid at various times after intake, corresponding to an intake that will give a committed effective dose of 1 mSv.
Measured activity in thyroid (kBq) Time between
intake and monitoring
Infants & <1 a 5 a 10 a 15 a Adult
1 hour 0.091 0.177 0.344 0.595 0.884 2 hours 0.196 0.381 0.743 1.283 1.907 3 hours 0.296 0.577 1.123 1.94 2.884 4 hours 0.392 0.763 1.485 2.565 3.813 6 hours 0.566 1.101 2.143 3.702 5.503 8 hours 0.714 1.389 2.705 4.673 6.946 12 hours 0.937 1.823 3.549 6.131 9.113 1 day 1.208 2.351 4.579 7.909 11.757 4 days 0.994 1.934 3.766 6.505 9.67 6 days 0.823 1.601 3.118 5.386 8.006 8 days 0.682 1.326 2.583 4.461 6.631 10 days 0.565 1.099 2.14 3.696 5.494 12 days 0.468 0.911 1.773 3.063 4.553 14 days 0.388 0.755 1.47 2.539 3.774 16 days 0.322 0.626 1.219 2.105 3.13 18 days 0.267 0.519 1.011 1.746 2.596 20 days 0.221 0.431 0.839 1.448 2.153
3. Dose conversion
coeffi-cients for selected
in-struments
The instruments in this report were selected from those calibrated under the Nordic project THYROID in 2014 (Nyander P. 2014). The measured quantities were count rate in units of cps, for counters, spectrometers and gamma cameras, and ambient dose rate in units of µSv/h, for dose rate meters. Table 5 summarizes the main fea-tures of example instruments.
Table 5. Main features of example instruments (Nyander P., 2014). MCA stands for signal handling by multichannel analyser.
The calibration factors for activity in thyroid given, as example, in Table 6 serve only as a guide. The calibration of these instruments was performed using
mock-iodine as a substitute for 131I. The mock-iodine consists of a mix of 133Ba and 137Cs
and the calibration factor will depend on the settings of energy range for each indi-vidual instrument. The calibration factors given in Table 6 are corrected to show the
activity of 131I. A discussion of this correction is given in (Nyander P. 2014).
Table 6. Example calibration factors for the instruments described in Table 5.
The Tables 7 – 15 list the conversion factors to obtain the committed effective dose per unit of the measurement quantity, and the values of the measurements quantities corresponding to the upper, lower and “no exposure” dose levels, at different time intervals between intake and monitoring, for children, young and adults.
Tables 7 – 9 correspond to the counter Exploranium GR-135, monitoring at close distance; Tables 10 -13 to the dose rate meter IdentiFINDER, monitoring at close
Instrument Type Technical specifications
Detector Volume (mm3) Electronic
SAIC Exploranium GR-135 Spectrometer NaI 65 MCA
FLIR IdentiFINDER2 Dose rate meter NaI 49 MCA
Theo10 Spectrometer NaI 110 MCA
Instrument Unit Calibration
distance (cm) Calibration factor Child (5 y) Young (13 – 16y) Adult (over 18y) SAIC Exploranium GR-135 Bq per cps 0 50 71 110 FLIR IdentiFINDER Bq per µSv/h 0 15843 20622 35634
SSM 2015:20 12
3. Dose conversion
coeffi-cients for selected
in-struments
The instruments in this report were selected from those calibrated under the Nordic project THYROID in 2014 (Nyander P. 2014). The measured quantities were count rate in units of cps, for counters, spectrometers and gamma cameras, and ambient dose rate in units of µSv/h, for dose rate meters. Table 5 summarizes the main fea-tures of example instruments.
Table 5. Main features of example instruments (Nyander P., 2014). MCA stands for signal handling by multichannel analyser.
The calibration factors for activity in thyroid given, as example, in Table 6 serve only as a guide. The calibration of these instruments was performed using
mock-iodine as a substitute for 131I. The mock-iodine consists of a mix of 133Ba and 137Cs
and the calibration factor will depend on the settings of energy range for each indi-vidual instrument. The calibration factors given in Table 6 are corrected to show the
activity of 131I. A discussion of this correction is given in (Nyander P. 2014).
Table 6. Example calibration factors for the instruments described in Table 5.
The Tables 7 – 15 list the conversion factors to obtain the committed effective dose per unit of the measurement quantity, and the values of the measurements quantities corresponding to the upper, lower and “no exposure” dose levels, at different time intervals between intake and monitoring, for children, young and adults.
Tables 7 – 9 correspond to the counter Exploranium GR-135, monitoring at close distance; Tables 10 -13 to the dose rate meter IdentiFINDER, monitoring at close
Instrument Type Technical specifications
Detector Volume (mm3) Electronic
SAIC Exploranium GR-135 Spectrometer NaI 65 MCA
FLIR IdentiFINDER2 Dose rate meter NaI 49 MCA
Theo10 Spectrometer NaI 110 MCA
Instrument Unit Calibration
distance (cm) Calibration factor Child (5 y) Young (13 – 16y) Adult (over 18y) SAIC Exploranium GR-135 Bq per cps 0 50 71 110 FLIR IdentiFINDER Bq per µSv/h 0 15843 20622 35634
Theo10 Bq per cps 10 813 902 1021
13
distance; Tables 13 – 15 correspond to the uptake meter Theo10, monitoring at 10 cm away from the neck.
In case the main contribution to the effective dose is just the thyroid dose, to obtain the committed equivalent dose to the thyroid the values in tables 7, 10 and 13 should be multiply by a factor of 20.
3.1 Exploranium GR-135
3.1.1. Committed effective dose per unit of the measurement
quantity
Table 7. Committed effective dose per units of the net monitored count rate with the spectromet-ric instrument Exploranium GR-135 monitoring at close distance
Dose conversion factor for Exploranium GR-135 monitoring at close
distance (mSv per cps) Time from suspected
intake to monitoring Child (5 y) Young (13 – 16y) Adult (over 18y) 1 hour 0.283 0.119 0.124 2 hours 0.131 0.055 0.058 3 hours 0.087 0.037 0.038 4 hours 0.066 0.028 0.029 6 hours 0.045 0.019 0.020 8 hours 0.036 0.015 0.016 12 hours 0.027 0.012 0.012 1 day 0.021 0.009 0.009 4 days 0.026 0.011 0.011 6 days 0.031 0.013 0.014 8 days 0.038 0.016 0.017 10 days 0.046 0.019 0.020 12 days 0.055 0.023 0.024 14 days 0.066 0.028 0.029 16 days 0.080 0.034 0.035 18 days 0.096 0.041 0.042 20 days 0.116 0.049 0.051
3.1.2. Threshold values corresponding to the action levels
Table 8. Net count rate thresholds corresponding to the upper and lower action levels (ALU =
200 mSv, ALL = 20 mSv) for the spectrometric instrument Exploranium GR-135 monitoring
at close distance
Thresholds for Exploranium GR-135 monitoring at close distance (cps)
Upper action level Lower action level Time from
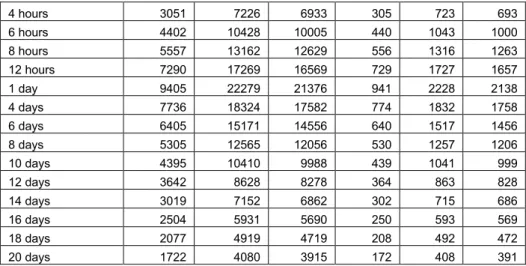
suspect-ed intake to moni-toring Child (5 y) Young (13 – 16y) Adult (over 18y) Child (5 y) Young (13 – 16y) Adult (over 18y) 1 hour 707 1675 1607 71 167 161 2 hours 1526 3614 3468 153 361 347 3 hours 2308 5466 5244 231 547 524
4 hours 3051 7226 6933 305 723 693 6 hours 4402 10428 10005 440 1043 1000 8 hours 5557 13162 12629 556 1316 1263 12 hours 7290 17269 16569 729 1727 1657 1 day 9405 22279 21376 941 2228 2138 4 days 7736 18324 17582 774 1832 1758 6 days 6405 15171 14556 640 1517 1456 8 days 5305 12565 12056 530 1257 1206 10 days 4395 10410 9988 439 1041 999 12 days 3642 8628 8278 364 863 828 14 days 3019 7152 6862 302 715 686 16 days 2504 5931 5690 250 593 569 18 days 2077 4919 4719 208 492 472 20 days 1722 4080 3915 172 408 391
3.1.3. “No thyroid exposure” values
Table 9. Maximum net count rate to confirm a “no thyroid exposure” level (E ≤ 1 mSv) for the dose rate meter Exploranium GR-135 monitoring at close distance
No thyroid exposure level for Exploranium GR-135 monitoring at
close distance (cps) Time from suspected
intake to monitoring Child (5 y) Young (13 – 16y) Adult (over 18y) 1 hour 3.54 8.37 8.04 2 hours 7.63 18.07 17.34 3 hours 11.54 27.33 26.22 4 hours 15.25 36.13 34.67 6 hours 22.01 52.14 50.02 8 hours 27.78 65.81 63.14 12 hours 36.45 86.35 82.85 1 day 47.03 111.39 106.88 4 days 38.68 91.62 87.91 6 days 32.02 75.86 72.78 8 days 26.52 62.83 60.28 10 days 21.97 52.05 49.94 12 days 18.21 43.14 41.39 14 days 15.10 35.76 34.31 16 days 12.52 29.65 28.45 18 days 10.38 24.59 23.60 20 days 8.61 20.40 19.57
SSM 2015:20 14 4 hours 3051 7226 6933 305 723 693 6 hours 4402 10428 10005 440 1043 1000 8 hours 5557 13162 12629 556 1316 1263 12 hours 7290 17269 16569 729 1727 1657 1 day 9405 22279 21376 941 2228 2138 4 days 7736 18324 17582 774 1832 1758 6 days 6405 15171 14556 640 1517 1456 8 days 5305 12565 12056 530 1257 1206 10 days 4395 10410 9988 439 1041 999 12 days 3642 8628 8278 364 863 828 14 days 3019 7152 6862 302 715 686 16 days 2504 5931 5690 250 593 569 18 days 2077 4919 4719 208 492 472 20 days 1722 4080 3915 172 408 391
3.1.3. “No thyroid exposure” values
Table 9. Maximum net count rate to confirm a “no thyroid exposure” level (E ≤ 1 mSv) for the dose rate meter Exploranium GR-135 monitoring at close distance
No thyroid exposure level for Exploranium GR-135 monitoring at
close distance (cps) Time from suspected
intake to monitoring Child (5 y) Young (13 – 16y) Adult (over 18y) 1 hour 3.54 8.37 8.04 2 hours 7.63 18.07 17.34 3 hours 11.54 27.33 26.22 4 hours 15.25 36.13 34.67 6 hours 22.01 52.14 50.02 8 hours 27.78 65.81 63.14 12 hours 36.45 86.35 82.85 1 day 47.03 111.39 106.88 4 days 38.68 91.62 87.91 6 days 32.02 75.86 72.78 8 days 26.52 62.83 60.28 10 days 21.97 52.05 49.94 12 days 18.21 43.14 41.39 14 days 15.10 35.76 34.31 16 days 12.52 29.65 28.45 18 days 10.38 24.59 23.60 20 days 8.61 20.40 19.57 15
3.2 IndentiFinder
3.2.1. Committed effective dose per unit of the measurement
quantity
Table 10 Committed effective dose per units of the net monitored dose rate with the dose rate meter IdentiFinder monitoring at close distance
Dose conversion factor for IdentiFinder monitoring at close distance
(mSv per µSv/h) Time from suspected
intake to monitoring Child (5 y) Young (13 – 16y) Adult (over 18y) 1 hour 89.62 34.68 40.31 2 hours 41.54 16.07 18.68 3 hours 27.46 10.63 12.35 4 hours 20.77 8.04 9.34 6 hours 14.40 5.57 6.48 8 hours 11.40 4.41 5.13 12 hours 8.69 3.36 3.91 1 day 6.74 2.61 3.03 4 days 8.19 3.17 3.69 6 days 9.89 3.83 4.45 8 days 11.95 4.62 5.37 10 days 14.42 5.58 6.49 12 days 17.40 6.73 7.83 14 days 20.99 8.12 9.44 16 days 25.31 9.79 11.39 18 days 30.52 11.81 13.73 20 days 36.79 14.24 16.55
3.2.2. Threshold values corresponding to the action levels
Table 11. Net dose rate thresholds corresponding to the upper and lower action levels (ALU =
200 mSv, ALL = 20 mSv) for the dose rate meter IdentiFinder monitoring at close distance
Thresholds for IdentiFinder monitoring at close distance (µSv/h)
Upper action level Lower action level Time from
suspect-ed intake to moni-toring Child (5 y) Young (13 – 16y) Adult (over 18y) Child (5 y) Young (13 – 16y) Adult (over 18y) 1 hour 2.23 5.77 4.96 0.22 0.58 0.50 2 hours 4.82 12.44 10.70 0.48 1.24 1.07 3 hours 7.28 18.82 16.19 0.73 1.88 1.62 4 hours 9.63 24.88 21.40 0.96 2.49 2.14 6 hours 13.89 35.90 30.88 1.39 3.59 3.09 8 hours 17.54 45.32 38.98 1.75 4.53 3.90 12 hours 23.01 59.46 51.15 2.30 5.95 5.11 1 day 29.68 76.70 65.99 2.97 7.67 6.60 4 days 24.41 63.09 54.27 2.44 6.31 5.43 6 days 20.21 52.23 44.93 2.02 5.22 4.49 8 days 16.74 43.26 37.22 1.67 4.33 3.72
10 days 13.87 35.84 30.83 1.39 3.58 3.08 12 days 11.49 29.70 25.55 1.15 2.97 2.56 14 days 9.53 24.63 21.18 0.95 2.46 2.12 16 days 7.90 20.42 17.57 0.79 2.04 1.76 18 days 6.55 16.94 14.57 0.66 1.69 1.46 20 days 5.44 14.05 12.08 0.54 1.40 1.21
3.1.3. “No thyroid exposure” values
Table 12. Maximum net count rate to confirm a “no thyroid exposure” level (E ≤ 1 mSv) for the dose rate meter Identifiender monitoring at close distance
No thyroid exposure level for IdentiFinder monitoring at close
dis-tance (µSv/h) Time from suspected
intake to monitoring Child (5 y) Young (13 – 16y) Adult (over 18y) 1 hour 0.011 0.029 0.025 2 hours 0.024 0.062 0.054 3 hours 0.036 0.094 0.081 4 hours 0.048 0.124 0.107 6 hours 0.069 0.180 0.154 8 hours 0.088 0.227 0.195 12 hours 0.115 0.297 0.256 1 day 0.148 0.384 0.330 4 days 0.122 0.315 0.271 6 days 0.101 0.261 0.225 8 days 0.084 0.216 0.186 10 days 0.069 0.179 0.154 12 days 0.057 0.149 0.128 14 days 0.048 0.123 0.106 16 days 0.040 0.102 0.088 18 days 0.033 0.085 0.073 20 days 0.027 0.070 0.060
SSM 2015:20 16 10 days 13.87 35.84 30.83 1.39 3.58 3.08 12 days 11.49 29.70 25.55 1.15 2.97 2.56 14 days 9.53 24.63 21.18 0.95 2.46 2.12 16 days 7.90 20.42 17.57 0.79 2.04 1.76 18 days 6.55 16.94 14.57 0.66 1.69 1.46 20 days 5.44 14.05 12.08 0.54 1.40 1.21
3.1.3. “No thyroid exposure” values
Table 12. Maximum net count rate to confirm a “no thyroid exposure” level (E ≤ 1 mSv) for the dose rate meter Identifiender monitoring at close distance
No thyroid exposure level for IdentiFinder monitoring at close
dis-tance (µSv/h) Time from suspected
intake to monitoring Child (5 y) Young (13 – 16y) Adult (over 18y) 1 hour 0.011 0.029 0.025 2 hours 0.024 0.062 0.054 3 hours 0.036 0.094 0.081 4 hours 0.048 0.124 0.107 6 hours 0.069 0.180 0.154 8 hours 0.088 0.227 0.195 12 hours 0.115 0.297 0.256 1 day 0.148 0.384 0.330 4 days 0.122 0.315 0.271 6 days 0.101 0.261 0.225 8 days 0.084 0.216 0.186 10 days 0.069 0.179 0.154 12 days 0.057 0.149 0.128 14 days 0.048 0.123 0.106 16 days 0.040 0.102 0.088 18 days 0.033 0.085 0.073 20 days 0.027 0.070 0.060 17
3.3 Uptake meter THEO 10
3.3.1. Committed effective dose per unit of the measurement
quantity
Table 13. Committed effective dose per units of the net monitored count rate with the uptake meter Theo10 monitoring at 10 cm distance from the neck
Dose conversion factor for Theo10 monitoring 10 cm distance from
the neck (mSv per cps) Time from suspected
intake to monitoring Child (5 y) Young (13 – 16y) Adult (over 18y) 1 hour 4.60 1.52 1.16 2 hours 2.13 0.70 0.54 3 hours 1.41 0.46 0.35 4 hours 1.07 0.35 0.27 6 hours 0.74 0.24 0.19 8 hours 0.59 0.19 0.15 12 hours 0.45 0.15 0.11 1 day 0.35 0.11 0.09 4 days 0.42 0.14 0.11 6 days 0.51 0.17 0.13 8 days 0.61 0.20 0.15 10 days 0.74 0.24 0.19 12 days 0.89 0.29 0.22 14 days 1.08 0.36 0.27 16 days 1.30 0.43 0.33 18 days 1.57 0.52 0.39 20 days 1.89 0.62 0.47
3.3.2. Threshold values corresponding to the action levels
Table 14. Net count rate thresholds corresponding to the upper and lower action levels (ALU =
200 mSv, ALL = 20 mSv) for the uptake meter Theo10 monitoring at 10 cm distance from
the neck
Thresholds for Theo10 monitoring at 10 cm distance
(cps)
Upper action level Lower action level Time from
suspect-ed intake to moni-toring Child (5 y) Young (13 – 16y) Adult (over 18y) Child (5 y) Young (13 – 16y) Adult (over 18y) 1 hour 43 132 173 4.35 13.18 17.31 2 hours 94 284 374 9.38 28.45 37.36 3 hours 142 430 565 14.19 43.03 56.50 4 hours 188 569 747 18.76 56.88 74.70 6 hours 271 821 1078 27.07 82.08 107.79 8 hours 342 1036 1361 34.17 103.61 136.06 12 hours 448 1359 1785 44.84 135.93 178.51 1 day 578 1754 2303 57.84 175.37 230.30 4 days 476 1442 1894 47.58 144.24 189.42 6 days 394 1194 1568 39.39 119.42 156.83
8 days 326 989 1299 32.62 98.91 129.89 10 days 270 819 1076 27.03 81.95 107.61 12 days 224 679 892 22.40 67.91 89.18 14 days 186 563 739 18.57 56.30 73.93 16 days 154 467 613 15.40 46.68 61.30 18 days 128 387 508 12.77 38.72 50.85 20 days 106 321 422 10.59 32.12 42.18
3.3.3. “No thyroid exposure” values
Table 15. Maximum net count rate to confirm a “no thyroid exposure” level (E ≤ 1 mSv) for the
uptake meter Theo10 monitoring 10 cm distance from the neck
No thyroid exposure level for Theo10 monitoring 10 cm distance (cps)
Time from suspected intake to monitoring Child (5 y) Young (13 – 16y) Adult (over 18y) 1 hour 0.22 0.66 0.87 2 hours 0.47 1.42 1.87 3 hours 0.71 2.15 2.83 4 hours 0.94 2.84 3.73 6 hours 1.35 4.10 5.39 8 hours 1.71 5.18 6.80 12 hours 2.24 6.80 8.93 1 day 2.89 8.77 11.51 4 days 2.38 7.21 9.47 6 days 1.97 5.97 7.84 8 days 1.63 4.95 6.49 10 days 1.35 4.10 5.38 12 days 1.12 3.40 4.46 14 days 0.93 2.81 3.70 16 days 0.77 2.33 3.07 18 days 0.64 1.94 2.54 20 days 0.53 1.61 2.11
SSM 2015:20 18 8 days 326 989 1299 32.62 98.91 129.89 10 days 270 819 1076 27.03 81.95 107.61 12 days 224 679 892 22.40 67.91 89.18 14 days 186 563 739 18.57 56.30 73.93 16 days 154 467 613 15.40 46.68 61.30 18 days 128 387 508 12.77 38.72 50.85 20 days 106 321 422 10.59 32.12 42.18
3.3.3. “No thyroid exposure” values
Table 15. Maximum net count rate to confirm a “no thyroid exposure” level (E ≤ 1 mSv) for the
uptake meter Theo10 monitoring 10 cm distance from the neck
No thyroid exposure level for Theo10 monitoring 10 cm distance (cps)
Time from suspected intake to monitoring Child (5 y) Young (13 – 16y) Adult (over 18y) 1 hour 0.22 0.66 0.87 2 hours 0.47 1.42 1.87 3 hours 0.71 2.15 2.83 4 hours 0.94 2.84 3.73 6 hours 1.35 4.10 5.39 8 hours 1.71 5.18 6.80 12 hours 2.24 6.80 8.93 1 day 2.89 8.77 11.51 4 days 2.38 7.21 9.47 6 days 1.97 5.97 7.84 8 days 1.63 4.95 6.49 10 days 1.35 4.10 5.38 12 days 1.12 3.40 4.46 14 days 0.93 2.81 3.70 16 days 0.77 2.33 3.07 18 days 0.64 1.94 2.54 20 days 0.53 1.61 2.11 19
References
Gavrilin 2004. Gavrilin Y., Khrouch V., Shinkarev S. et al., “Individual thyroid
dose estimates for a case-control study of Chernobyl-related thy-roid cancer among children of Belarus – Part I. Contributions from short-lived radioiodines (132I, 133I, 135I) and short-lived radiotelluriums (131mTe and 132Te)”, Health Physics 86 (6) 2004.
ICRP 2007. Recommendations of the International Commission on
Radiolog-ical Protection. ICRP Publication 103. Ann. ICRP 37 (2-4).
ICRP 2012. Compendium of Dose Coefficients based on ICRP Publication
60. ICRP Publication 119. Ann. ICRP 41(Suppl.).
Minnenko 2006. Minenko V. F., Ulanosky A. V., Drozdovitch V. V. et al., “Indi-vidual thyroid dose estimates for a case-control study of Cherno-byl-related thyroid cancer among children of Belarus – Part II. Contributions from long-lived radionuclides and external radia-tion”, Health Physics 90 (4) 2006.
NEP 2014. Nordic Guidelines and Recommendations, Protective Measures
in Early and Intermediate Phases of a Nuclear or Radiological Emergency, Nordic Emergency Preparedness Group - NEP. (http://www.stralsakerhetsmyndigheten.se/Global/Pressmeddelan den/2014/Nordic%20Flagbook%20February%202014.pdf) Nyander P. 2014. Nyander Poulsen A., Lind B., del Risco Norrlid L., et al.,
“As-sessment of accidental uptake of iodine-131 in emergency situa-tions”. Nordic nuclear safety research NKS-298. ISBN 978-87-7893-374-4
Rojas-Palma 2009. TMT handbook, Triage, Monitoring and Treatment of people exposed to ionising radiation following a malevolent act, SCK-CEN, NRPA, HPA, STUK, WHO 2009.
Shinkarev 2014. Shinkarev A., Kotenko K., Granovskaya E. et al., “Estimation of the contribution of short-lived radio-iodines to the thyroid dose for the public in case of inhalation intake following the Fuku-shima accident”, Proceedings of the 4th European Regional IR-PA Congress, Genève 2014
2015:20 The Swedish Radiation Safety Authority has a comprehensive responsibility to ensure that society is safe from the effects of radiation. The Authority works to achieve radiation safety in a number of areas: nuclear power, medical care as well as commercial products and services. The Authority also works to achieve protection from natural radiation and to increase the level of radiation safety internationally.
The Swedish Radiation Safety Authority works proactively and preventively to protect people and the environment from the harmful effects of radiation, now and in the future. The Authority issues regulations and supervises compliance, while also supporting research, providing training and information, and issuing advice. Often, activities involving radiation require licences issued by the Authority. The Swedish Radiation Safety Authority maintains emergency preparedness around the clock with the aim of limiting the aftermath of radiation accidents and the unintentional spreading of radioactive substances. The Authority participates in international co-operation in order to promote radiation safety and finances projects aiming to raise the level of radiation safety in certain Eastern European countries.
The Authority reports to the Ministry of the Environment and has around 300 employees with competencies in the fields of engineering, natural and behavioural sciences, law, economics and communications. We have received quality, environmental and working environment certification.