An
acoustical correlate to
"grain"
By
Doris
Axelsen
A study of
tone qualityIntroduction
A classification of "tonal phenomena" and their musical functions is presented by Pierre Schaeffer in his
book
Traité des objets musicaux(1966).
The author examines certain aspects of perceived sound qualities (such as: masse, dynamique, timbre, harmonique, profil mélodique, profil de masse, grain, allure) and classifies them into types, genres, species, and classes. He uses sounds and "noises" from music as well as from everyday life as clarifying examples.The "phenomène tonale" selected for study in this investigation is "grain”,
which is described by Schaeffer as the "perception des chocs distincts" or "une succession très rapide
des
chocs" (the perception of a succession of discrete pulses). "Grain" is closely bound to the instantaneous events in the development of a sound.The quality of "grain" is divided into three types, based on the way in which energy is maintained in the tone. Examples of the types of maintenance are (a)
a pizzicato tone on the violin (type: resonance, entretien nul), (b) a tone played on a flute (type: frottement, entretien soutenu), (c) a low tone sung by a human voice (type: itération, entretien itératif). Type (c) was chosen for study in the present investigation.
Schaeffer also works with genres of "grain", which are combinations of the pure types listed above: he has reduced these combinations to only six genres but explains that there are other possible combinations which can be perceived. An example of such combinations is the noise of a cart on paving stones: (a) the wheels "cry" (type: frottement), (b) the wheels
knock
severely (type: frappe- ment, discontinues harmoniques), (c) the shocks resound to the cart (type: resonance). The genres are classified according to the kinds of repetition perceived in the "grain": regular or aleatoric, rhythmical or progressive, tightened orexpanded.
The species of "grain", described as "ce critère hybride entre matière et forme" are qualifications of the dimensions of "grain" in music.
The mass and intensity of "grain" as well as its relationship to duration are examined, but Schaeffer states that this is an unexplored field An exemplification of this is "noise" in a musical tone. The classification of such cases leads Schaeffer to the conclusion that "grain" can only exist "in" a sound because it constitutes a property of the sonorous matter itself.
WAVE FORM
WAVE FORM
SPECTRUM
PARTIAL NUMBER
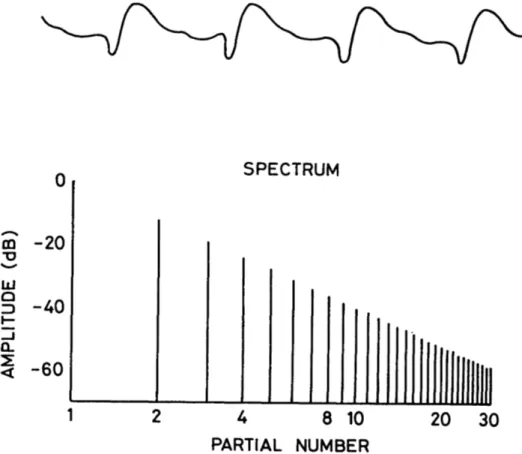
Fig. 1. Waveform and spectrum of the P stimuli.
of "grain". By comparisons of "grains" of the same type, gradations within a type can be studied. Examples are gradations from rustling to swarming to limpid, or rough to unpolished to smooth, or trembling to tightened to fine.
Problem
Apparently, there are good reasons for assuming that Schaeffer's "grain" describes a timbre quality which has a specific acoustic correlate. The aim of the present investigation is to find such a correlate; more specifically to find out if the degree of perceived "grain" could be predicted, given the signal characteristics,
Method
The method used in the present investigation was to isolate the plausible acoustic properties involved in the perception of "grain", vary them systematically in
a set of stimuli, present these stimuli to a group of listeners in a listening test,
study the responses, and relate them to our present knowledge of hearing. The word "grain" was translated by the Swedish adjective "kornig", which corresponds to English "grainy". "Kornig" is a derivative of the Swedish word "korn" just as
SPECTRUM
PARTIAL NUMBER
Fig. 2. Waveform and spectrum of the PLP stimuli.
"grainy" is derived from "grain". The word "grain" has the same meaning in English and French. It corresponds to the Swedish word "gryn" or "korn". The word chosen to express the opposite of "grain" was the Swedish word for "smooth", which is "slät".
The next consideration was to find a type of test stimulus which could be expected to have the characteristics of "grain" as described by Schaeffer. It was assumed that "grain" and "chocs distincts" characterize signals which have a
pulse-shaped wave form and which are consequently rich in partials. One of the types of signals chosen had this type of wave form and a spectrum envelope which falls off at - 6 d B per octave (Fig. 1).
A sound stimulus signal which can be said to represent the acoustical opposite of this pulse signal is a tone with a smooth wave form and thus few and weak overtones, i.e. a sinus tone.
This
was the second type of signal chosen. The thirdtype of stimulus was a tone which acoustically lay between a sinusoid and the described pulse, that is a pulse signal filtered by low-pass filter so that a steep
Fig. 3. Schematical representation of the stimuli in the test tape.
spectrum envelope fall was obtained (-12 dB per octave). (Fig. 2.) The stimuli will be abbreviated P for pulse tone, PLP for low-pass-filtered pulse tone, and S for sinusoid. The fundamental frequencies of the stimuli were 50, 83, 140, 234, 390, and 650 Hz.
The stimuli were generated on a Wavetek tone generator and recorded at the same intensity level on an Ampex tape recorder. The duration of each stimulus was two sec, and between the stimuli there was a silent interval of five sec (Fig. 3 ) . Each of the test stimuli was presented four times on the test tape.' The stimulus order was determined by random sampling. The test tape consisted of a total of
73 stimuli (3 stimulus types
×
6
fundamental frequencies X 4 presentations+
i).Test procedure
The subjects were tested individually in a quiet, isolated room. The stimuli were presented binaurally in Sennheiser HD 414 earphones at a sound pressure level (SPL) of approximately 65 dB, in all stimuli. The recorded test tape was played on a Tandberg tape recorder.
First, each subject was given a written statement explaining that tones can have different tone qualities. To illustrate this, three tone pairs were presented with the same fundamental frequencies but different spectra. Secondly, another written statement was given. This concerned the use of the words "kornig" and "slät" in judging the tone quality of the stimulus in the test, and gave instructions on the marking of the answers in the test. A pre-run of the first three or four stimuli in the test was presented to accustom the subjects to the timing of the stimuli presentations, particularly the length of the time between stimuli. Lastly, in an oral explanation, the subjects were asked to decide if the tones presented in the
test were "kornig" or "slät". Answers were marked after each test tone in one of the two columns on the test formula. The complete test, with tone examples, statements and test pre-run took about sixteen minutes.
In selecting subjects, familiarity with musical timbres and ability to describe auditory stimuli were considered essential. Sixteen male and female students
1 Due to an error in splicing the test tape, the stimulus PLP of 390 Hz fundamental frequency appeared five times on the tape. This error was not discovered until all listening tests had been done.
FUNDAMENTAL FREQUENCY (Hz)
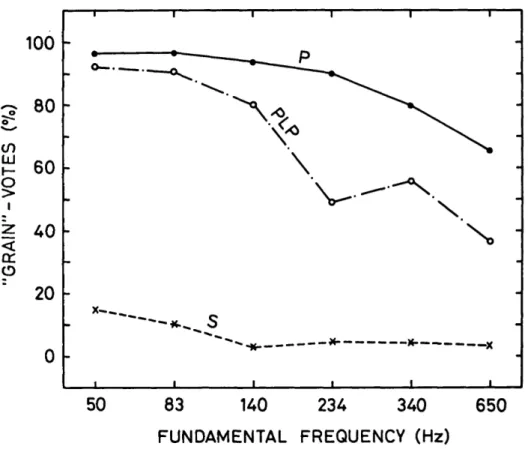
Fig. 4. Results of the listening test (see also Table I).
between the ages of 18 and
31
were chosen as subjects. Eleven of these were students at the State College of Music in Gothenburg, Sweden, the remaining five were third-year pupils at a gymnasium (graduating class), who were planningto enter the College. None of the subjects had any apparent hearing defects. Results
Fourteen of the sixteen subjects responded to all presented stimuli. The markings for 18 % of the responses were changed when the subjects heard the following stimulus as evidenced by erasures on the response form. Changing answers was apparently the result of comparing stimuli, which can be seen as an adaptation
to the neighbouring stimuli. Its effect on the results is reduced by the random ordering of the stimuli.
The results of one subject deviated considerably from the general trend in the remaining responses. Moreover, this subject responded in the same way to all four presentations of the same stimulus only in the case of one single stimulus. Nine of the sixteen subjects reported hearing "grain" in some of the S stimuli at least once. One of these subjects marked almost half of the P stimuli as "smooth". This is not in conformity with the responses of the other subjects. Two other subjects could not hear the S 50 Hz tones at all, although they heard the P and PLP
FUNDAMENTAL FREQUENCY
(Hz)
Fig. 5. Results of the listening test when only "consistent" sets of responses are considered.
Center
Frequency (kHz)
Fig. 6. The critical bandwidths. (After Zwicker & Feldtkeller, 1967.)stimuli of the same frequency. Possibly,
this
can be explained by the fact thatthere are many partials in the P and PLP tones, whereas in sinus tones the funda- mental is ideally the only physical partial. Presumably, in the case of the subjects reported here, the S 50
Hz
stimulus did not pass their hearing thresholdDisregarding these special cases, two clear trends were observed in the responses,
as can be seen in Fig. 4. (1) All subjects report hearing "grain" in most of the P stimuli, less so with the PLP stimuli. The sine wave stimuli were reported "smooth" with few exceptions. (2) Stimuli with low fundamental frequencies received more votes for "grain" than did stimuli with high fundamental fre- quencies.
This
applied to all types of stimuli, even though thePLP
stimulus of 234Hz
fundamental frequency received fewer votes for "grain" than thePLP
stimulus of 390
Hz.
These two main trends remain irrespective of whether or not all non-consistent sets of votes are eliminated, if by a non-consistent setof votes we mean those sets of 4 votes, given by a particular subject in response to a particular stimulus, which were not identical all 4 times this stimulus was judged in the test (Fig. 5 ) .
Interpretation
The results illustrated in Fig. 4 show that there are relationships between the
spectra and wave forms of the tones tested and the timbre qualities describable with the adjective pair "kornig-slät".
for the perception of roughness in tone quality. His results are very relevant to the present findings.
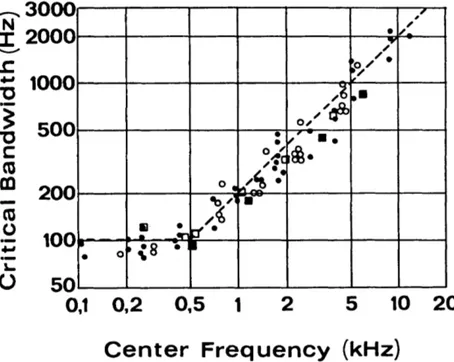
In Fig.
6
the critical bands are plotted as a function of their center frequencies. It can be seen that the critical bandwidth is about100
Hz up to a middle frequency of about 0.5 kHz; above that frequency it is nearly a minor third, i.e. 20 % of the middle frequency. It is independent of amplitude. Terhardt points out that amplitude modulation causes periodic sound fluctuations. He shows that such fluctuations correlate with the impression of "roughness". "Roughness" of this kind is likely to be related to "grain". An amplitude modulation can only take place when there are more than one partial in the same critical band. Thus, only such partials which excite a critical band in groups of two or more would contribute to "grain".The amplitude modulation should be greater if the number of partials exciting one and the same critical band is high. Therefore it is relevant to compute the average number of partials in the spectrum which fall into one critical band. Evidently this number must be equal to or greater than two. Needless to say, only those partials were considered that lie above the hearing threshold. The result is given in Table II.
In examining Table II we find that the average number of partials within a critical band is high where the number of votes for "grain" is high, i.e. the fundamental frequency dependence of the curves in Fig. 4 may correlate with the numbers in the table. On the other hand, the difference in the test result between the P and PLP stimuli cannot be accounted for by these numbers alone. For example, the value of 3.1 for the PLP 50 Hz stimulus is much too low to
account for the 92.5 % of 'the votes for "kornig" observed in the test responses as compared with the
96.8
% for the P 50 Hz which has the value of14.6.
As mentioned before, another relevant factor must be the amplitudes of the partials which fall into the same critical band. For the signals under consideration here a rough estimate of these amplitudes can be obtained by simply counting the average spectrum envelope fall per critical band. It is not very likely that a correlation will be found with a purely physical measure such as dB. Rather, the loudness level in phon can be assumed to be relevant, since it takes into account the frequency-dependent amplitude response of the ear. The average spectrum falls in terms of phon/critical band are listed in Table II. Again, it should be observed that only those partials that lie above the hearing threshold and which excite the critical bands at least pairwise are taken into account. This measure of average spectrum envelope fall seems to be inversely proportional
to the votes for "grain".
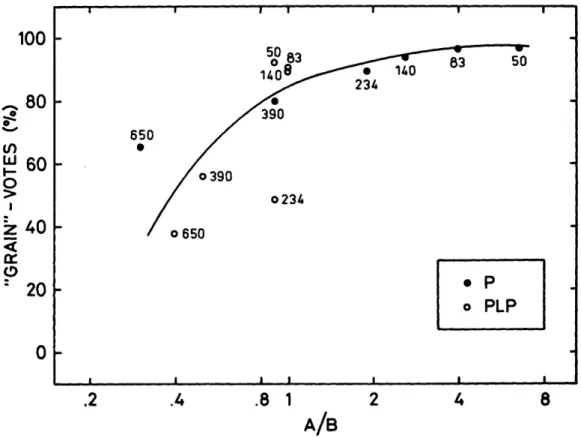
Summarizing, we can state that the average number of partials which fall in the same critical band seems to be proportional to the "grain" responses, whereas the average spectrum envelope fall in phon/critical band seems to display an inverse proportionality to the "grain" responses. Thus we may expect the ratio between these two values to correlate with the number of "grain" responses. In Fig. 7 the votes for "grain" are plotted as a function of this ratio. There seems
to be a reasonable correlation. However, the PLP 234 stimulus provides a marked
Fig. 7. Relationship between a spectral characteristic and the results of the listening test; for explanations see text and Table II.
exception. If we imagine a smooth uninterrupted fall for the PLP stimulus curve in Fig. 4, this stimulus would have about 70 % of the votes for "kornig", a value which would have fitted better in the diagram.
From this result it seems that the more partials a stimulus has per critical band the greater is the degree of "grain" perceived, and the smaller the amount of the spectrum fall, the more "grain" perceived. Apparently the curves shown in Fig. 7 can be used for rough approximations of the degree of "grain" in the two types of signals considered within the frequency range of 50 to 650
Hz.
The further generality of the results remains to be explored in future research.Conclusions
A majority of the P and PLP stimuli were perceived as "kornig" with the P stimuli receiving the most votes. Stimuli with low fundamental frequency received the largest number of votes for "grain" in both P and PLP stimuli. However, "grain" decreases more rapidly with rising fundamental frequency for the PLP stimuli than for the P stimuli.
"grain" as determined from the listening test.
This
ratio is the average number of partials which fall into the same critical band divided by the average spectrum envelope slope measured in phon/critical band.Acknowledgements
The test material for this investigation was made at the Department of Speech Communication, Royal Institute of Technology
(KTH),
Stockholm.Doc.
Johan Sundberg of that department is acknowledged for his scientific guidance and for preparing the present condensed and revised version of my thesis work.References
Schaeffer, P.: Traité des objets musicaux, Paris 1966.
Terhardt, E.: On the perception of periodic sound fluctuations (Roughness), Acustica
Vol. 30, 1974.
Nachrichtenempfänger, Stuttgart 1967. Zwicker, E. & Feldtkeller, R.: Das Ohr als
Fund. freq. Hz 50 83 140 2 34 390 650 Stimulus type P % 96.8 96.8 93.7 89.4 80.0 65.6 PLP % 95.2 90.6 79.6 48.4 56.2 37.5 S % 15.6 9.7 3.0 4.6 4.6 3.0 Table I. Percentage of "kornig" responses
P PLP "Grain" A "Grain" A B votes A B B votes A B 50 96.8 14.6 2.2 6.6 95.2 3.1 3.3 .9 83 96.8 8.4 2.1 4.0 90.6 2.9 3.0 1
.o
140 93.7 5.5 2.1 2.6 79.6 2.7 . 2.6 1.o
2 34 89.4 4.3 2.3 1.9 48.4 2.7 3.1 .9 390 80.0 3.3 3.7 .9 5 6.0 2.4 5.3 .5 65 O 65.6 2.7 7.8 .3 37.5 2.2 5.5 .4 % %Table II. Spectral characteristics of P and PLP stimuli
A = the average number of partials exciting one and the same critical band